-
 Create
account -
 Discover profitable
strategies -
 Connect exchange
& start earning
Algorithmic Strategies & Backtesting results for GFS
Here are some GFS trading strategies along with their past performance. You can validate these strategies (and many more) for free on Vestinda across thousands of assets and many years of historical data.
Algorithmic Trading Strategy: Keltner Channel and SuperTrend Trend-Following on GFS
Based on the backtesting results from October 28, 2021, to November 7, 2023, the trading strategy exhibits a positive profit factor of 1.28, indicating that the total profit generated is 1.28 times the total loss. The annualized ROI for this period is at 2.52%, suggesting an average annual return of the invested capital. The average holding time for each trade stands at 7 weeks and 2 days, implying a longer-term approach to trading. With an average of 0.07 trades per week, the strategy shows a cautious and less frequent trading approach. The backtest resulted in a total of 8 closed trades, with a return on investment of 5.14%. However, it is important to note that the winning trades percentage is relatively low at 37.5%, which implies a less successful strategy in terms of winning trades.
 GFS
GFS

Choose another period and try again.
Algorithmic Trading Strategy: VWAP and KAMA Confirmation on GFS
During the backtesting period from October 28, 2021 to November 7, 2023, the trading strategy showcased promising results. With a profit factor of 1.75 and an annualized return on investment (ROI) of 22.91%, this strategy proved to be proficient in generating profits. On average, positions were held for approximately 1 week and 6 days, and the frequency of trades remained relatively low at 0.21 trades per week. Out of the 23 closed trades, 47.83% were winners. Furthermore, the strategy outperformed the buy-and-hold approach, generating excess returns of 38.47%. These statistics highlight the proficiency of the trading strategy and its potential for success in the market.
GFS
Choose another period and try again.
GFS Trading Strategies: Unlocking Success with Globalfoundries
Introduction
Globalfoundries Inc. (GFS) is a major player in the semiconductor manufacturing industry, offering valuable opportunities for traders due to its price volatility and growth potential. Using strategic trading approaches, investors can capitalize on price movements and build a disciplined, data-driven approach. This guide outlines actionable trading strategies tailored for GFS, using indicators and risk management to unlock consistent success.
Why Trade GFS?
- Industry Position: As a key semiconductor supplier, GFS stands to benefit from global demand, making it attractive for both short-term and long-term trading strategies.
- Volatility and Opportunity: GFS’s price often reflects industry trends, providing multiple trading opportunities as market conditions shift.
- Data-Driven Trading: Implementing technical indicators and structured strategies allows traders to capitalize on GFS’s price movements efficiently.
Effective Trading Strategies for GFS:
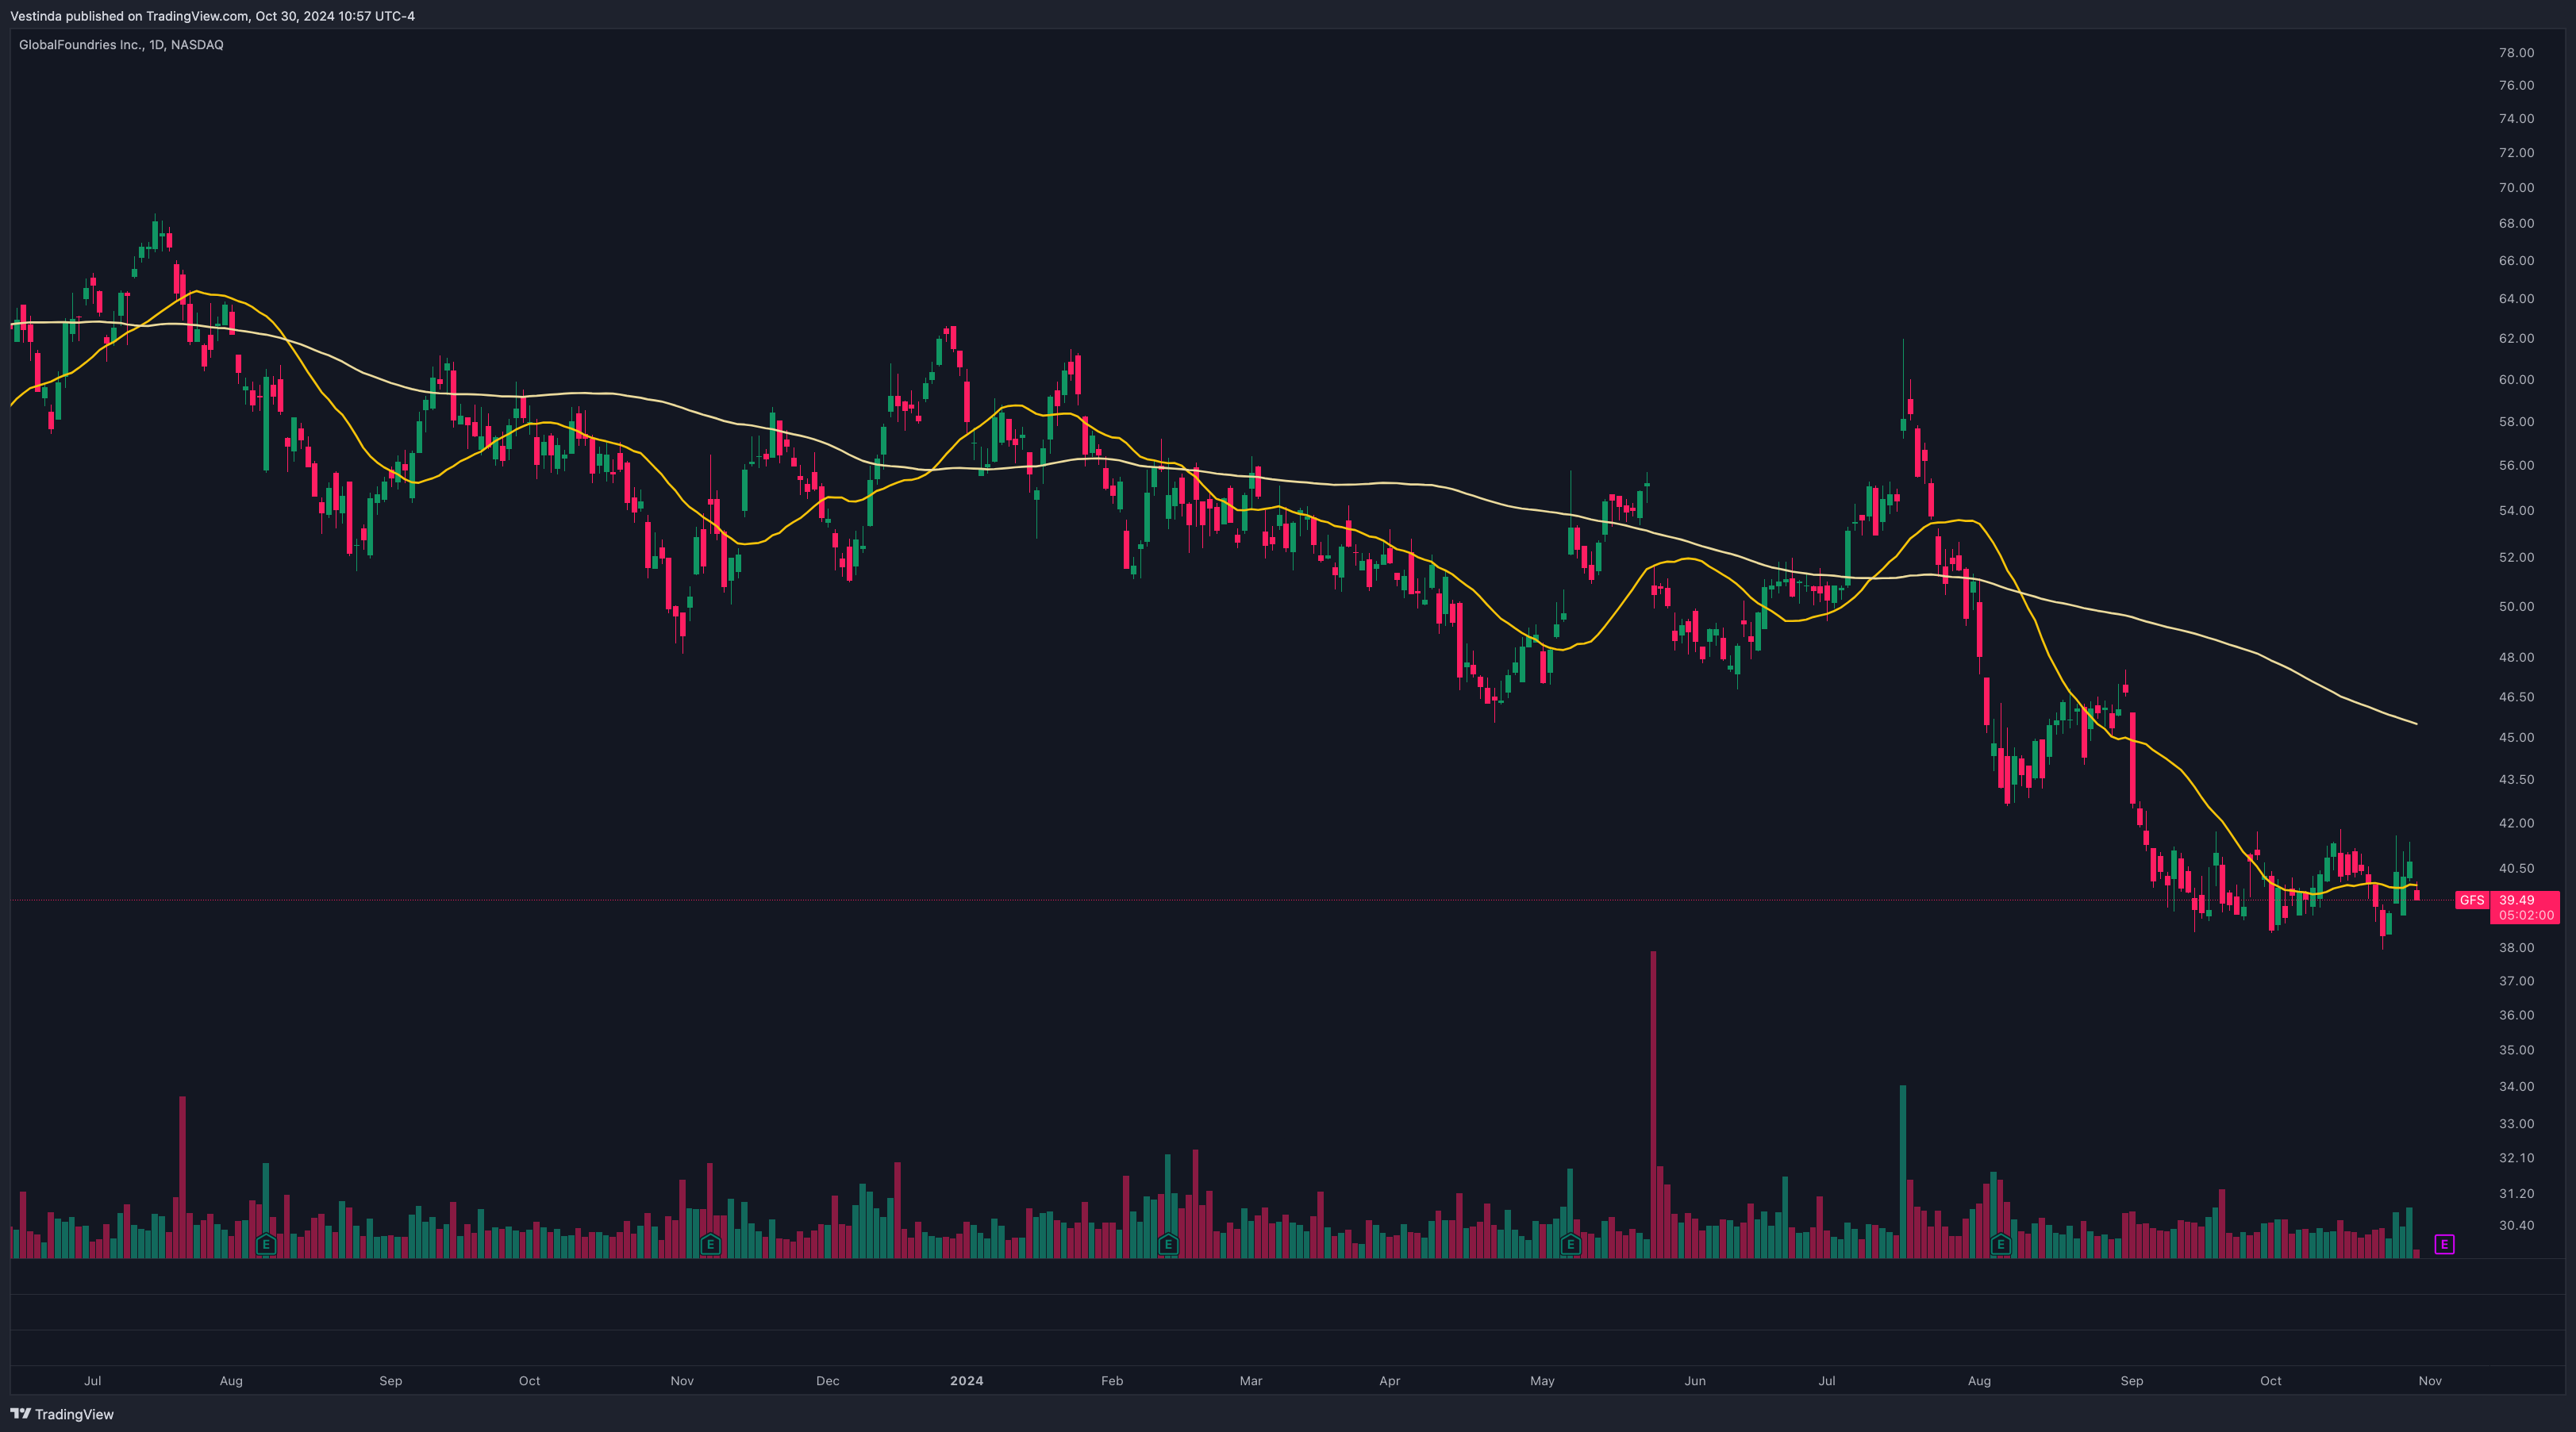
20/100 Moving Average Crossover Strategy:
Concept: Using the 20-day and 100-day moving averages to track medium-term trends in GFS, helping capture both bullish and bearish shifts.
Why It Works: Moving average crossovers reveal trend changes, reducing the impact of minor fluctuations and identifying sustained moves in GFS.
How to Implement:
- Indicators: Set up the 20-day (short-term) and 100-day (medium-term) moving averages.
- Entry and Exit: Buy GFS when the 20-day MA crosses above the 100-day MA (bullish signal) and sell when the 20-day MA crosses below the 100-day MA (bearish signal).
- Automation Tip: Program your system to execute trades based on these crossovers, allowing for consistent entries and exits aligned with GFS trends.
Relative Strength Index (RSI) for Overbought/Oversold Conditions:
Concept: RSI highlights momentum changes, identifying when GFS is potentially overbought or oversold, helping traders enter at favorable points.
Why It Works: RSI allows traders to buy low and sell high by capturing reversals, optimizing entries, and exits within trending or range-bound markets.
How to Implement:
- Indicators: Apply RSI with a 14-period setting.
- Entry and Exit: Buy when RSI is below 30 (oversold) and sell when RSI exceeds 70 (overbought).
- Automation Tip: Program your trading algorithm to enter or exit trades based on RSI thresholds, capturing momentum shifts with precision.
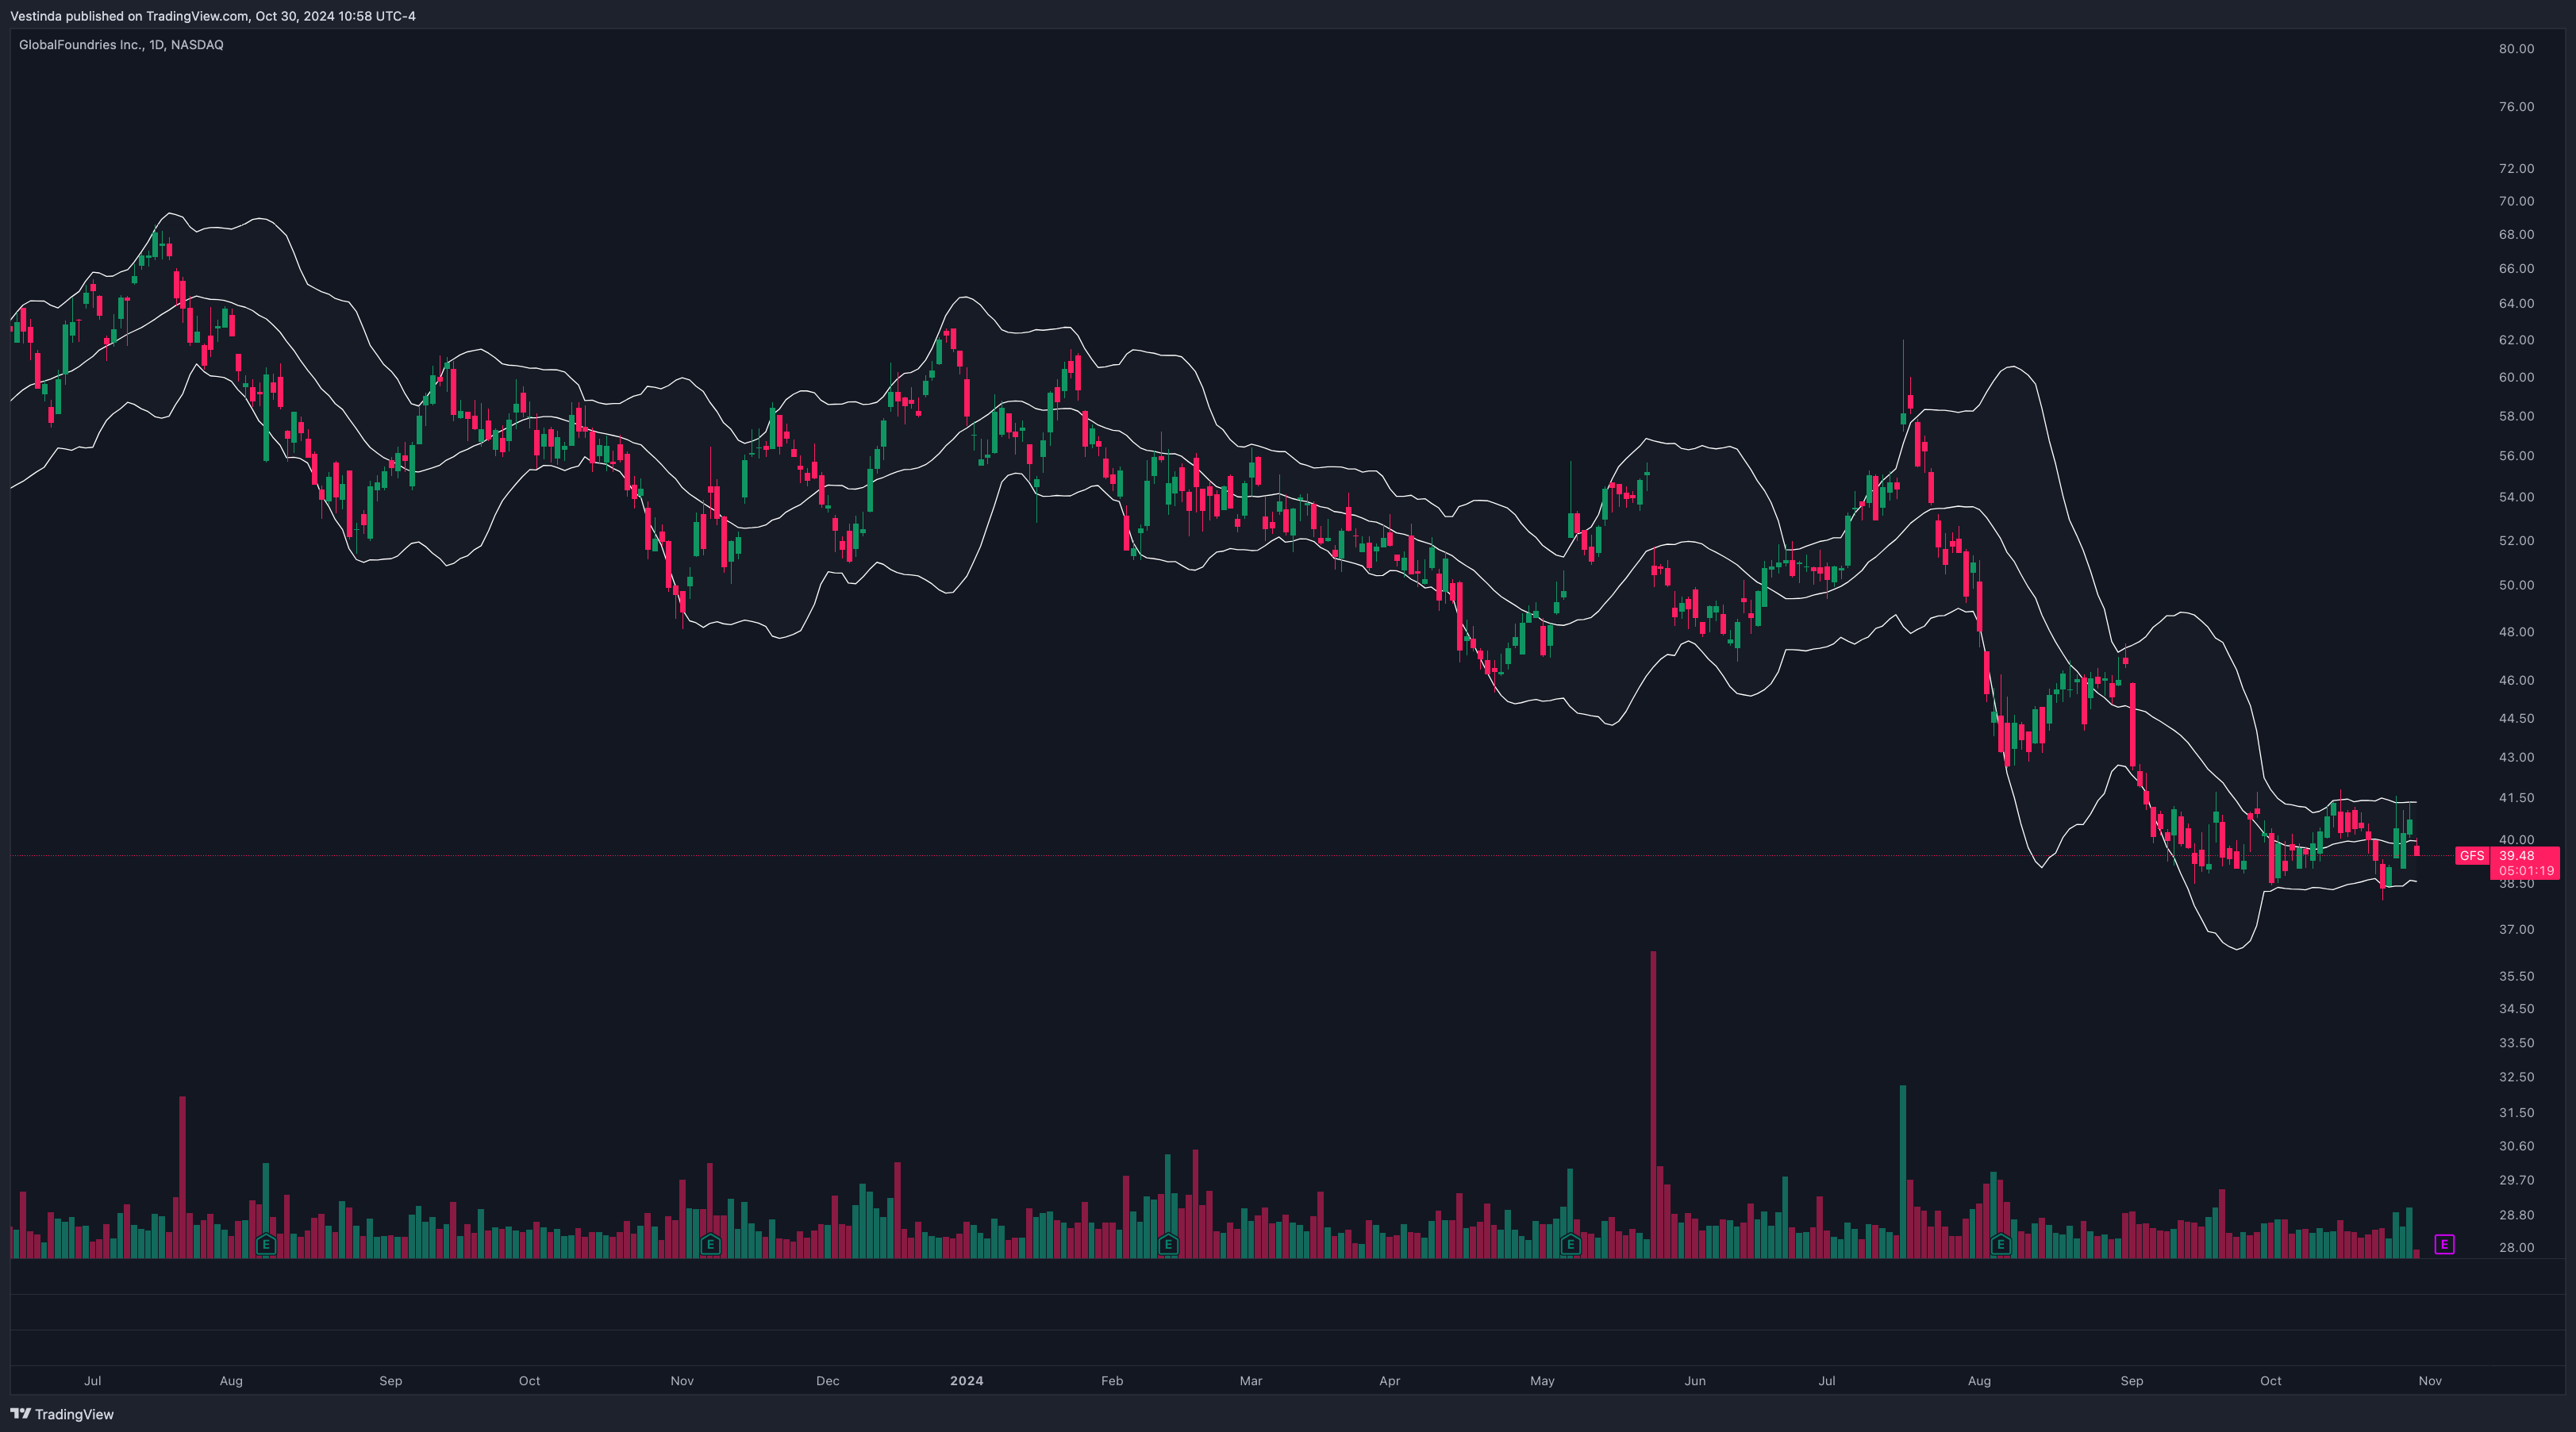
Bollinger Bands for Volatility-Based Trades:
Concept: Bollinger Bands provide a range based on price volatility, allowing traders to identify high-probability reversal points.
Why It Works: Bollinger Bands are effective in detecting overextended moves, with prices often reverting toward the mean after hitting the upper or lower bands.
How to Implement:
- Indicators: Set Bollinger Bands with a 20-day moving average and 2 standard deviations.
- Entry and Exit: Buy GFS when the price touches the lower Bollinger Band and sell when it nears the upper band, aiming for reversion to the mean.
- Automation Tip: Configure your system to trade on band touches, setting stop-loss orders outside the bands to protect against false signals.
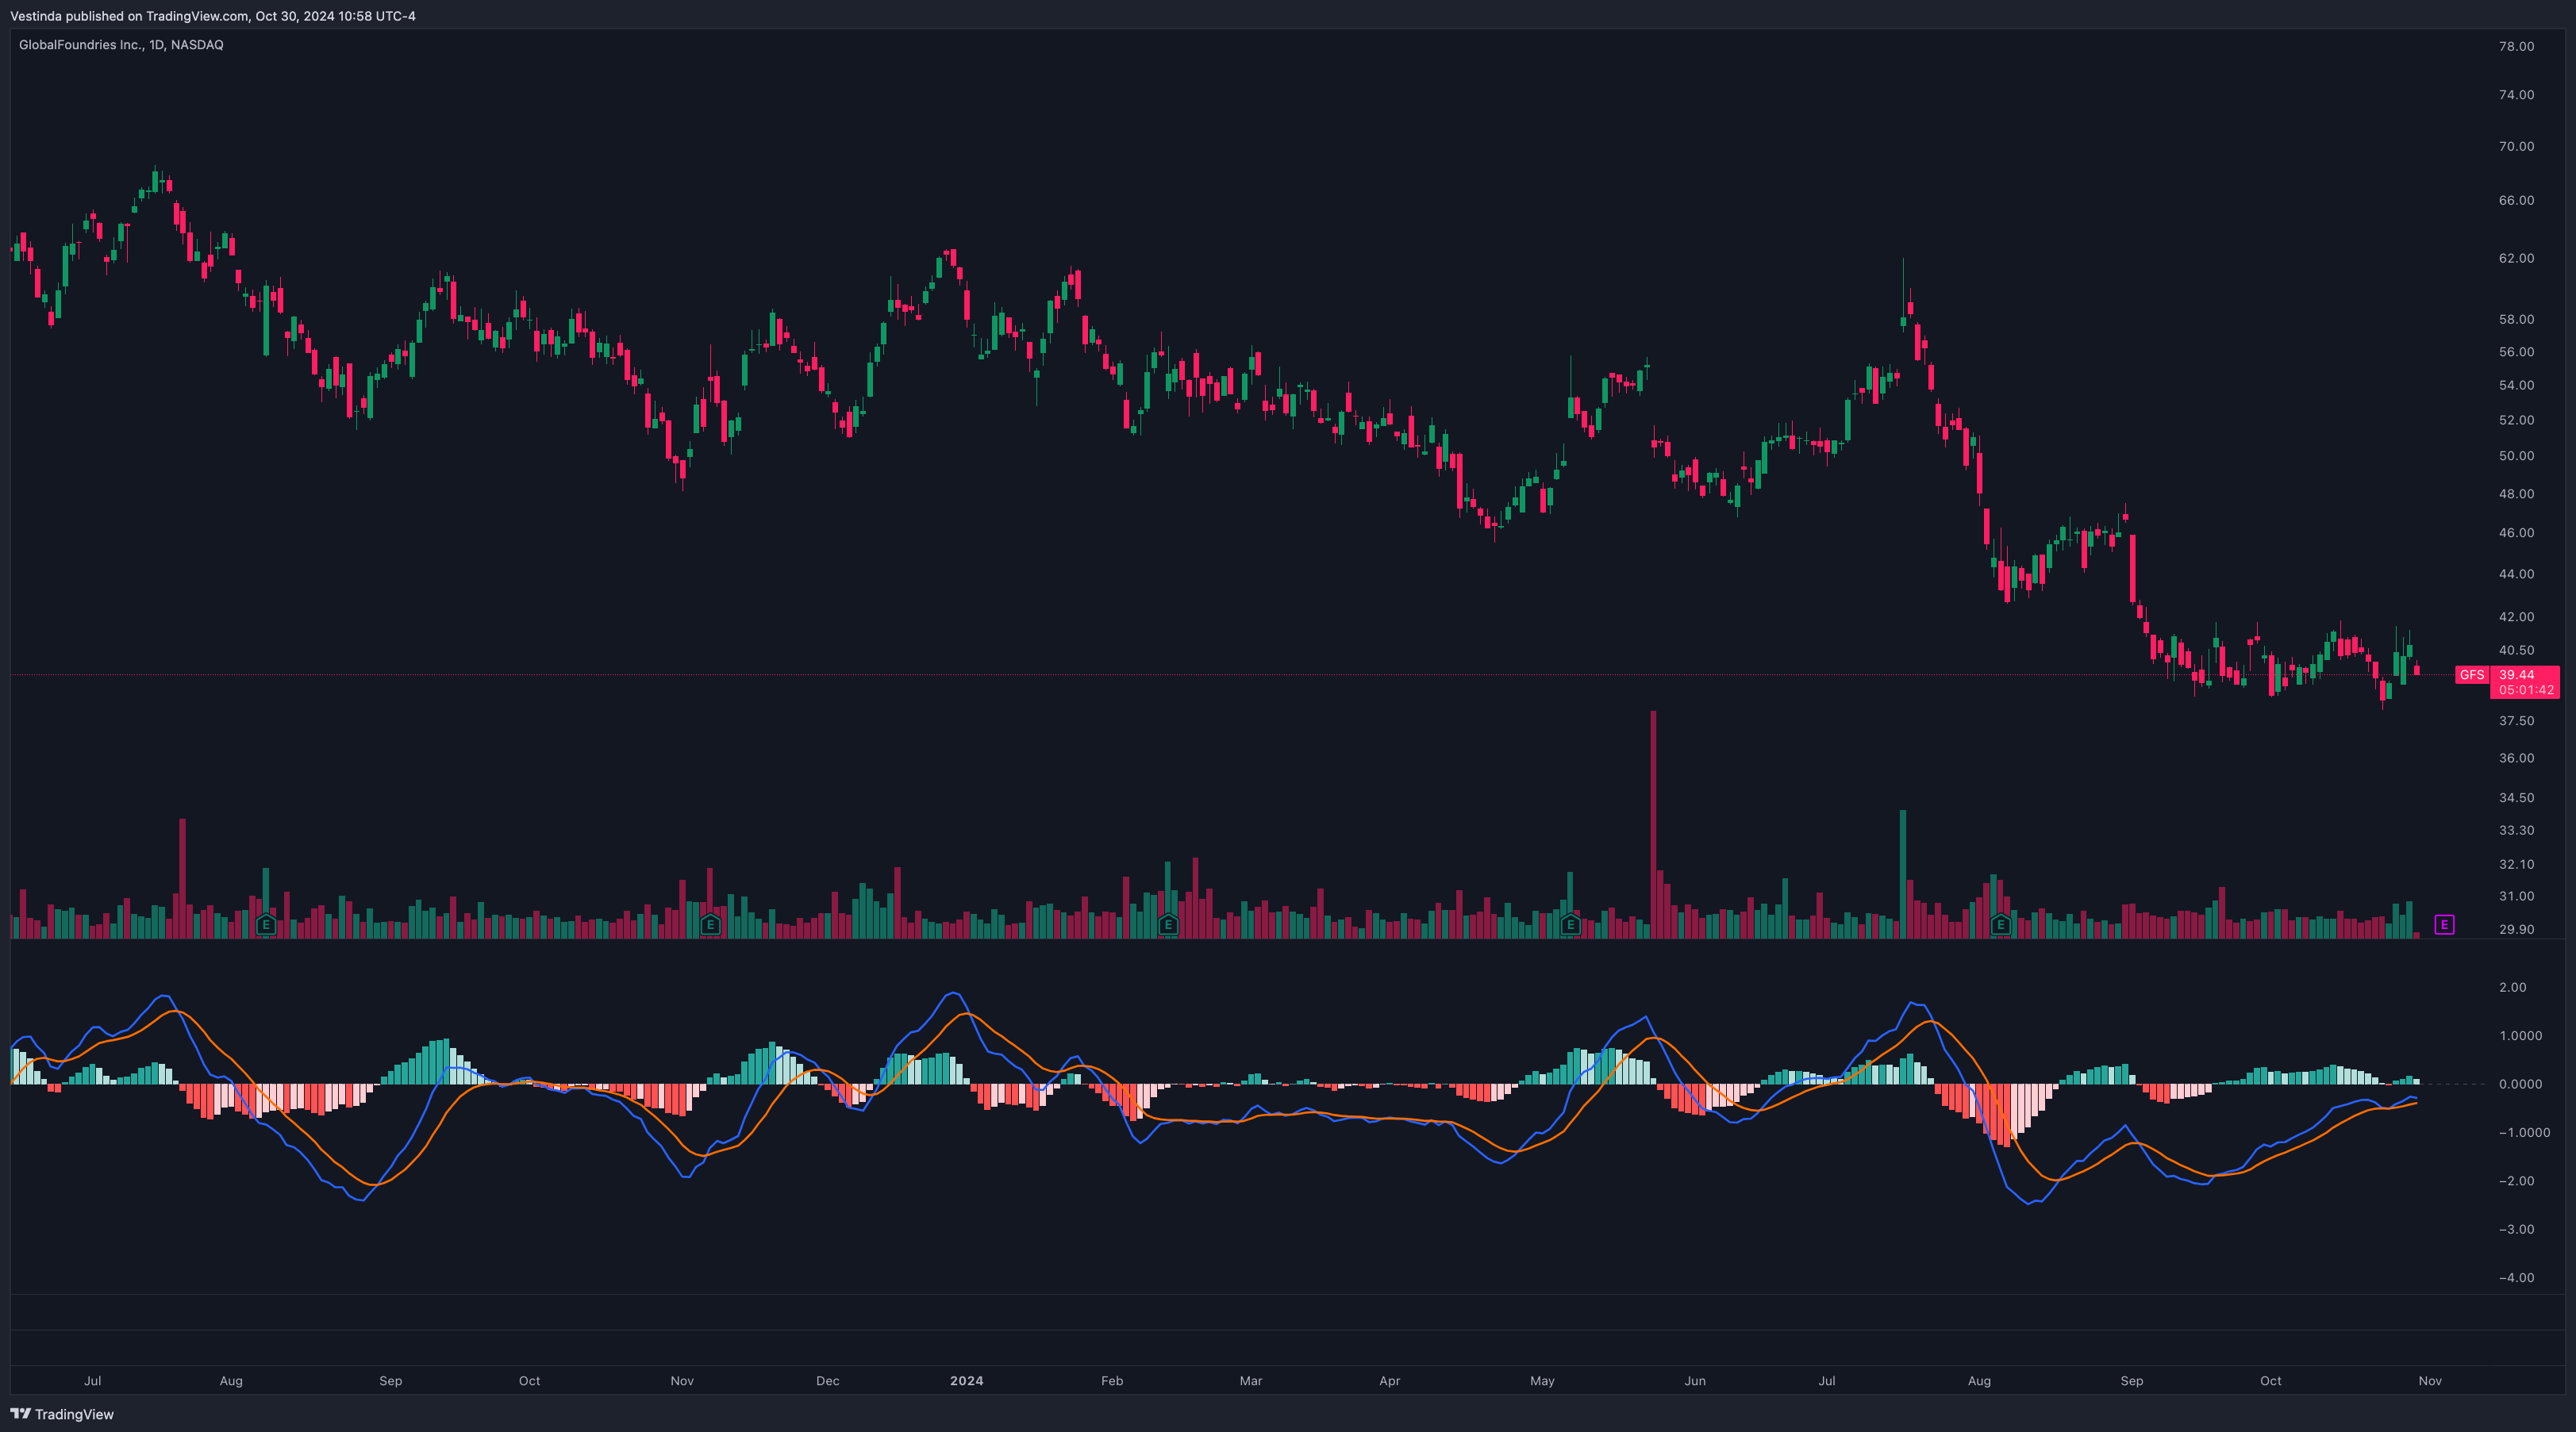
MACD (Moving Average Convergence Divergence) for Momentum Confirmation:
Concept: MACD is a momentum indicator that uses moving averages to identify trend direction and momentum shifts.
Why It Works: MACD provides timely entry and exit signals in trending markets, capturing bullish and bearish momentum shifts in GFS.
How to Implement:
- Indicators: Use MACD with default settings (12, 26, 9).
- Entry and Exit: Automate buys when the MACD line crosses above the signal line and sells when it crosses below.
- Automation Tip: Program the bot to monitor MACD crossovers, ensuring entries and exits align with GFS’s momentum trends.
Combining Indicators for More Reliable GFS Trading Signals:
Bollinger Bands + RSI:
How It Works: Combine Bollinger Bands with RSI to confirm entry points; buy when RSI indicates oversold conditions near the lower band and sell when RSI is overbought near the upper band.
Automation Tip: Set the bot to execute trades only when both Bollinger Bands and RSI signals align, enhancing trade accuracy.
MACD + Moving Averages:
How It Works: Use MACD crossovers to confirm signals from the 20/100 moving average crossover, reducing false signals and improving timing.
Automation Tip: Require both MACD and MA crossovers for entries and exits to maintain consistency across trend shifts.
Risk Management for GFS Trading:
Position Sizing and Allocation:
Concept: Define position sizes based on risk tolerance and portfolio goals, ensuring exposure aligns with overall strategy.
How to Implement: Risk only 1-2% of your portfolio per trade, setting position sizes accordingly to manage risk effectively.
Stop-Loss and Take-Profit Levels:
Concept: Protect capital with stop-loss orders, and lock in gains with take-profit levels based on GFS’s price structure.
How to Implement: Set stop-loss orders slightly below recent support levels and take-profit orders near resistance or previous highs.
Automation Tip: Use trailing stops for trend-following strategies, capturing gains as GFS’s price moves favorably while providing downside protection.
Regular Performance Review and Adjustment:
Concept: Analyze trades periodically to ensure that the strategy performs well under current market conditions.
How to Implement: Review win rate, average profit/loss, and drawdowns monthly to refine strategy parameters and improve performance.
Tip: Adjust indicators if GFS’s volatility changes significantly, testing new settings in a demo environment before applying live.
Backtesting and Optimizing Your GFS Trading Strategy:
Backtest Each Strategy Independently:
Why: Backtesting on historical GFS data helps verify the strategy’s effectiveness, allowing for adjustments based on past performance.
How to Implement: Run each strategy on historical data, focusing on metrics like win rate, drawdowns, and average returns. Adjust parameters based on these insights.
Monitor Live Performance and Adjust Settings:
Why: Live data can differ from historical performance, so ongoing monitoring and adjustments help maintain profitability.
How to Implement: Track live trade performance, comparing it to backtested data, and fine-tune indicator settings as needed.
Conclusion:
GFS trading strategies using moving averages, RSI, Bollinger Bands, and MACD provide a comprehensive framework for capturing opportunities in the semiconductor industry. By automating these strategies, traders can reduce emotional decision-making and execute trades based on reliable data. Incorporate robust risk management and regularly review performance to unlock consistent success with Globalfoundries.
GFS Quant Trading Strategies Simplified
Quant trading, also known as algorithmic trading, utilizes computer programs to execute trades based on predetermined rules and mathematical models. Implementing quant trading in the markets can benefit GFS by automating the decision-making process and increasing the speed of trade execution. By utilizing advanced algorithms and historical data, quant trading strategies can identify profitable trading opportunities and execute trades seamlessly without human intervention. This automation allows for quicker reactions to market trends, resulting in increased efficiency and reduced human error. Moreover, quant trading can help GFS to optimize its trading strategies by backtesting them using historical data, considering factors such as market volatility, liquidity, and risk management. This allows for the development of more sophisticated trading strategies based on statistical analysis. With quant trading, GFS can potentially improve its investment performance and stay ahead in the global markets.
Globalfoundries Overview: Unveiling the GFS Power
GFS, or Globalfoundries, is a leading provider of semiconductor manufacturing services. With a global presence, GFS operates state-of-the-art fabrication facilities in several countries. They offer a wide range of advanced technologies for the production of integrated circuits. GFS serves various industries, including automotive, consumer electronics, and telecommunications. Their expertise lies in manufacturing high-performance chips that power devices we use daily. Through continuous innovation and investments in research and development, GFS has established itself as a trusted partner for semiconductor companies worldwide. Their cutting-edge manufacturing capabilities enable them to deliver innovative solutions that meet the demands of an ever-evolving technology landscape. From mobile devices to autonomous vehicles, GFS plays a crucial role in shaping the future of technology.
GFS Trading: Unleashing Automated Trading Potential
Automated trading strategies for GFS can provide increased efficiency and accuracy in buying and selling GFS stocks. These strategies use algorithms and computer programs to analyze GFS market data and make trades based on predefined rules. Short sentences are ideal for conveying key information succinctly. These algorithms can quickly process large amounts of data and respond to market changes in real-time. By automating the trading process, investors can take advantage of opportunities that may occur within seconds or minutes. Additionally, automated trading strategies can help remove emotional biases from decision-making, ensuring that trades are based solely on data and predefined rules. These strategies can be customized to fit an investor's specific risk tolerance and investment objectives. Overall, automated trading strategies for GFS can provide a competitive edge for investors looking to maximize their returns.
Effective Stop Loss Strategies for GFS Trading
When trading Globalfoundries (GFS), using a stop loss can be beneficial. A stop loss is an order placed to sell a stock when it reaches a certain price. It helps limit potential losses and protects against sudden market downturns. By setting a stop loss, you decide the maximum amount of money you are willing to lose on a trade. If the stock price drops below this level, your shares are automatically sold, preventing further losses. This risk management strategy is crucial for traders to protect their investments. Stop losses give you peace of mind and allow you to focus on other opportunities in the market. Remember to set your stop loss level based on careful analysis and consideration of your risk tolerance.
Sophisticated backtesting is not only possession of high-esteemed hedge funds anymore.
Impressive Team and support, Backtesting engine with detailed reports, The Strategy builder.

Great purchase!
I have always manually invested in stocks and cryptocurrencies, but after studying Vestinda, I must say it has enormous potential.

Mature platform for trading
Pro: Easy to use, Nice UX, A lot of customization for strategies, Back testing is an awesome tool, can check any strategy in history.

Frequently Asked Questions
Leverage trading is a strategy where an investor borrows funds to amplify their buying power and potentially increase their profits. It allows traders to control larger positions in the market using a smaller amount of their own capital. By utilizing leverage, traders can take advantage of market fluctuations and magnify their gains. However, it also carries a higher level of risk as losses are also amplified. It is important to carefully manage risk and have a thorough understanding of leverage before engaging in this type of trading.
The 1% trading strategy refers to a risk management approach in which traders limit their exposure to any single trade to no more than 1% of their overall trading capital. This strategy aims to minimize potential losses by preventing significant drawdowns. By allocating only a small portion of their capital per trade, traders can withstand temporary setbacks and have a higher chance of long-term success. This disciplined approach helps manage risk, preserve capital, and maintain a consistent trading plan.
Quantitative trade refers to the process of using mathematical models, statistical analysis, and automated algorithms to make trading decisions in financial markets. It involves the systematic application of quantitative techniques to analyze market data and identify patterns, correlations, and trading opportunities. Traders who engage in quantitative trade typically rely on historical market data, market indicators, and mathematical models to generate signals for buying or selling assets. These models aim to exploit market inefficiencies and short-term price movements. Quantitative trade has gained popularity due to its potential for enhanced efficiency, reduced human bias, and the ability to process large amounts of data quickly.
The best time to trade GFS (Government Funded Security) generally depends on several factors, including market conditions and investor preferences. However, a key consideration is to trade during times when there is high liquidity and active participation from traders. These periods often coincide with regular market hours, when major financial centers, such as New York and London, are open. Additionally, it is advisable to be aware of major economic events and news releases that can potentially impact GFS prices. Ultimately, it is essential to conduct thorough research and consider individual trading strategies to determine the most opportune time to trade GFS.
Conclusion
In conclusion, implementing effective trading strategies for GFS (Globalfoundries) is essential for maximizing potential gains and navigating the market successfully. Utilizing quant trading, also known as algorithmic trading, can automate the decision-making process and increase trade execution speed. This can lead to increased efficiency, reduced human error, and optimization of trading strategies through statistical analysis. Automated trading strategies can provide increased accuracy and remove emotional biases from decision-making. Additionally, incorporating risk management strategies such as setting stop losses can help protect investments. By applying these strategies and staying informed, traders can make informed decisions and stay ahead in the ever-evolving global market.

Successful traders rely on backtesting to be profitable.
Be like them with our
Free Backtesting Guide