-
100,000 available assets New
-
years of historical data
-
practice without risking money

Automated Strategies & Backtesting results using ATR
Discover below a selection of trading strategies based on the ATR indicator and how they have performed in backtesting. You can test all these strategies (and many more) for free on thousands of assets, using their complete historical data.
Automated Trading Strategy: ATR Breakout Strategy on STMX
Based on backtesting results for a trading strategy conducted from June 11, 2020, to October 21, 2023, several key statistics have been obtained. The strategy exhibited a profit factor of 1.01, indicating a slight margin of profitability. The annualized return on investment (ROI) stood at 3.39%, suggesting consistent growth over the analyzed period. The average holding time for trades was approximately 10 weeks, indicating a relatively long-term approach. With an average of only 0.04 trades per week, the strategy seemed to prioritize quality over quantity. A total of 8 trades were closed during this period, resulting in a return on investment of 11.29%. Notably, winning trades accounted for just 25% of all trades conducted under this strategy.
Choose another period and try again.
Automated Trading Strategy: ATR Breakout Strategy on UNI
During the period from September 17, 2020, to October 21, 2023, the backtesting results for this trading strategy showed promising statistics. The profit factor stood at 1.81, indicating a favorable return on investments. The annualized ROI was an impressive 71.18%, suggesting significant growth over the evaluated period. On average, the holding time for trades was around 7 weeks and 5 days, indicating a medium-term strategy. The average number of trades executed per week was relatively low at 0.03, indicating a careful and selective approach. There were a total of 5 closed trades during this period. The return on investment amounted to 222.45%, while the winning trades percentage stood at 20%. Notably, this strategy outperformed the buy and hold strategy, generating excess returns of 451.08%.
Choose another period and try again.
Understanding the ATR Indicator
The Average True Range (ATR) is a volatility indicator developed by J. Welles Wilder in his 1978 book, "New Concepts in Technical Trading Systems." The ATR measures market volatility by decomposing the entire range of an asset price for a given period. This tool helps traders to understand how much an asset typically moves, providing valuable insights for setting stop-loss levels and identifying potential breakout points.
Theory Behind ATR
The ATR is calculated using the following steps:
True Range (TR):
- Current high minus current low
- Absolute value of current high minus previous close
- Absolute value of current low minus previous close
Average True Range (ATR):
The moving average of the true range over a specified period, typically 14 days.

Where n is the number of periods (usually 14).
Key Uses and Interpretations
- Volatility Measurement: ATR does not provide trend direction but measures the degree of price movement. High ATR values indicate high volatility, while low ATR values indicate low volatility.
- Setting Stop-Loss Levels: Traders often use ATR to set stop-loss orders to account for market volatility, helping to avoid premature stop-outs in volatile markets.
- Identifying Breakouts: ATR can help identify potential breakouts by signaling increased volatility.
Chart Example: Understanding ATR in Action
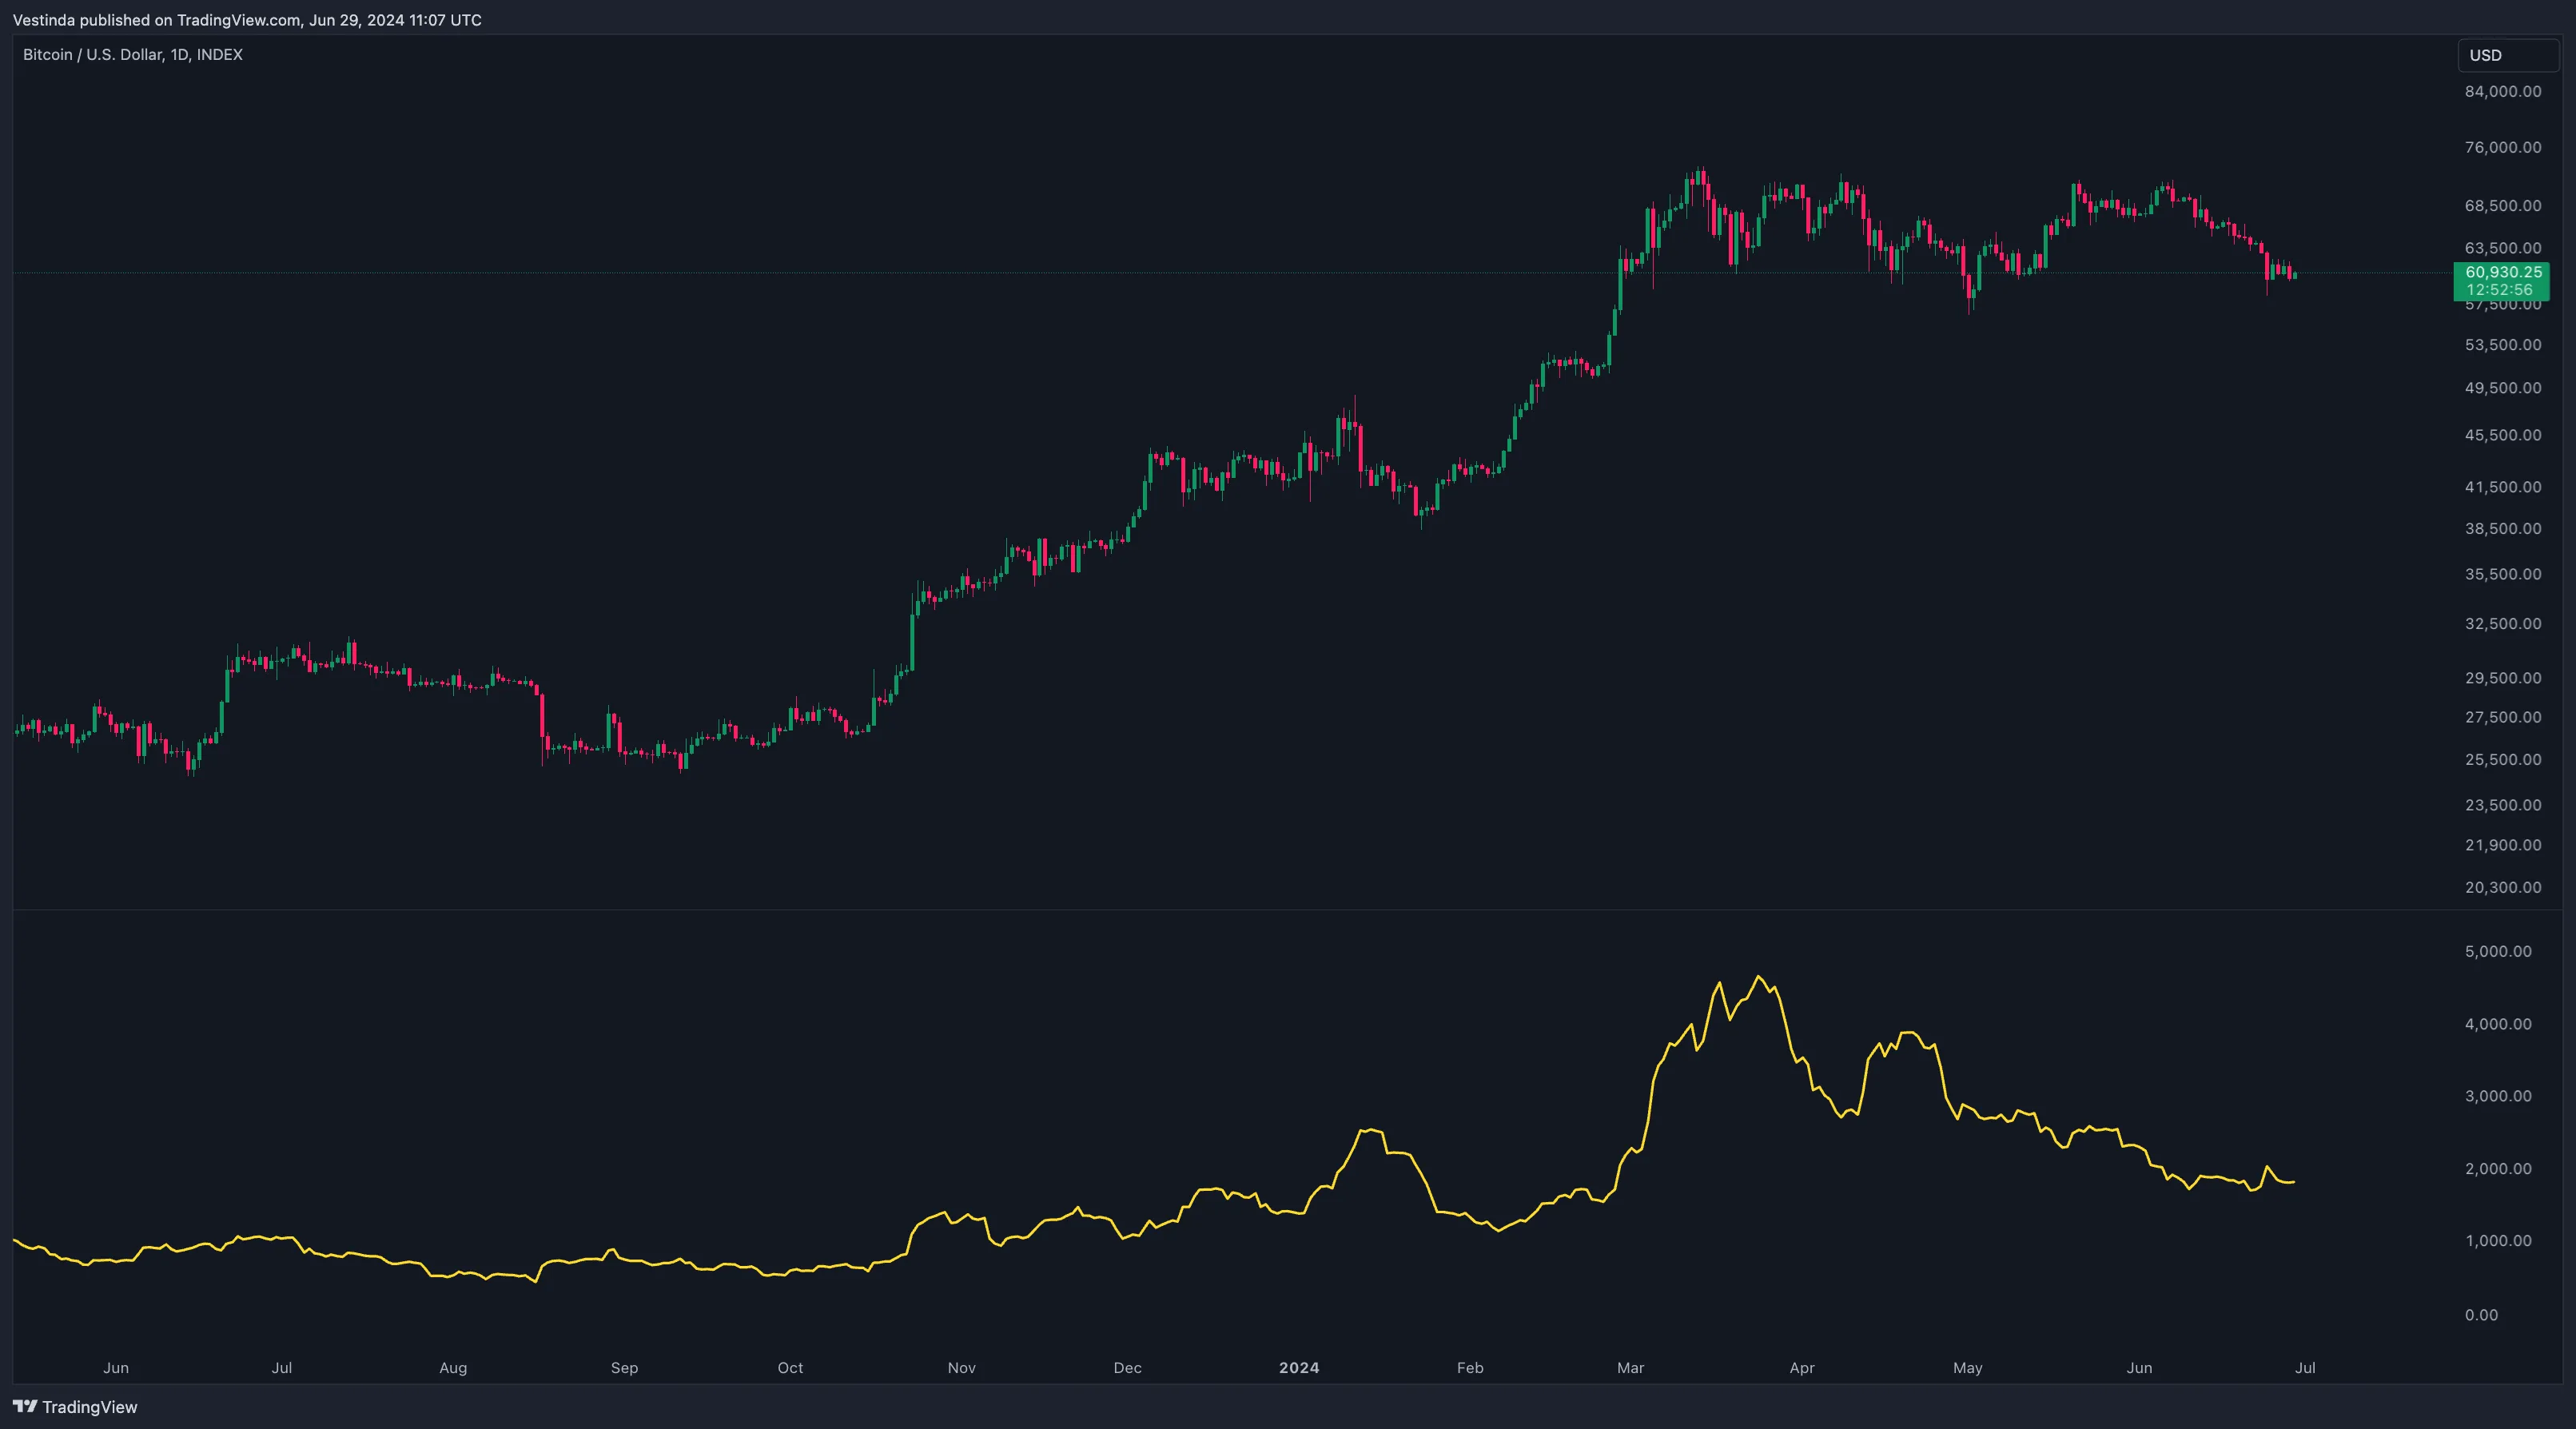
Notice how the ATR line rises during periods of high volatility and falls during periods of low volatility.
ATR Trading Strategies
1. Setting Stop-Loss Based on ATR
The ATR can be used to set a stop-loss level by multiplying the ATR value by a chosen factor and then subtracting it from the entry price (for long positions) or adding it to the entry price (for short positions). This method ensures that the stop-loss level adjusts according to the market’s volatility.
Steps to Set Stop-Loss Using ATR:
- Calculate the ATR: Determine the ATR for your desired period (typically 14 days).
- Determine the Multiple: Choose a multiple of the ATR to set the stop-loss. Common multiples are 1.5x, 2x, or 3x ATR, depending on your risk tolerance and the asset's volatility.
- Set the Stop-Loss Level:
- For long positions: Stop-loss level = Entry price - (ATR * Multiple)
- For short positions: Stop-loss level = Entry price + (ATR * Multiple)
Example Calculation:
Assume the ATR is 1.5, the entry price for a long position is $100, and the chosen multiple is 2.
Stop-loss level = $100 - (1.5 * 2) = $100 - $3 = $97
This means the stop-loss will be set at $97.
2. ATR Breakout Strategy
This strategy uses ATR to identify potential breakouts by monitoring volatility changes. A significant increase in ATR can signal a breakout from a consolidation phase.
Steps:
- Identify a consolidation phase where the price is moving within a narrow range.
- Monitor the ATR for a significant increase, indicating rising volatility.
- Enter a trade in the direction of the breakout when the price moves beyond the consolidation range with increased ATR.
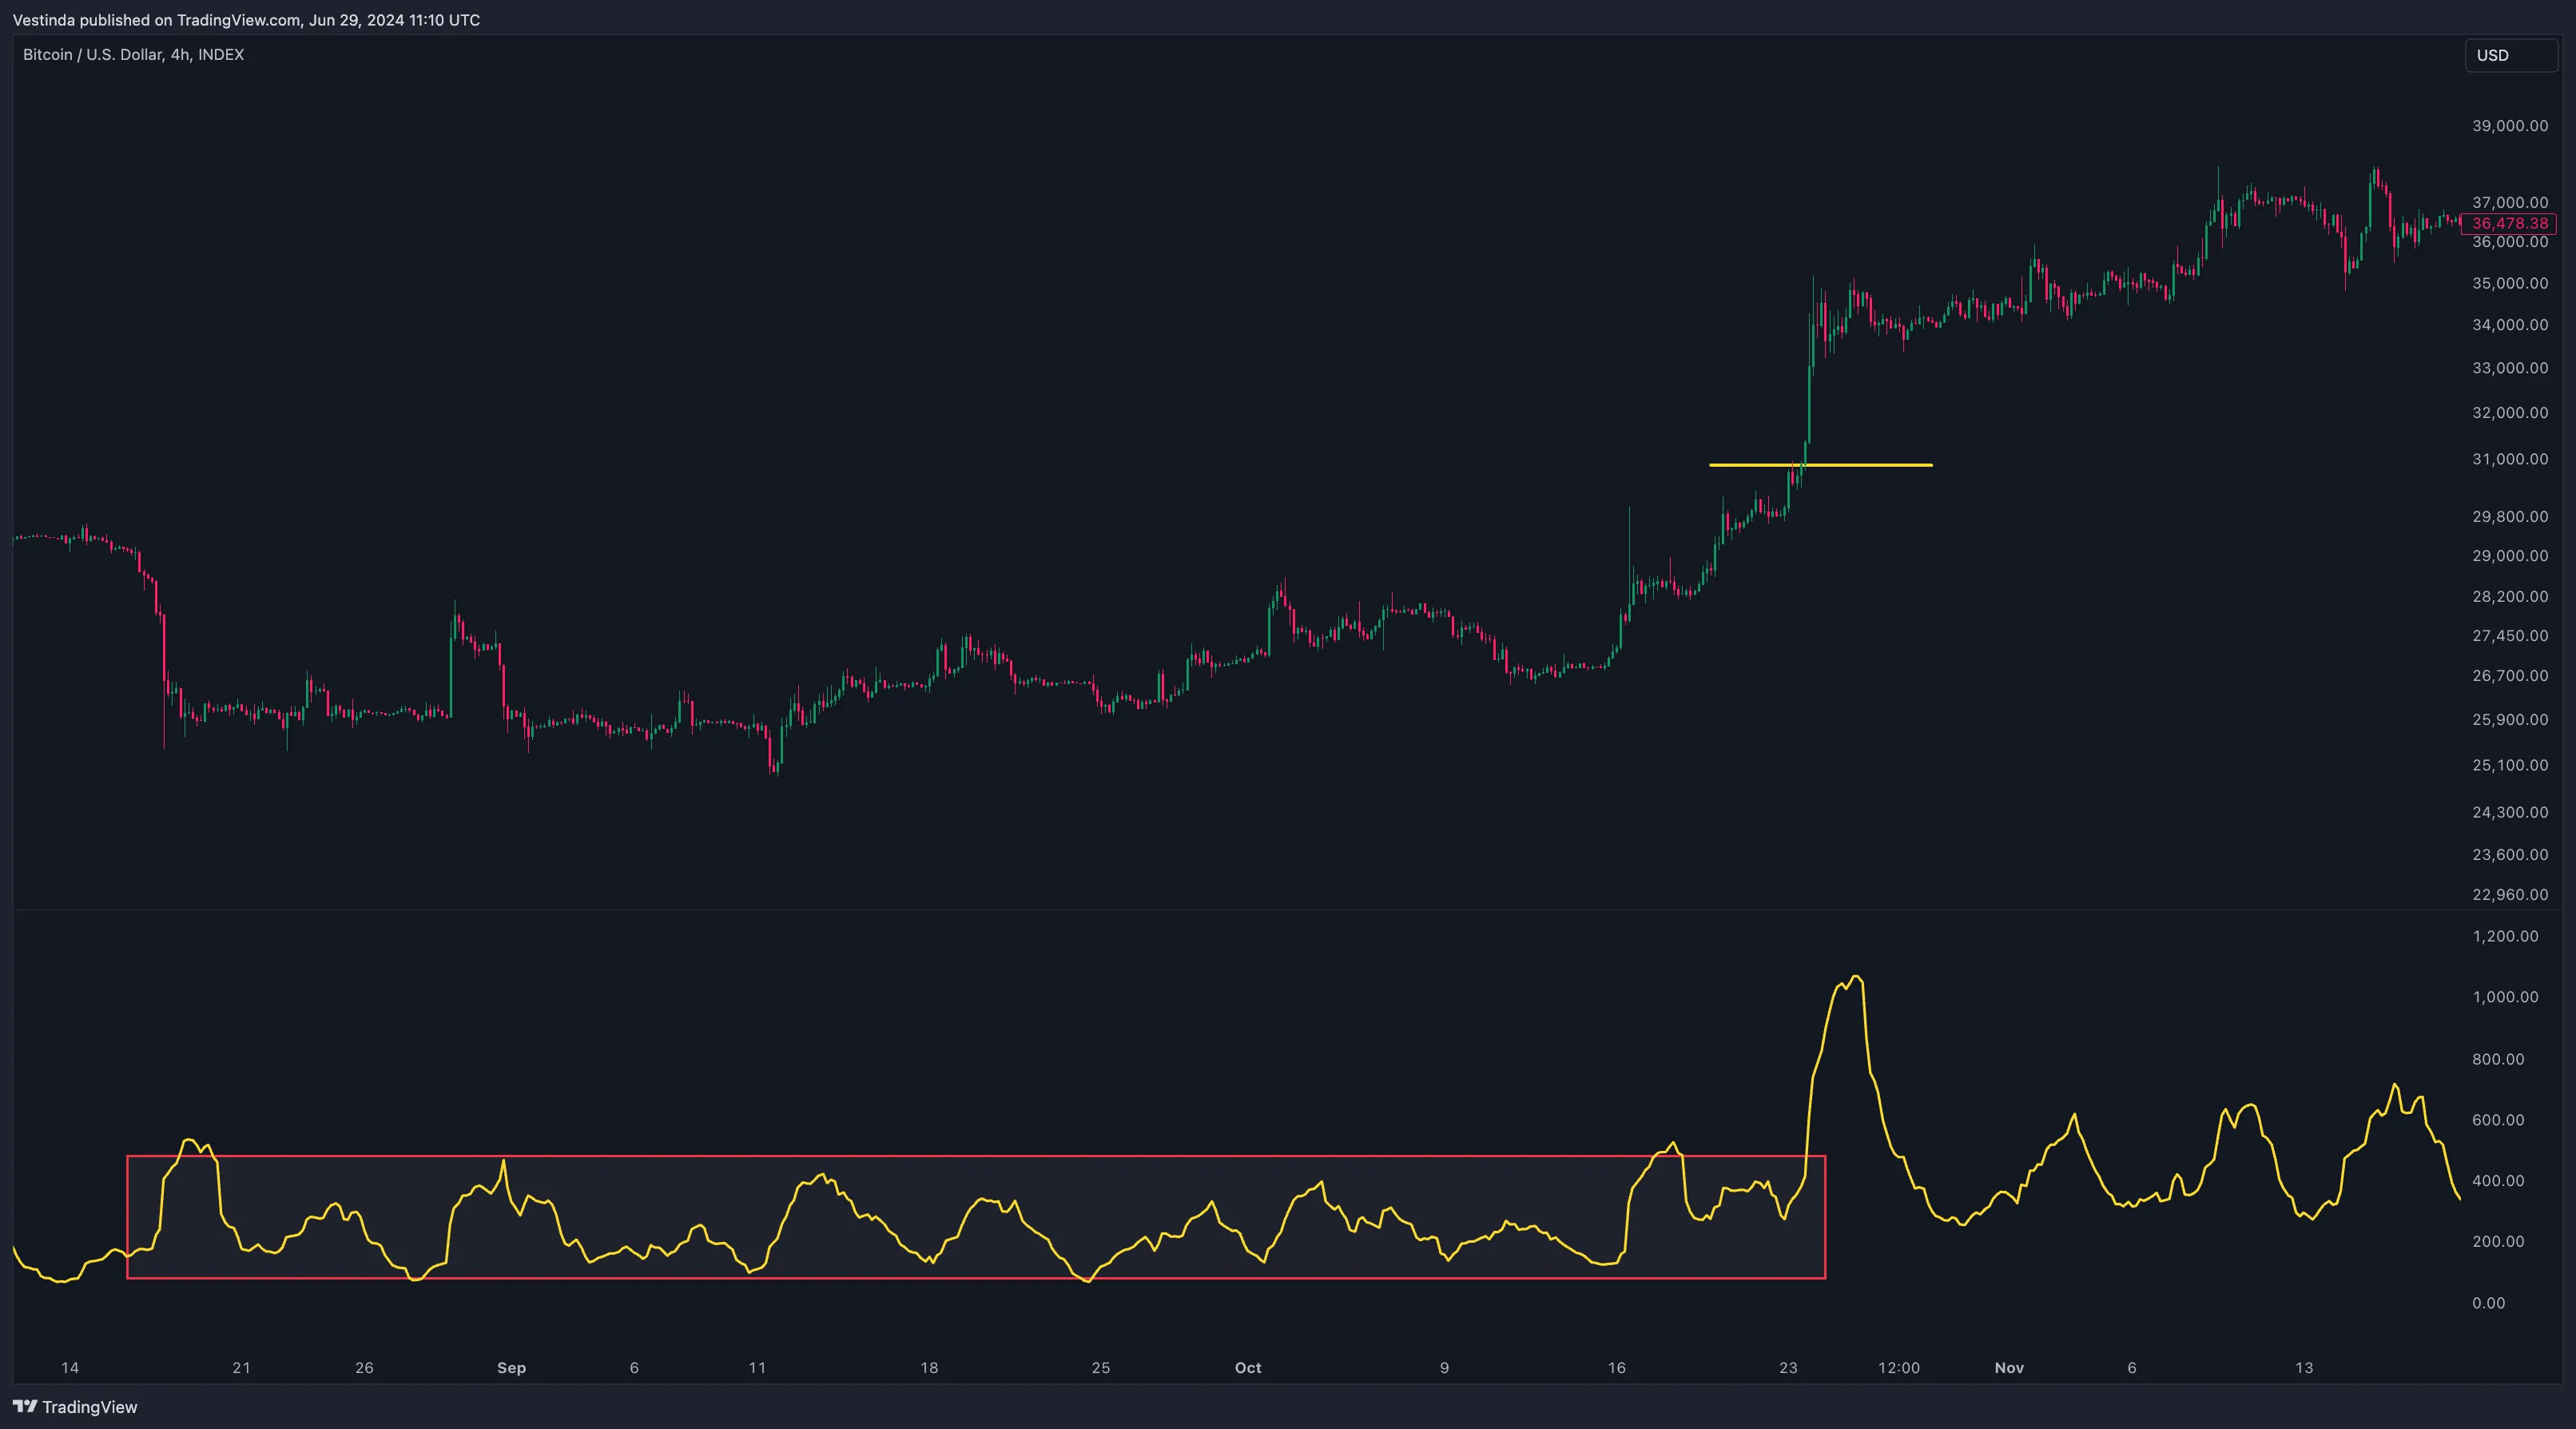
A significant increase in ATR accompanies the breakout from the consolidation range, signaling a trade entry.
Building Profitable Trading Strategies using ATR
- Calculate the ATR value using the formula ATR = (Previous ATR * (n-1) + Current TR) / n, where n is the number of periods.
- Choose a timeframe and determine the desired value for n (number of periods).
- Identify market trends by comparing the ATR value with previous values.
- Utilize ATR to set stop-loss and take-profit levels, based on volatility.
- Combine ATR with other indicators or analysis techniques to validate trading decisions.
Cracking ATR: Unveiling Technical Analysis Basics
It is used in technical analysis to measure market volatility. ATR calculates the average range between each candlestick's high and low over a certain period. This range shows the level of price movement and can help traders determine whether to enter or exit a trade. A higher ATR suggests greater volatility and potential for larger price swings. Conversely, a lower ATR indicates lower volatility and smaller price movements. Traders often use ATR in conjunction with other indicators to confirm signal strength and make more informed trading decisions.
Mastering ATR: Unveiling Profitable Trading Techniques
It measures market volatility by calculating the average range of price movement over a specific period. Traders can use ATR to determine stop loss levels, position sizing, and potential price targets. To use ATR, first set your desired time period (e.g., 14 days) and apply the indicator to your chart. The ATR value will be displayed as a line on your chart, providing insight into the current market volatility. Traders often use a multiple of the ATR value to set their stop loss levels. For example, if the ATR value is 1.5, some traders may set their stop loss 1.5 times the ATR value away from their entry point. A higher ATR value suggests greater market volatility, while a lower value indicates less volatility. Using the ATR indicator can help traders make more informed decisions and manage risk effectively.
Mastering ATR: Amplifying Stock Trading Strategies
It measures the volatility of a stock by calculating the average range between highs and lows over a specified period. ATR is commonly used in stocks trading to set stop-loss levels and determine entry and exit points. Traders can compare ATR values across different stocks to identify the most volatile ones. By incorporating ATR into their strategies, traders can adjust their targets and risk tolerance based on the stock's price action. A higher ATR reading suggests a greater potential for price movement, while a lower ATR indicates less volatility. ATR can help traders manage their emotions by setting realistic expectations and avoiding impulsive decisions. Overall, ATR is a valuable tool in stocks trading for assessing risk and enhancing profitability.
The Edge of ATR: Features & Benefits
It measures market volatility by analyzing price movements. ATR can be used in various trading strategies. It helps determine stop-loss levels and potential profit targets. The indicator can be applied to any financial instrument and time frame. ATR provides valuable information about market conditions. It can help traders identify potential reversals or trend strength. The indicator is easy to interpret and can be added to any trading platform. ATR is a powerful tool for risk management and position sizing. It helps traders make informed decisions based on market volatility. By using ATR, traders can optimize their trading strategies and improve their overall performance.
-
 Create
account -
 Discover profitable
strategies -
 Connect exchange
& start earning
Frequently Asked Questions
Yes, the Average True Range (ATR) can be used alone as a technical indicator. ATR measures market volatility by calculating the average range between high and low prices over a specified period. It helps traders identify market conditions, set stop-loss levels, and determine potential price targets. ATR alone does not provide buy or sell signals but serves as a useful tool for assessing volatility and risk. Traders often combine it with other indicators or trading strategies to make informed decisions.
The best way to use the Average True Range (ATR) is to incorporate it into your trading strategy as a dynamic indicator for measuring volatility. ATR provides insights into price range expansion or contraction, enabling you to determine appropriate stop-loss levels and position sizing. By setting stop-loss orders relative to the ATR value, you can account for market fluctuations and avoid setting stops too tight or too loose. Additionally, monitoring changes in ATR can signal shifts in market conditions and help identify potential breakout or trend reversal opportunities. Successful usage of ATR lies in its ability to provide a quantitative measure of volatility and assist in risk management.
The best average true range (ATR) settings for a 5-minute chart depend on the specific trading strategy and market conditions. Generally, a shorter ATR period, such as 7 or 10, is ideal for short-term timeframes to capture intraday volatility. However, it's important to adjust and optimize these settings based on individual preferences, technical analysis indicators, and historical price action. Traders should experiment with different ATR periods and observe their impact on their chosen strategy to determine the most effective ATR settings for their 5-minute chart analysis.
ATR, or Automatic Target Recognition, has proven to be a highly successful technology in numerous fields. With its ability to quickly and accurately identify and classify targets in various imaging data, ATR has greatly enhanced the efficiency and effectiveness of tasks such as surveillance, object detection, and medical imaging analysis. Its applications range from military operations and security systems to healthcare and industrial automation. The continuous advancements in machine learning algorithms and computer vision techniques further contribute to ATR's success, enabling it to handle complex and real-time scenarios. Overall, ATR has become an indispensable tool offering significant advantages in target identification and recognition.
ATR (Average True Range) is a technical indicator widely used in algorithmic trading to measure market volatility. It provides traders with insights into the potential movement range of an asset within a given time period. By calculating the average range between the high and low prices, ATR assists in determining suitable stop-loss levels, position sizing, and overall risk management. A higher ATR suggests greater volatility, while a lower ATR indicates a more stable market. Algorithmic trading systems can utilize ATR to dynamically adjust trading strategies based on changing market conditions, optimizing trade entries and exits.
Conclusion
In conclusion, ATR indicator trading strategies are valuable tools for traders to analyze market volatility and make informed trading decisions. By using the ATR indicator, traders can manage risk effectively and set appropriate stop-loss and take-profit levels. ATR strategies can be used in various trading styles, including algorithmic and quant trading. Furthermore, combining the ATR indicator with other technical analysis tools can provide additional validation for trading decisions. Overall, ATR indicator trading strategies are essential for traders looking to optimize their trading strategies and improve their overall performance.

Successful traders rely on backtesting to be profitable.
Be like them with our
Free Backtesting Guide