Sophisticated backtesting is not only possession of high-esteemed hedge funds anymore.
Impressive Team and support, Backtesting engine with detailed reports, The Strategy builder.

Great purchase!
I have always manually invested in stocks and cryptocurrencies, but after studying Vestinda, I must say it has enormous potential.

Mature platform for trading
Pro: Easy to use, Nice UX, A lot of customization for strategies, Back testing is an awesome tool, can check any strategy in history.

Automated Strategies & Backtesting results using Simple Linear Regression
Discover below a selection of trading strategies based on the Simple Linear Regression indicator and how they have performed in backtesting. You can test all these strategies (and many more) for free on thousands of assets, using their complete historical data.
Automated Trading Strategy: MACD and SLR Reversals on YFI
The backtesting results for the trading strategy conducted from August 10, 2020, to October 21, 2023, showcase promising outcomes. The strategy exhibited a profit factor of 1.07, indicating a positive return on investment. The annualized ROI stood at an impressive 17.36%. On average, the holdings were maintained for approximately 4 days and 5 hours, while the average number of trades executed per week was 0.51. Throughout the testing period, a total of 86 trades were closed. With a winning trades percentage of 33.72%, the strategy outperformed the buy-and-hold approach, generating excess returns of 76.75%. Overall, these statistics suggest the potential effectiveness and profitability of the trading strategy.

 YFIUSDT

Choose another period and try again.
Automated Trading Strategy: Simple Linear Regression Trend Following with Mean Deviation and SL on BOND
Based on the backtesting results for the trading strategy from July 2, 2021, to October 21, 2023, the statistics reveal promising outcomes. The strategy exhibited a profit factor of 1.16, indicating that for every dollar invested, a profit of $1.16 was generated. The annualized ROI stood at an impressive 16.01%, showcasing the strategy's ability to deliver consistent returns over time. The average holding time for trades was approximately 1 week and 3 days, indicating a relatively short-term approach. With an average of 0.21 trades per week, the strategy displayed a calculated and selective approach to executing trades. Out of a total of 26 closed trades, the winning trades percentage stood at 38.46%, demonstrating a discerning selection process. Remarkably, the strategy outperformed the buy-and-hold approach, generating excess returns of 1032.97%, indicating its superiority in delivering substantial profits. Overall, these backtesting results suggest a successful trading strategy with a significant potential for generating consistent and impressive returns for investors.

 BONDUSDT
Choose another period and try again.
Building Trading Strategies: Simple Linear Regression Guide
Introduction
Linear regression is a powerful statistical tool that helps traders identify trends, calculate price projections, and spot potential reversals. By applying linear regression in a trading strategy, traders can create a data-driven approach to predict price movement based on historical patterns. This guide provides a step-by-step explanation of using simple linear regression in trading, along with examples of how to implement it for optimal results.
What is Simple Linear Regression in Trading?
- Definition: Linear regression is a statistical method that models the relationship between a dependent variable (price) and an independent variable (time), producing a line that best fits the historical data.
- Purpose: In trading, linear regression helps identify the underlying trend and provides potential buy/sell signals based on deviations from the line.
- Key Benefit: Linear regression smooths out price data, making it easier to spot trends and reversals and providing a foundation for entry and exit decisions.
Applying Linear Regression in Trading Strategies:
1. Using the Linear Regression Line for Trend Detection:
Concept: The linear regression line highlights the average price direction, helping to distinguish between bullish and bearish trends.
Why It Works: The line provides a clear visual of price trends, allowing traders to align trades with the direction of the trend.
How to Implement:
- Indicators: Apply the Linear Regression (LinReg) indicator to your price chart, setting the period to capture the desired timeframe.
- Entry and Exit: Buy when the price is below the regression line in an uptrend and sell when the price is above it in a downtrend.
- Example Chart: Include a chart with the linear regression line highlighting trend direction, showing potential entry and exit points.
2. Mean Reversion Strategy Using Linear Regression Channels:
Concept: This strategy assumes that prices will revert to the mean after deviating from the linear regression line.
Why It Works: By capturing prices that deviate from the trend, traders can identify overbought and oversold conditions, positioning for reversals.
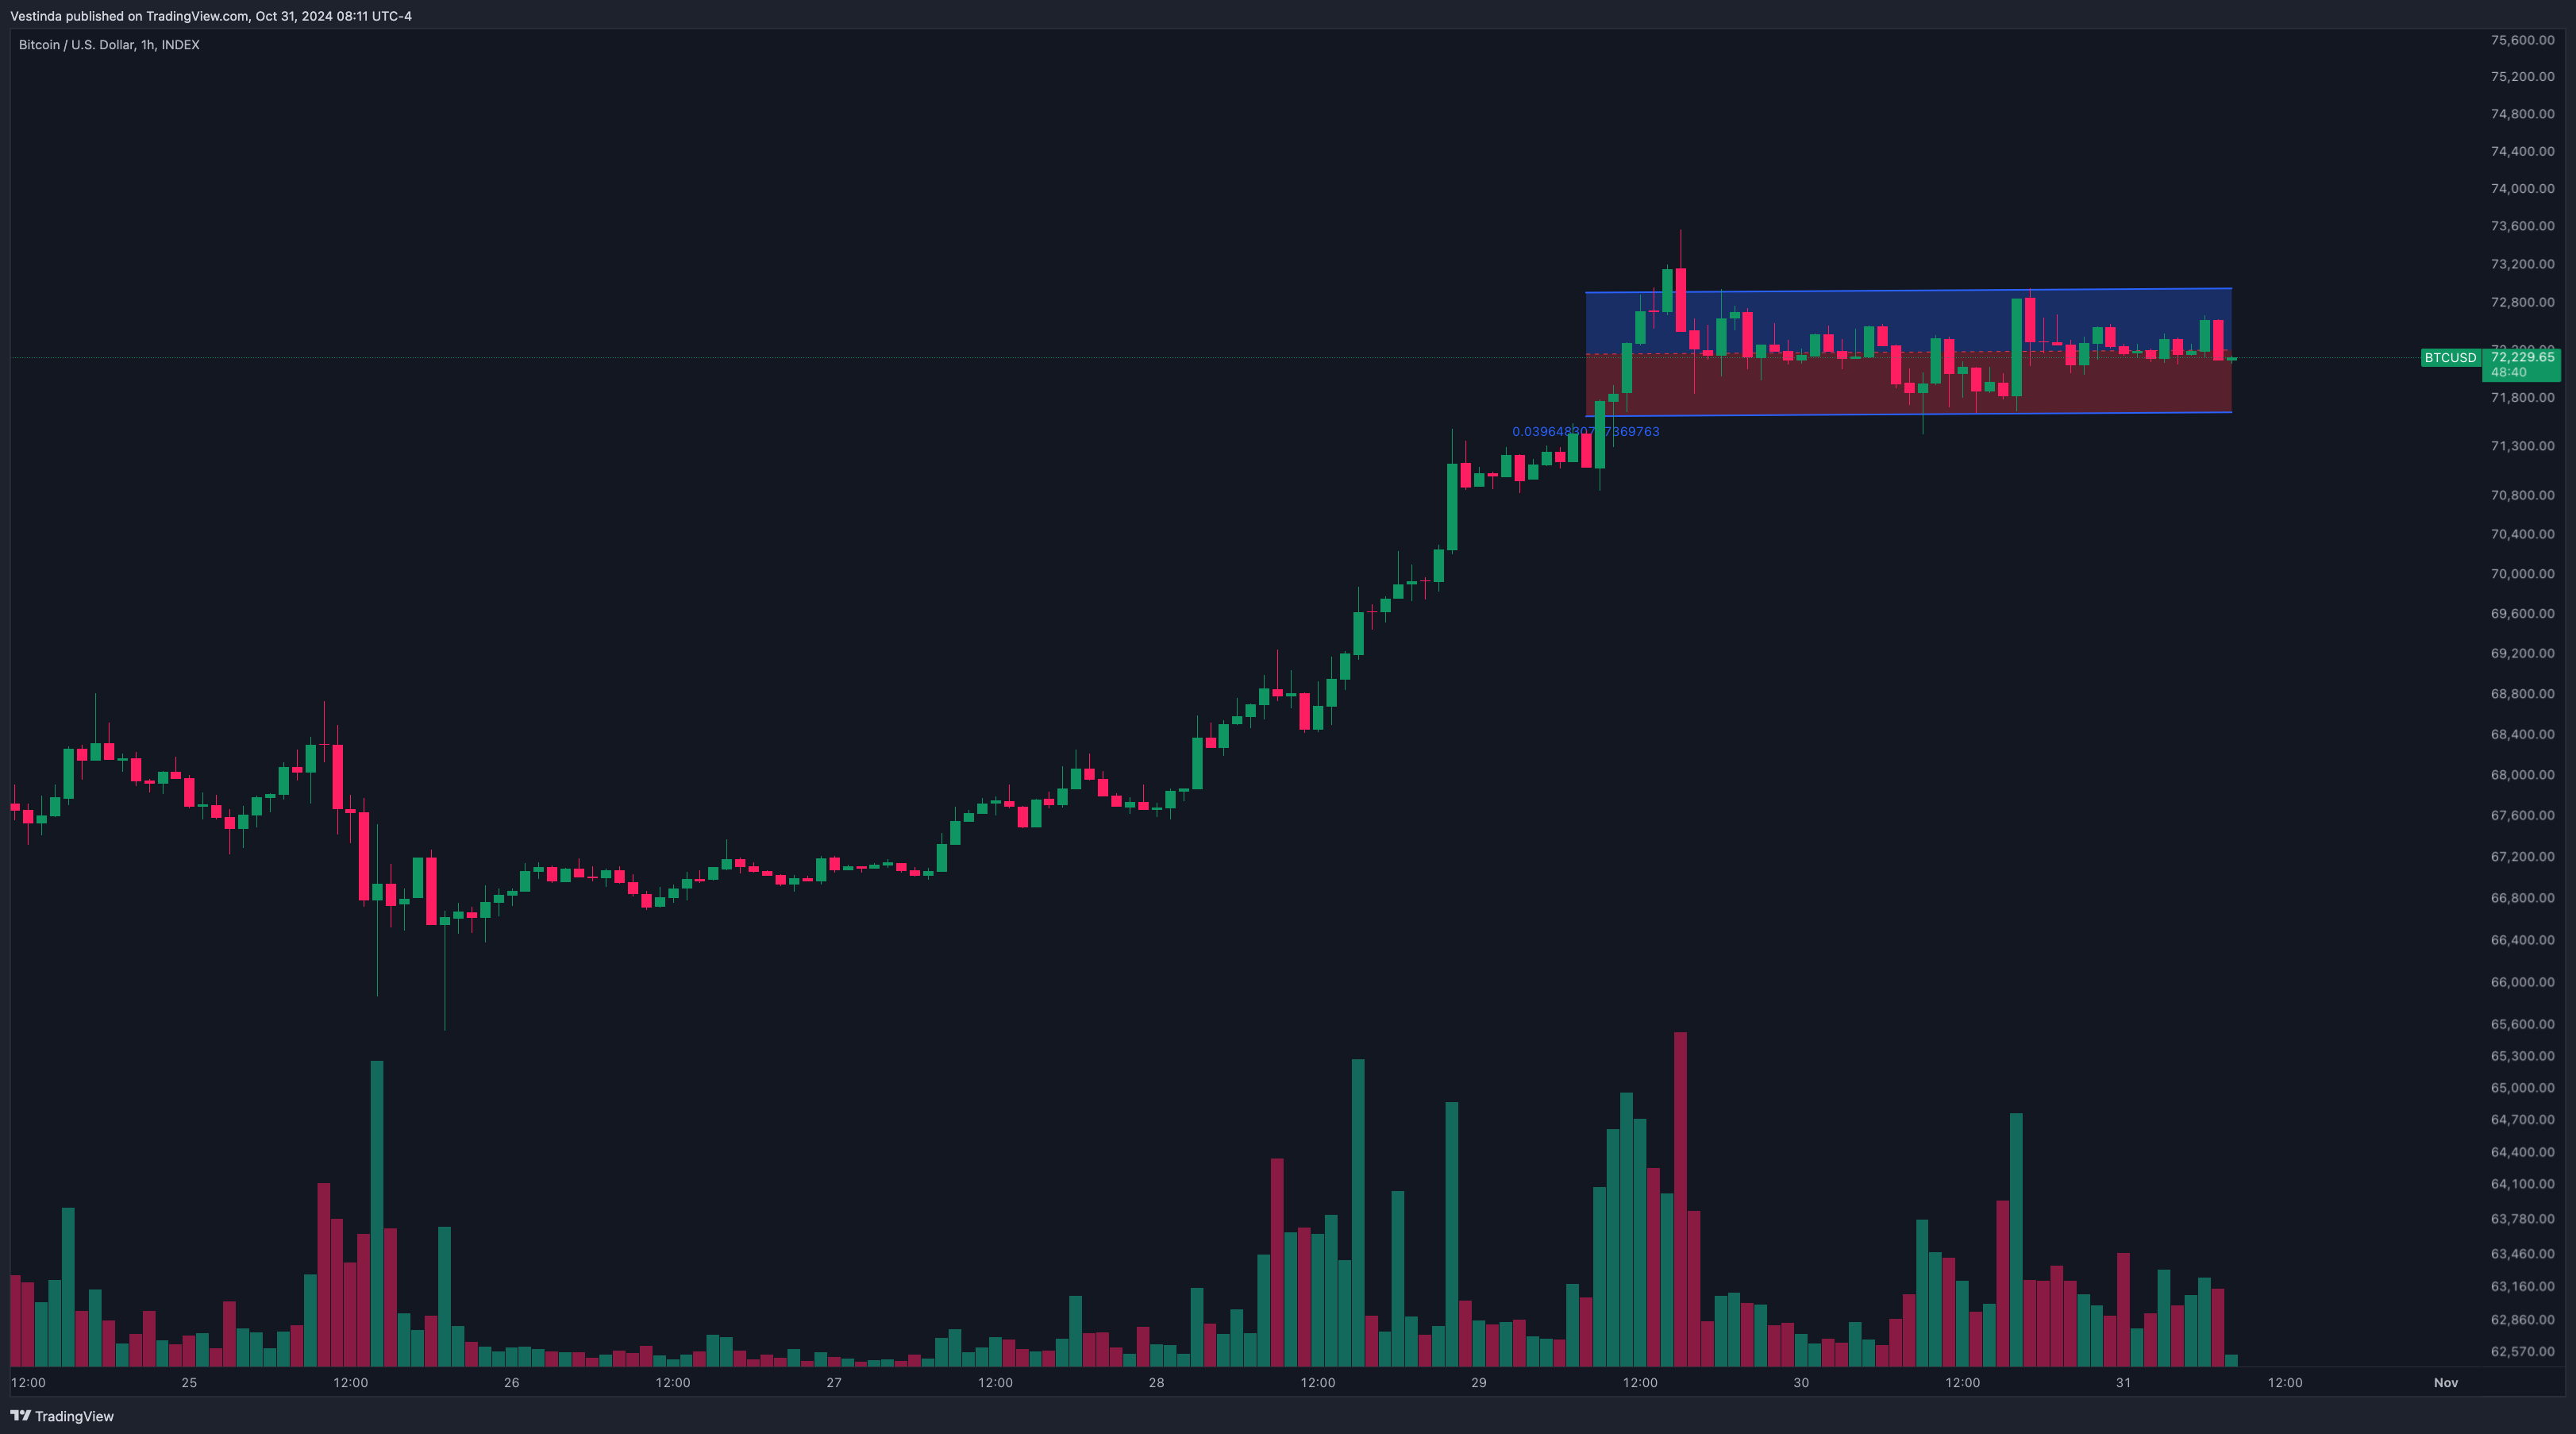
How to Implement:
- Indicators: Set up linear regression channels above and below the line, creating a price range that reflects potential support and resistance.
- Entry and Exit: Buy when the price touches or falls below the lower channel, and sell when it rises to or above the upper channel.
- Example Chart: Use a chart showing price interactions with the linear regression channels, indicating buy and sell zones for mean reversion.
3. Slope of the Regression Line for Momentum Analysis:
Concept: The slope of the linear regression line measures the trend’s momentum, with a steeper slope indicating stronger price movement.
Why It Works: Monitoring the slope helps traders identify shifts in trend strength, allowing them to enter or exit as momentum changes.
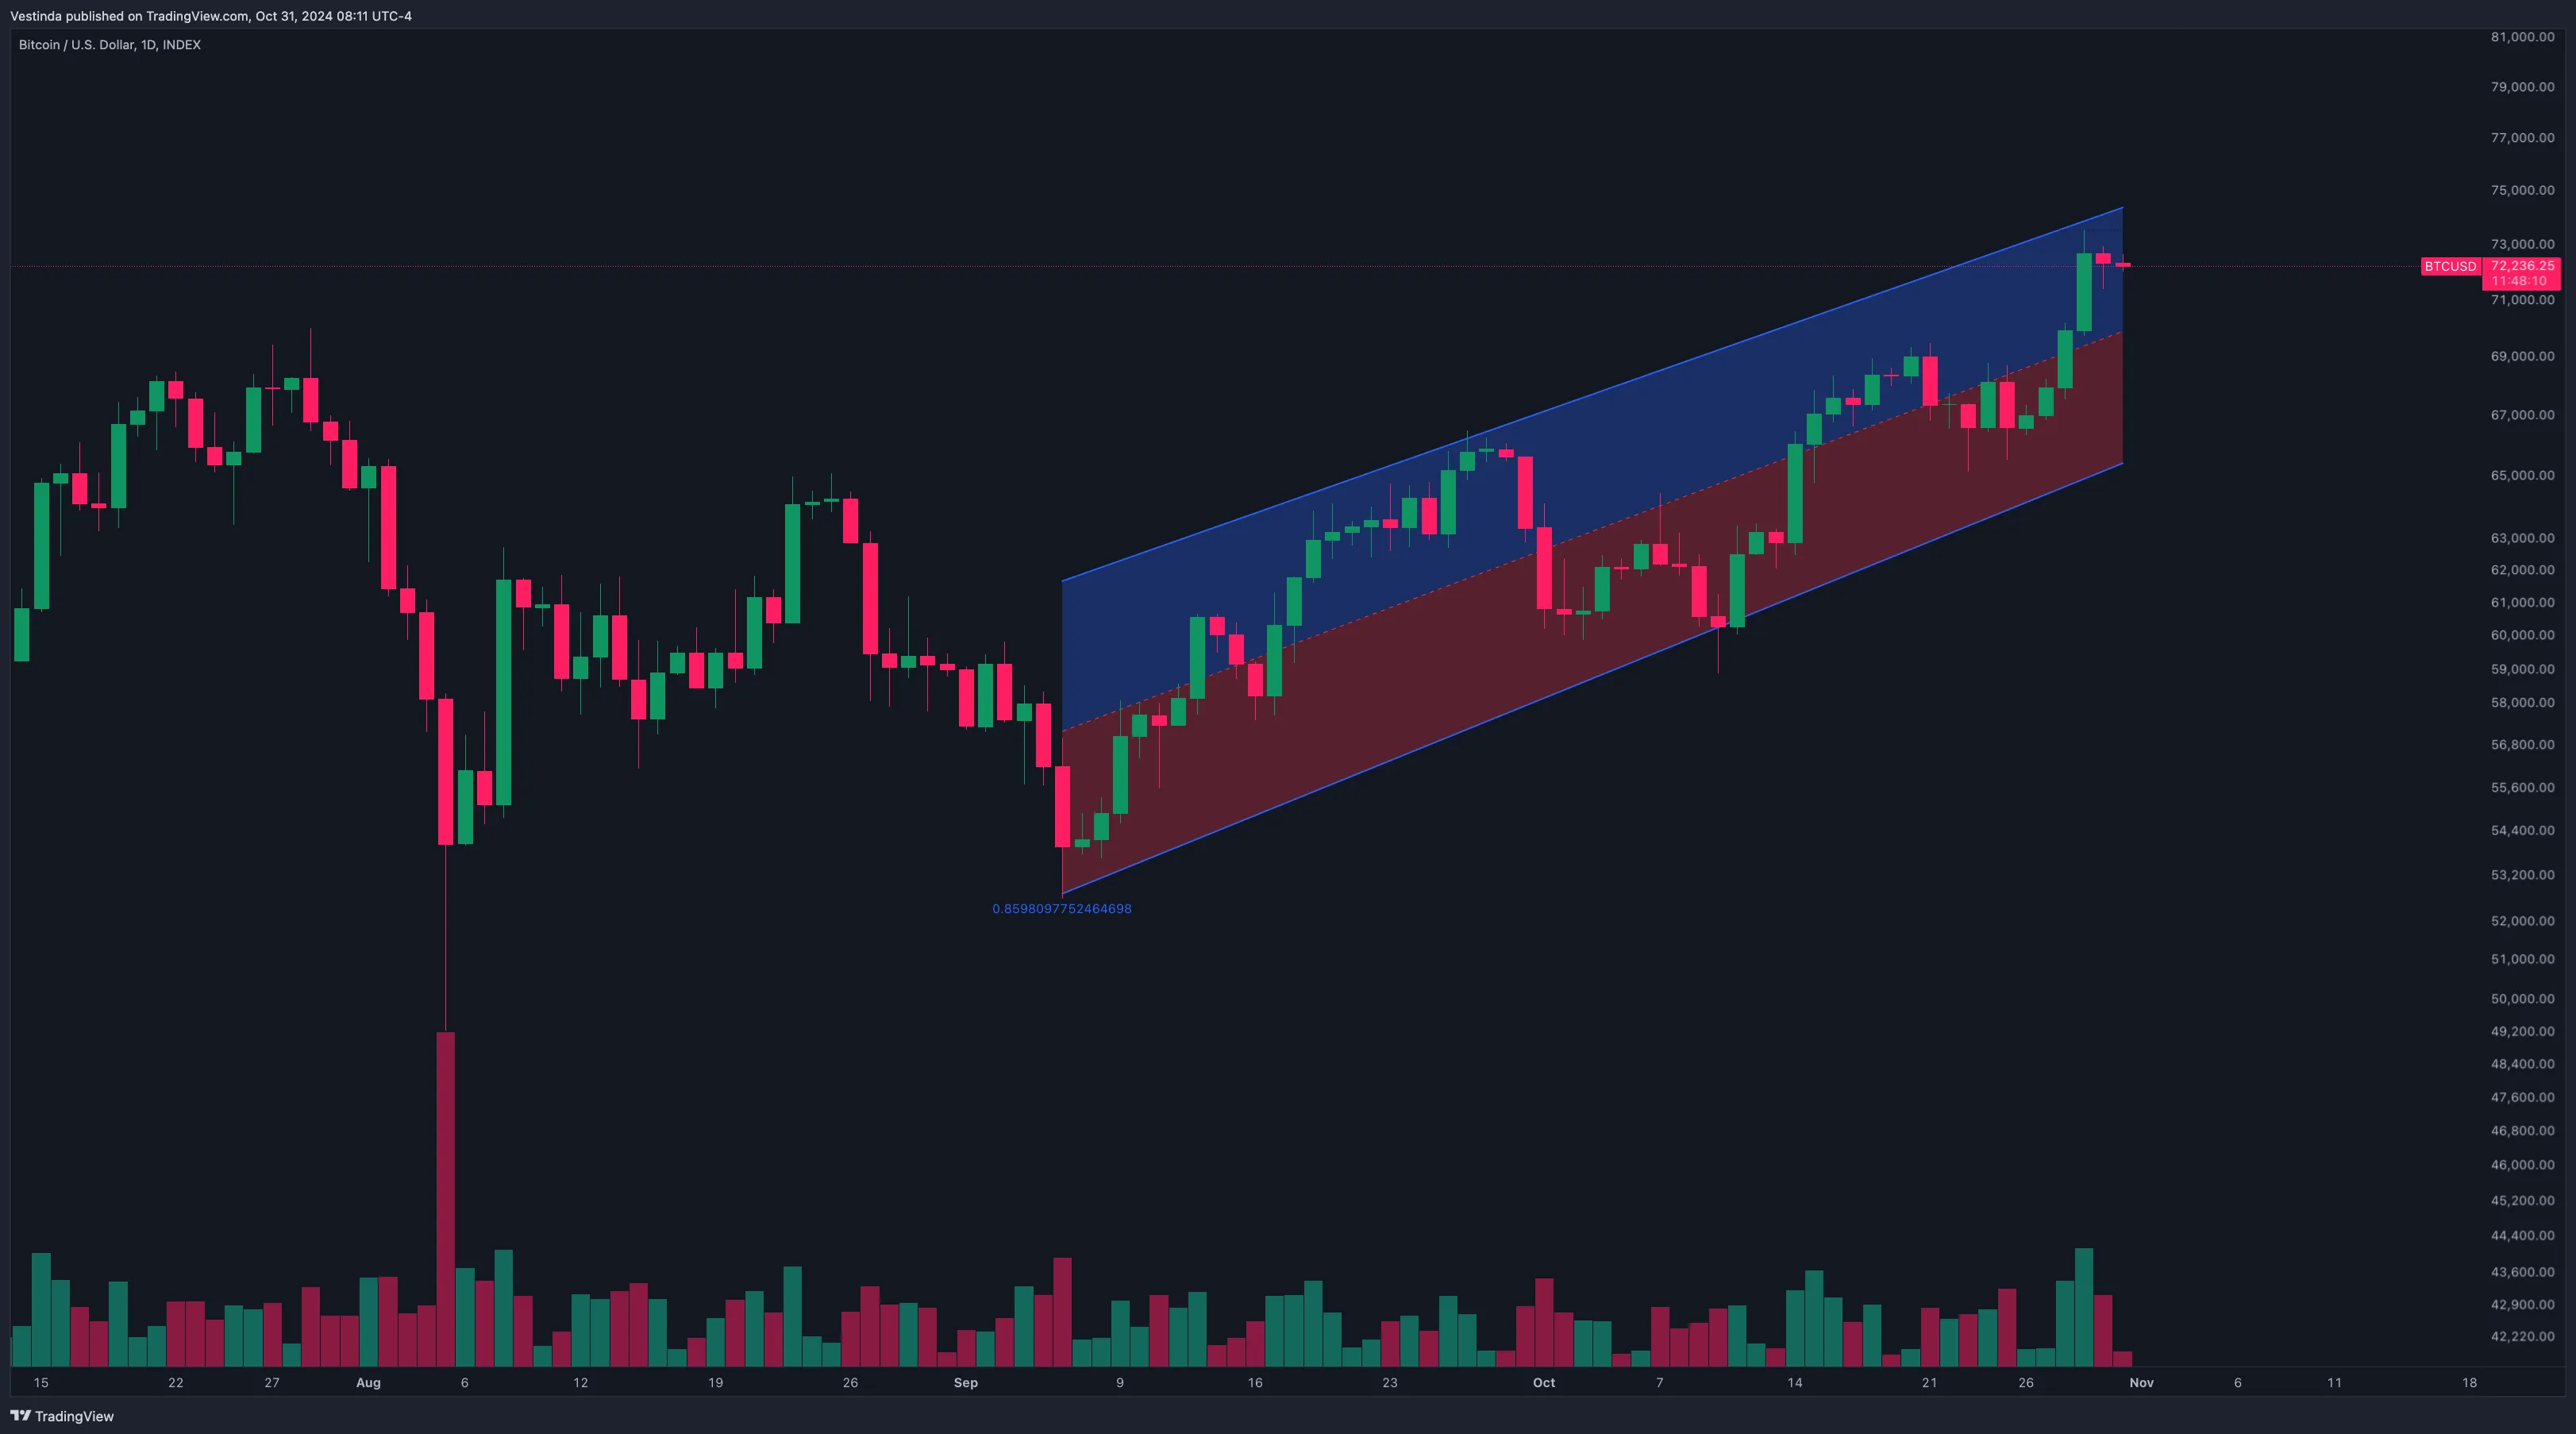
How to Implement:
- Indicators: Apply a slope indicator or monitor the angle of the linear regression line to assess momentum.
- Entry and Exit: Buy when the slope increases (uptrend strengthening) and consider selling or closing positions when the slope flattens or turns negative.
- Example Chart: Include a chart with a visual representation of the slope changes, highlighting how momentum shifts impact entry and exit decisions.
Combining Linear Regression with Other Indicators for Stronger Signals:
1. Linear Regression + RSI for Overbought/Oversold Conditions:
How It Works: Combine linear regression with RSI to confirm overbought/oversold conditions, improving timing for entries and exits.
Example: Buy when the price is near or below the lower linear regression channel and RSI is below 30; sell when the price is near or above the upper channel and RSI is above 70.

Chart Example: Display a chart with linear regression channels and RSI indicators, showing how alignment between these indicators strengthens trade signals.
2. Linear Regression + Moving Averages for Trend Reversals:
How It Works: Use moving averages to confirm trend reversals identified by the regression line, increasing trade accuracy.
Example: Enter long positions when the price breaks above both the linear regression line and a shorter-term moving average, signaling an upward trend reversal.
Chart Example: Show a chart with linear regression, moving averages, and breakouts above/below these lines, indicating potential reversal trades.
Risk Management with Linear Regression Trading Strategies:
1. Position Sizing:
Concept: Set position sizes based on your risk tolerance, adjusting to manage exposure relative to the trade’s distance from the regression line.
How to Implement: Limit risk on each trade to 1-2% of your portfolio, adjusting position sizes according to volatility near the linear regression channel.
2. Stop-Loss and Take-Profit Levels:
Concept: Use stop-loss and take-profit orders to protect against sudden market reversals and lock in profits as targets are met.
How to Implement: Place stop-loss orders slightly outside the linear regression channel to avoid premature exits, and take-profit orders at the opposing channel boundary.
Example: A chart showing entry points with stop-loss and take-profit levels based on channel boundaries, highlighting potential risk-reward scenarios.
3. Regular Monitoring and Adjustment:
Concept: Periodically adjust linear regression settings and other indicators based on market changes, refining strategy parameters for improved results.
How to Implement: Monitor win rates, drawdowns, and return metrics monthly, adjusting settings as needed to align with market conditions.
Backtesting Your Linear Regression Trading Strategy:
1. Testing Over Historical Data:
Why: Backtesting on historical data helps ensure the strategy’s effectiveness across different market conditions.
How to Implement: Run backtests using linear regression channels and indicators like RSI or moving averages, reviewing metrics like win rate and drawdown to optimize settings.
2. Optimizing Based on Live Performance:
Why: Fine-tuning in a live environment allows you to adapt the strategy to recent market dynamics.
How to Implement: Adjust linear regression periods or thresholds based on live trade performance, ensuring your strategy remains adaptable.
Conclusion:
Using simple linear regression in trading provides a structured way to identify trends, manage entries and exits, and capture reversals. By integrating linear regression with additional indicators and sound risk management practices, traders can create strategies that align with market trends and improve consistency. Backtesting and regular adjustments ensure the strategy remains effective, supporting data-driven decisions in live trading.
Building Trading Strategies: Simple Linear Regression Guide
- Collect historical data for the desired asset or market.
- Plot the data points on a scatter plot to visually identify any linear relationship.
- Calculate the slope and intercept of the best-fit line using linear regression analysis.
- Use the calculated linear equation to predict future price movements.
- Validate the accuracy of the predictions by comparing them with actual future prices.
Simplifying Trading Analysis: Linear Regression Advantages
It is commonly used in technical analysis to assess the relationship between two variables. The simplicity of the indicator allows traders to easily understand and interpret the results. This helps in making informed trading decisions. Additionally, the indicator provides a clear visualization of the trend and helps identify potential entry and exit points. The linear regression line acts as a guide, providing a reference for price movements. Traders can use the indicator to predict future price levels and possible reversals. Moreover, the simple linear regression indicator is versatile and can be applied to various markets and timeframes. Overall, its advantages lie in its simplicity, clarity, and predictive abilities, making it a valuable tool for traders.
Mastering the Simple Regression Trading Indicator
It is commonly used to analyze and forecast price movements in the stock market. By utilizing the principle of regression analysis, this indicator helps traders identify trends and make informed decisions. To use the Simple Linear Regression indicator, start by selecting a timeframe and a suitable stock or financial instrument. Plot the indicator on a chart and observe the slope and direction of the trendline. If the trendline is sloping upwards, it suggests a bullish market and potential buying opportunities. Conversely, a downward sloping trendline indicates a bearish market and possible selling opportunities. Traders can also use this indicator to establish support and resistance levels, as well as to determine the strength of a trend. Overall, the Simple Linear Regression indicator is a valuable tool in a trader's arsenal for analyzing market trends and making profitable trades.
Unveiling the Power of Linear Regression Indicators
It is used to analyze the relationship between two variables: the dependent variable and the independent variable. The indicator calculates the slope and intercept of the regression line, allowing traders to predict future price movements based on historical data. By fitting a line to the scatter plot of the data points, the indicator indicates the direction and strength of the relationship between the variables. Traders use this information to identify potential trading opportunities and make more informed decisions. The indicator is simple to use, offering a straightforward way to understand the relationship between variables in a linear fashion. However, it is important to note that the Simple Linear Regression indicator assumes a linear relationship, and in reality, market conditions may exhibit non-linear behavior. Therefore, it is essential to consider other factors and indicators before basing trading decisions solely on this indicator's predictions.
Utilizing Simple Linear Regression in Quantitative Trading
It can be used in quantitative trading to analyze the relationship between two variables. By fitting a line to the data points, it helps identify trends and predict future prices. The slope of the line indicates the direction and strength of the relationship, while the intercept represents the base value. Traders can use this information to make informed trading decisions. For example, if the slope is positive, it suggests that as one variable increases, so does the other. Traders can then use this information to determine when to buy or sell a particular asset. Simple Linear Regression provides quantitative traders with a valuable tool for predicting market behavior and optimizing their trading strategies.
-
Track your
Crypto Portfolio -
Copy Crypto trading
strategies -
Build trading strategies
with no code
-
Backtest trading strategies
on Crypto, Forex, Stocks, etc. -
Demo Trading
Risk-free Paper Trading -
Automate trading strategies
with Live Trading
Frequently Asked Questions
Simple linear regression can be used for forex trading, but its effectiveness depends on various factors. It can provide insights into the relationship between two variables, such as exchange rates and economic indicators. However, forex markets are highly complex and influenced by numerous factors, making it challenging for a simple linear regression model to capture all relevant variables accurately. Traders often rely on more advanced techniques, such as time series analysis and machine learning, to account for the dynamic nature of the forex market and improve forecasting accuracy.
Yes, day traders can use Simple Linear Regression as a tool to analyze market trends and make informed trading decisions. By plotting historical price data, they can identify the relationship between an asset's price and time, allowing them to predict future price movements. Linear Regression helps day traders understand the direction, strength, and potential reversals of trends, enabling them to pursue profitable trading opportunities. However, it is important for day traders to consider other factors and indicators alongside Simple Linear Regression to avoid making decisions solely based on this method.
Yes, professional traders do use Simple Linear Regression in their trading strategies. Simple Linear Regression is a statistical technique that helps traders analyze and predict the relationship between two variables. Traders use this tool to identify trends, determine support and resistance levels, and forecast future price movements. By fitting a linear line to historical data, traders can make informed decisions based on the calculated slope and intercept. However, it is important to note that Simple Linear Regression is just one of many tools used by professional traders, and they often combine it with other indicators and techniques for a comprehensive analysis.
Yes, technical indicators can be useful tools for analyzing and predicting market trends in forex trading. Technical indicators are mathematical calculations based on historical price data that help traders identify patterns, trends, and potential entry or exit points. However, it's important to note that technical indicators should not be relied upon solely for making trading decisions. They should be used in conjunction with other forms of analysis, such as fundamental analysis and market sentiment, to enhance trading strategies and improve overall accuracy.
Conclusion
In conclusion, Simple Linear Regression is a versatile trading indicator that is widely used in technical analysis and algorithmic trading. It helps traders identify and exploit potential linear relationships in price movements, making it a valuable tool for predicting market behavior and optimizing trading strategies. By collecting and analyzing historical data, traders can utilize the slope and intercept of the best-fit line to determine entry and exit points for trades. This indicator is simple to understand and interpret, making it accessible for both experienced quant traders and those new to trading. Incorporating Simple Linear Regression into your trading strategy can greatly enhance your chances of success by providing valuable insights and helping manage risk effectively.

Successful traders rely on backtesting to be profitable.
Be like them with our
Free Backtesting Guide