Sophisticated backtesting is not only possession of high-esteemed hedge funds anymore.
Impressive Team and support, Backtesting engine with detailed reports, The Strategy builder.

Great purchase!
I have always manually invested in stocks and cryptocurrencies, but after studying Vestinda, I must say it has enormous potential.

Mature platform for trading
Pro: Easy to use, Nice UX, A lot of customization for strategies, Back testing is an awesome tool, can check any strategy in history.

Algorithmic Strategies & Backtesting results using Standard Deviation
Discover below a selection of trading strategies based on the Standard Deviation indicator and how they have performed in backtesting. You can test all these strategies (and many more) for free on thousands of assets, using their complete historical data.
Algorithmic Trading Strategy: WMA Crossovers with Volume support on ALCX
Based on the backtesting results of a trading strategy from October 16, 2022, to October 16, 2023, several key statistics have emerged. The profit factor stands at 0.76, indicating a lower return compared to the invested capital. The annualized return on investment (ROI) is calculated at -23.81%, suggesting a substantial loss over the specified period. The average holding time for trades is 7 hours and 36 minutes, indicating a relatively short-term approach. With an average of 2.45 trades per week and a total of 128 closed trades, it suggests a cautious and selective trading approach. The winning trades percentage stands at 26.56%, highlighting the strategy's limitations in generating profitable trades. However, it is noteworthy that the strategy outperforms the traditional buy and hold method, delivering additional returns of 21.64%. Overall, this backtesting analysis suggests a need for further refinement and evaluation to enhance profitability.

 ALCXUSDT

Choose another period and try again.
Algorithmic Trading Strategy: WMA Crossovers with Volume support on AUD
Based on the backtesting results for the trading strategy conducted between October 17, 2022, and October 17, 2023, several key statistics emerged. The profit factor was recorded at 0.2, indicating that the strategy's overall profitability was relatively low. The annualized return on investment (ROI) stood at -19.68%, suggesting a negative rate of return over the testing period. On average, each trade held for approximately 4 hours and 11 minutes, indicating a relatively short-term trading approach. The strategy generated an average of 1.63 trades per week, showcasing a modest trading frequency. A total of 85 trades were closed during the testing period, with a mere 12.94% of them being profitable. Overall, the strategy exhibited below-average performance, resulting in a negative ROI.
 AUDUSDT
Choose another period and try again.
Standard Deviation Indicator Trading Strategies: Mastering Volatility for Better Trading Decisions
Introduction
The Standard Deviation indicator is a powerful tool that helps traders understand market volatility by measuring the dispersion of prices from their average. It provides insights into the degree of price fluctuations, making it an essential component in risk management and strategy development. In this article, we'll explore effective trading strategies using the Standard Deviation indicator, helping you to better anticipate market movements and make informed trading decisions.
What is the Standard Deviation Indicator?
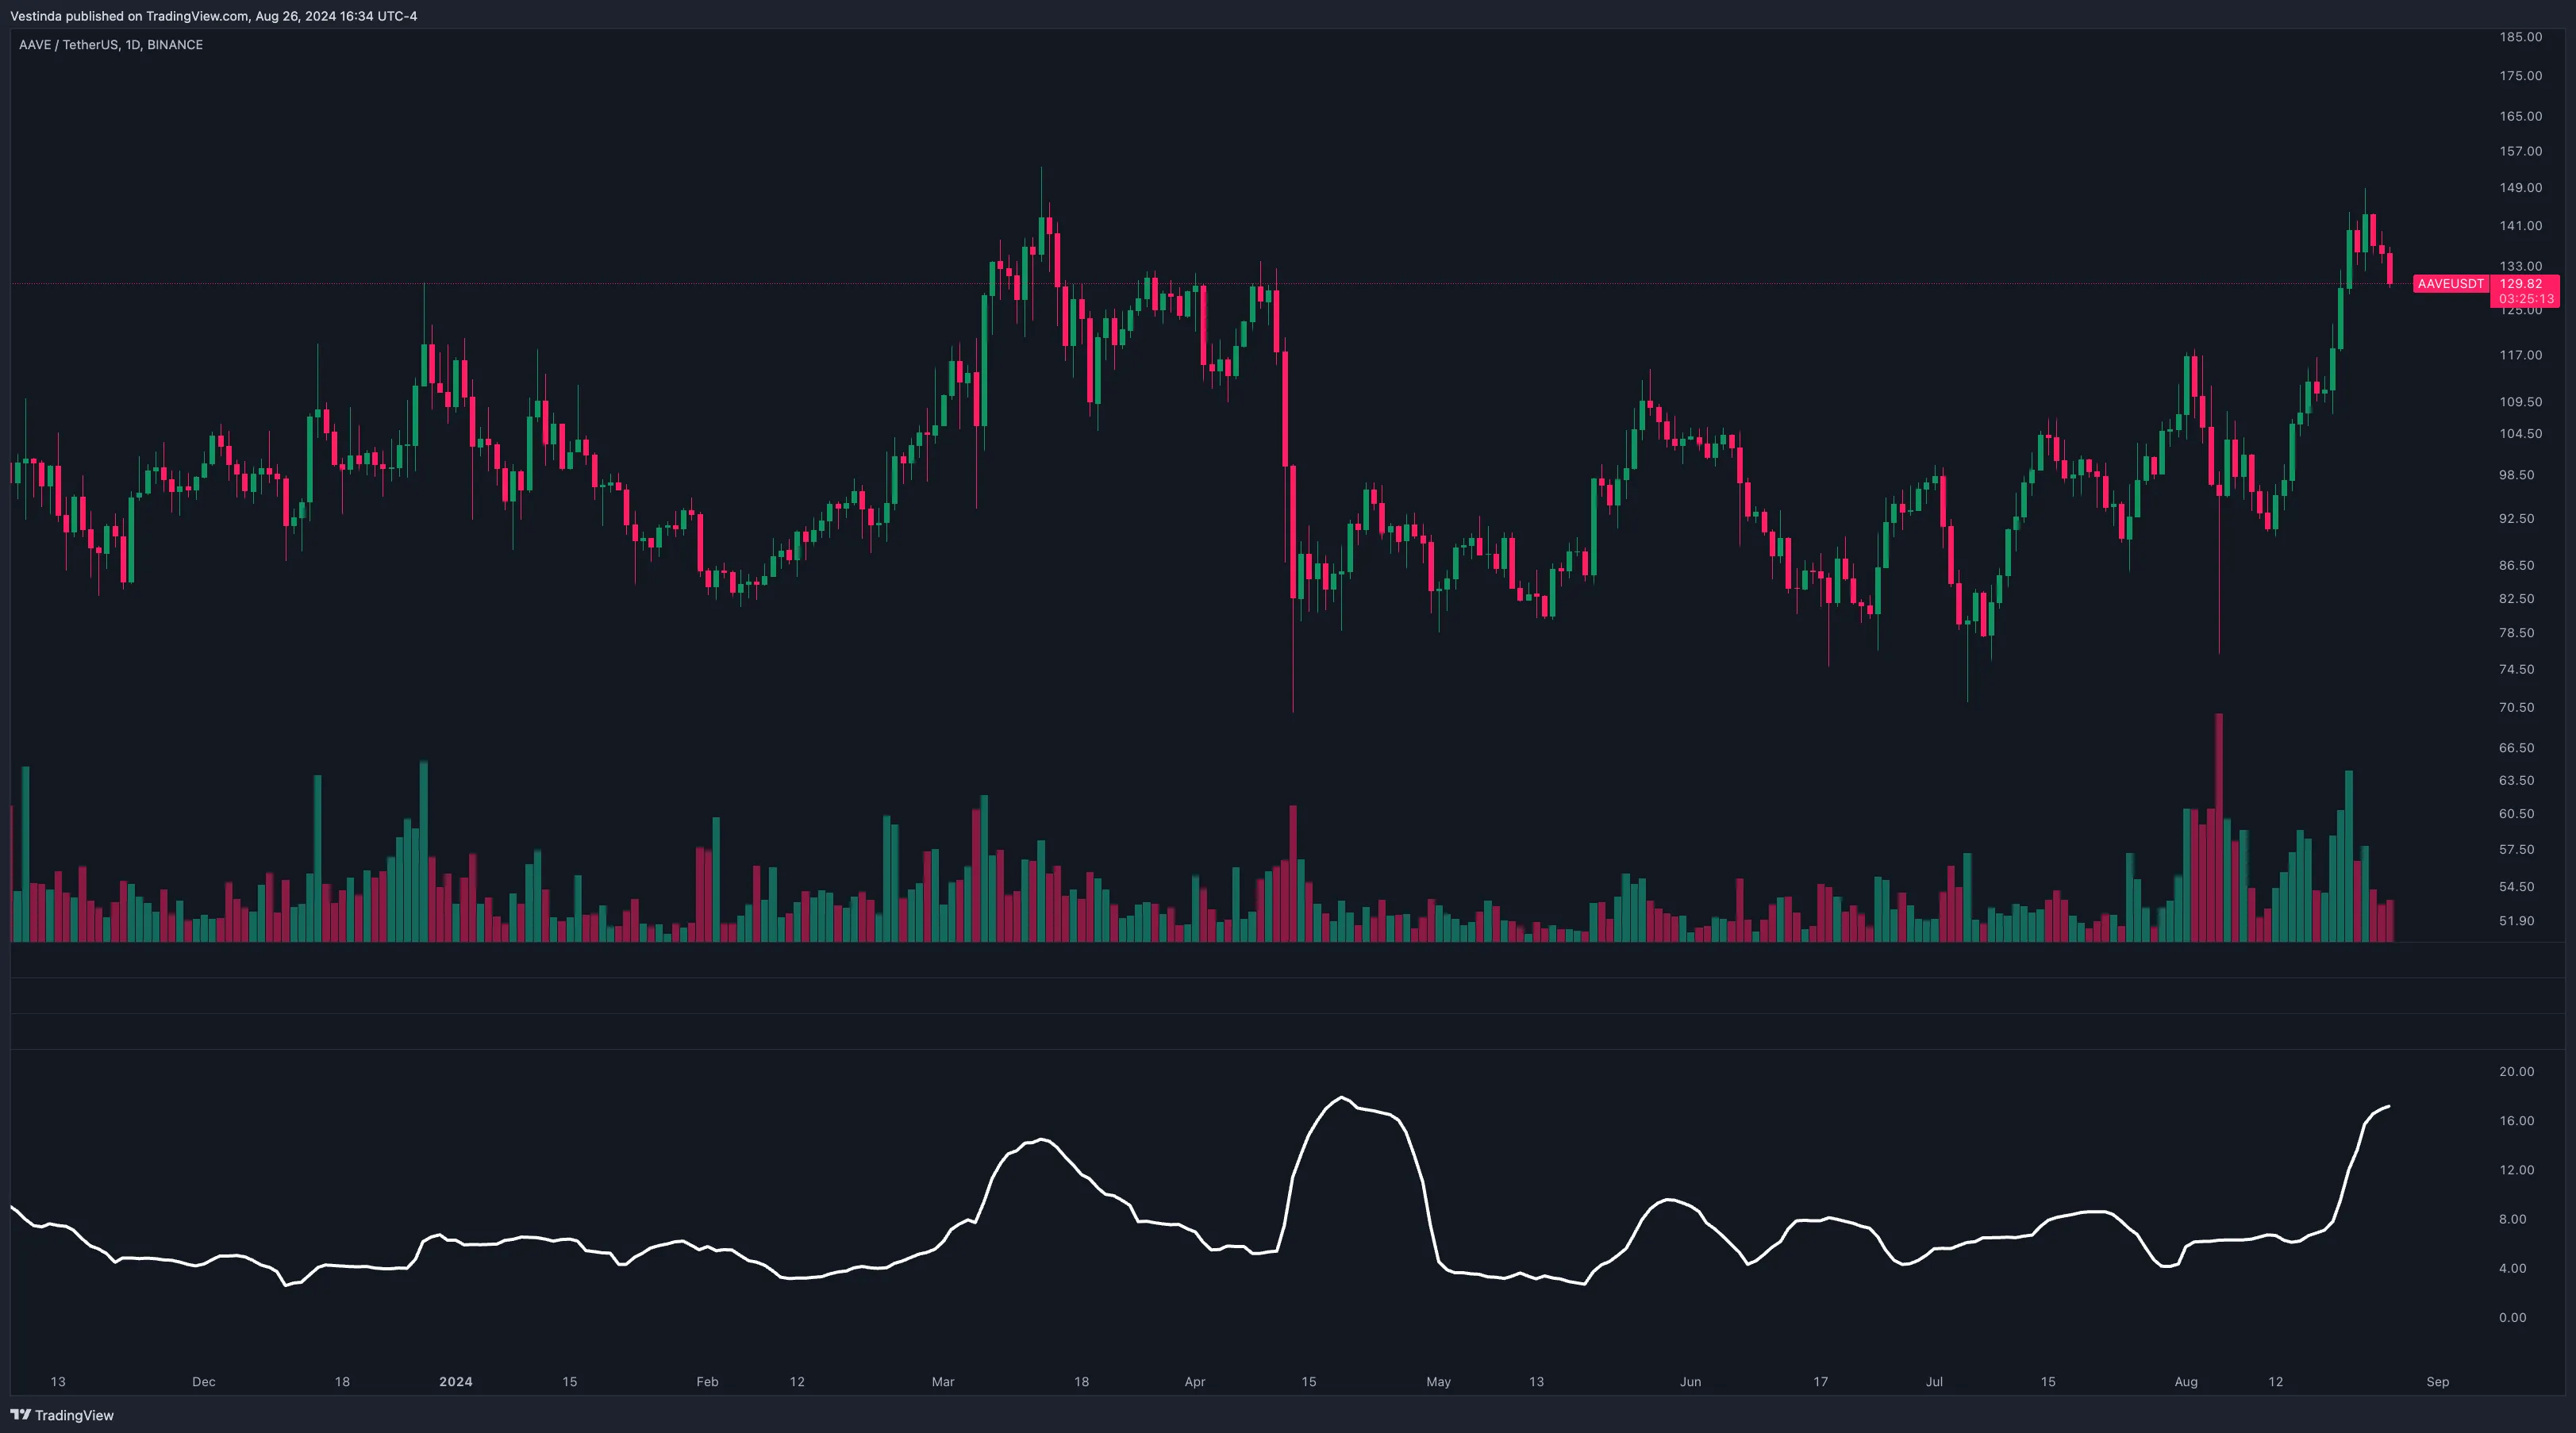
Overview: Standard Deviation is a statistical measure that quantifies the amount of variation or dispersion in a set of values. In trading, it is used to gauge how much prices deviate from the mean (average) price over a specific period.
Calculation: The Standard Deviation is calculated using the following formula:

Interpretation:
- High Standard Deviation: Indicates high volatility, meaning prices are widely spread out from the average.
- Low Standard Deviation: Indicates low volatility, meaning prices are closely clustered around the average.
Why Use the Standard Deviation Indicator?
- Volatility Measurement: The Standard Deviation indicator provides a clear measure of market volatility, helping traders identify periods of high or low risk.
- Risk Management: By understanding volatility, traders can adjust their position sizes and stop-loss levels to manage risk effectively.
- Trend Confirmation: The indicator can be used to confirm trends, as high volatility often accompanies the start of new trends or major price movements.
Key Standard Deviation Indicator Trading Strategies
Volatility Breakout Strategy
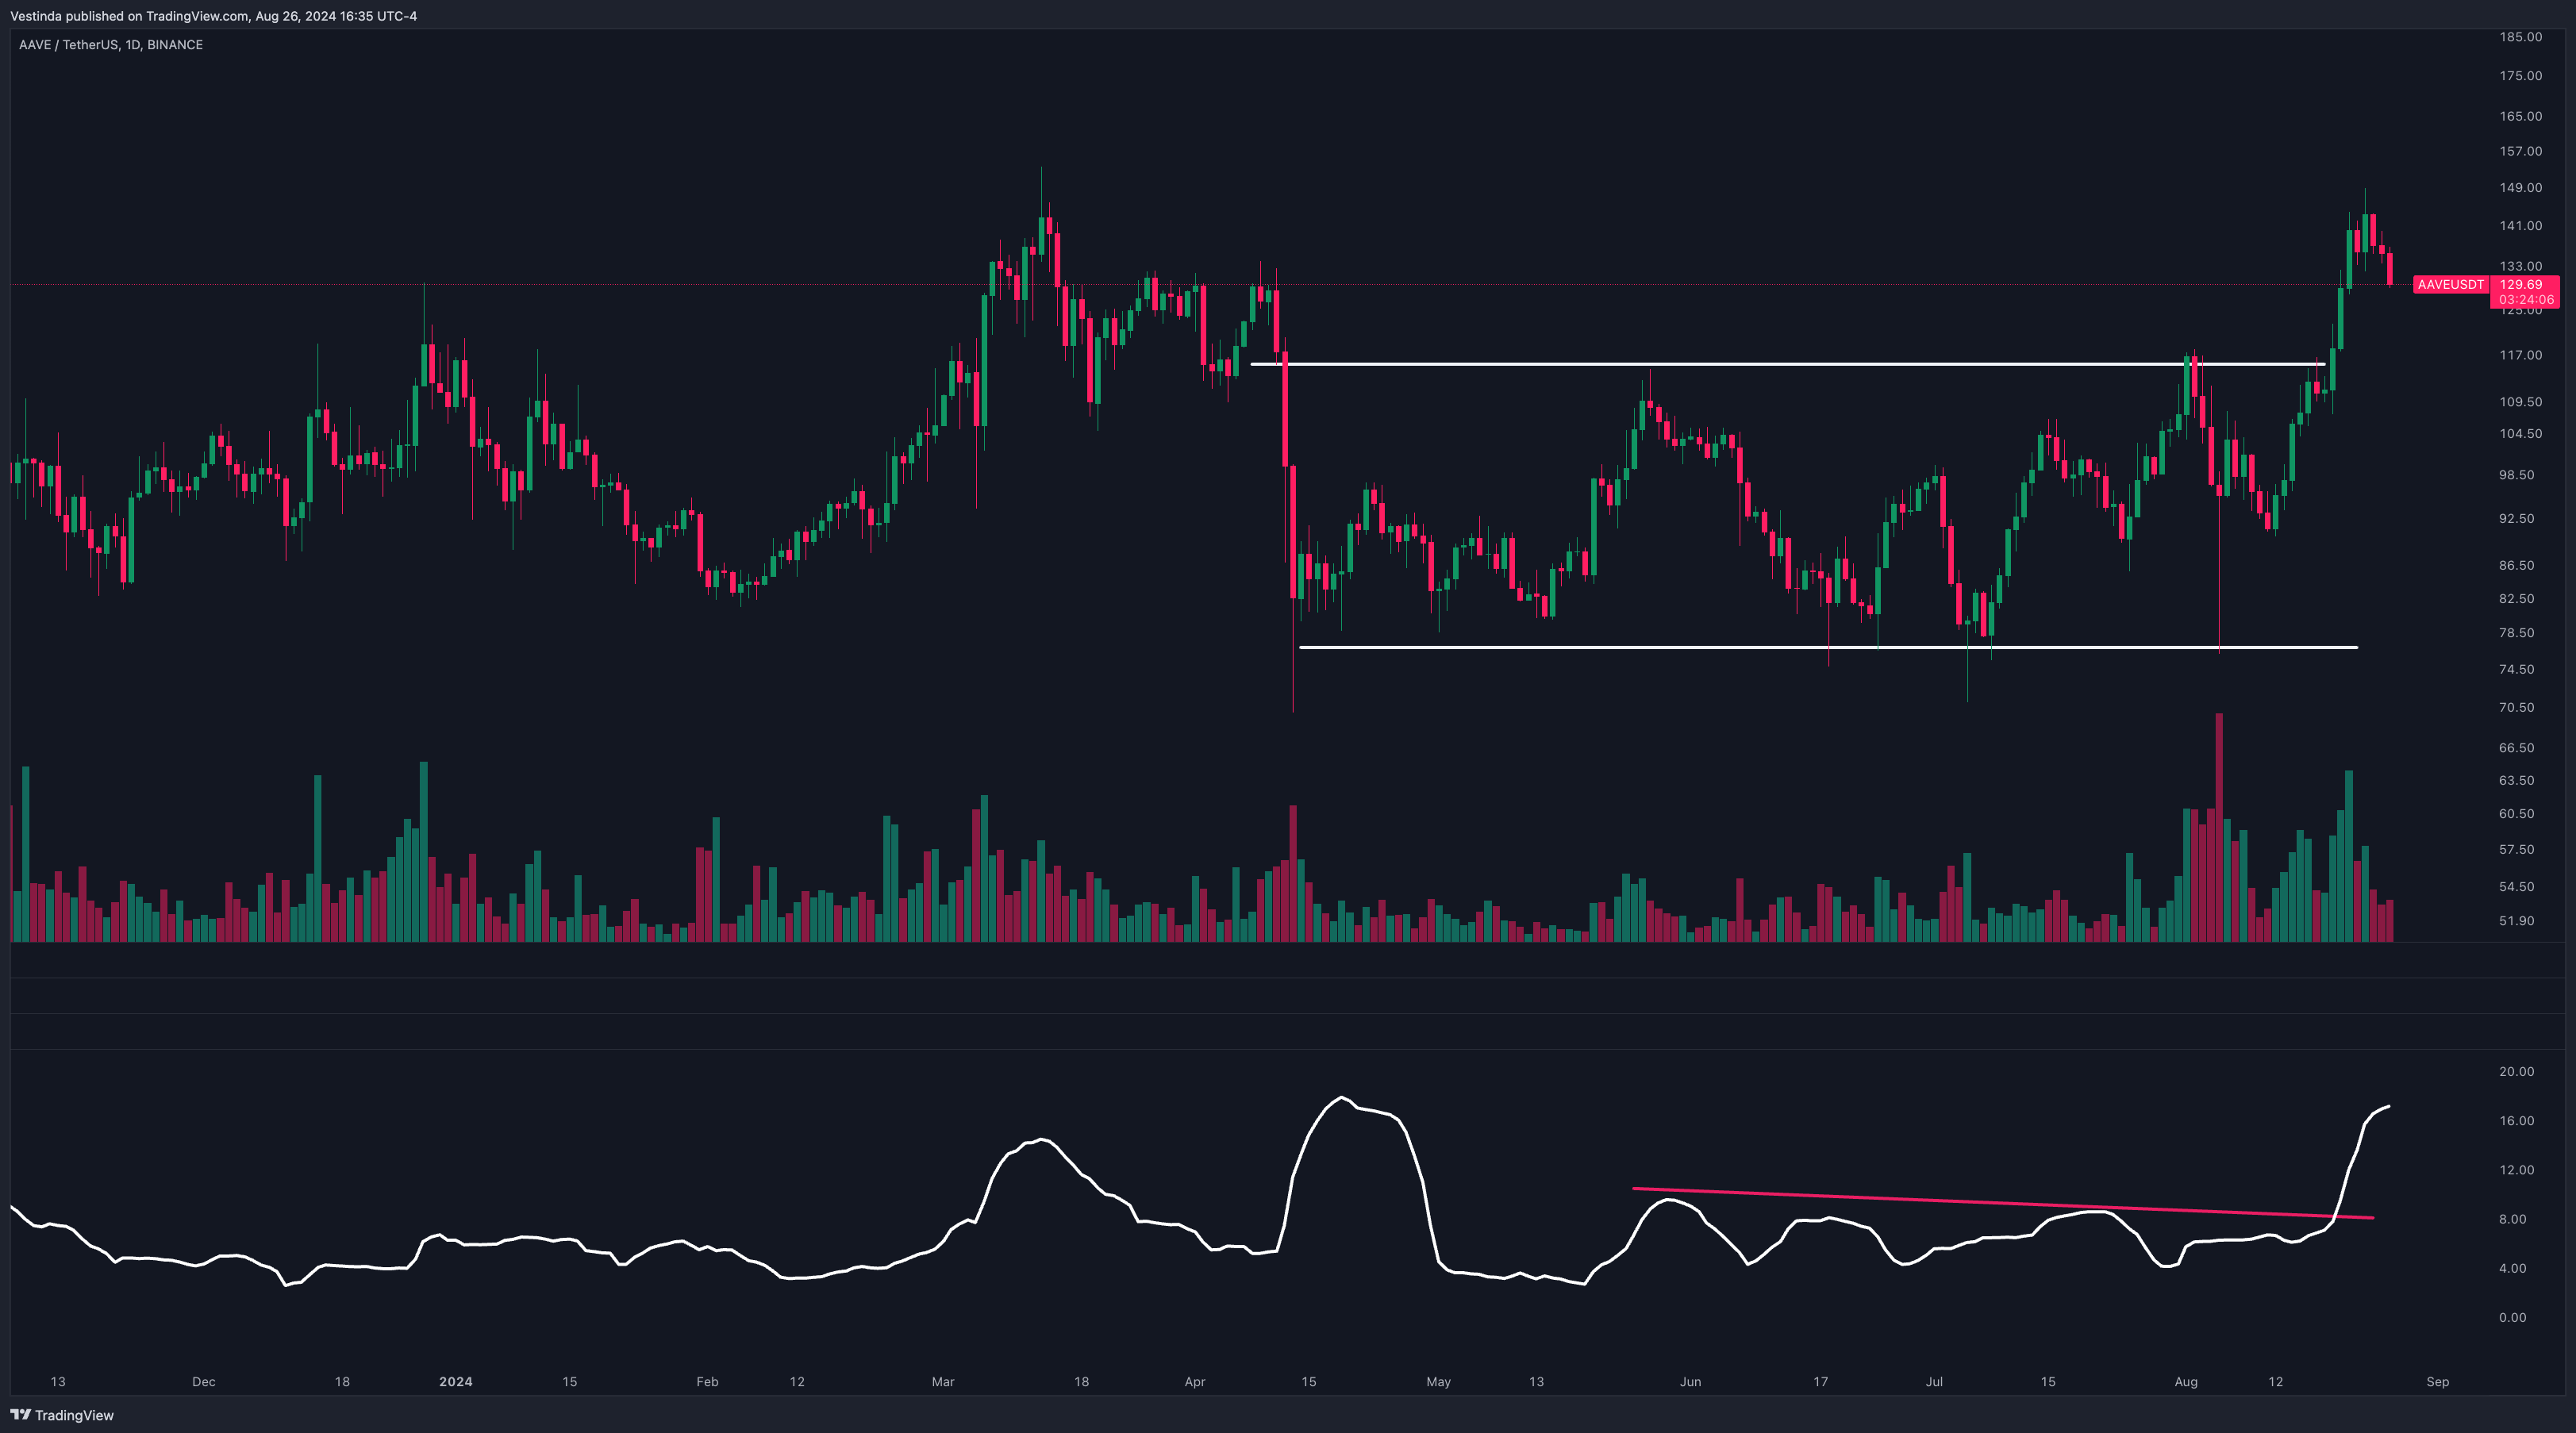
Concept: Trade on the breakout of a price range during periods of high volatility, as indicated by a rising Standard Deviation.
How to Implement:
- Buy Signal: When the Standard Deviation rises sharply, indicating increased volatility, and the price breaks above a key resistance level, consider entering a long position.
- Sell Signal: When the Standard Deviation rises sharply and the price breaks below a key support level, consider entering a short position.
Application: This strategy is ideal for capturing large price movements that occur after periods of low volatility.
Bollinger Bands Strategy
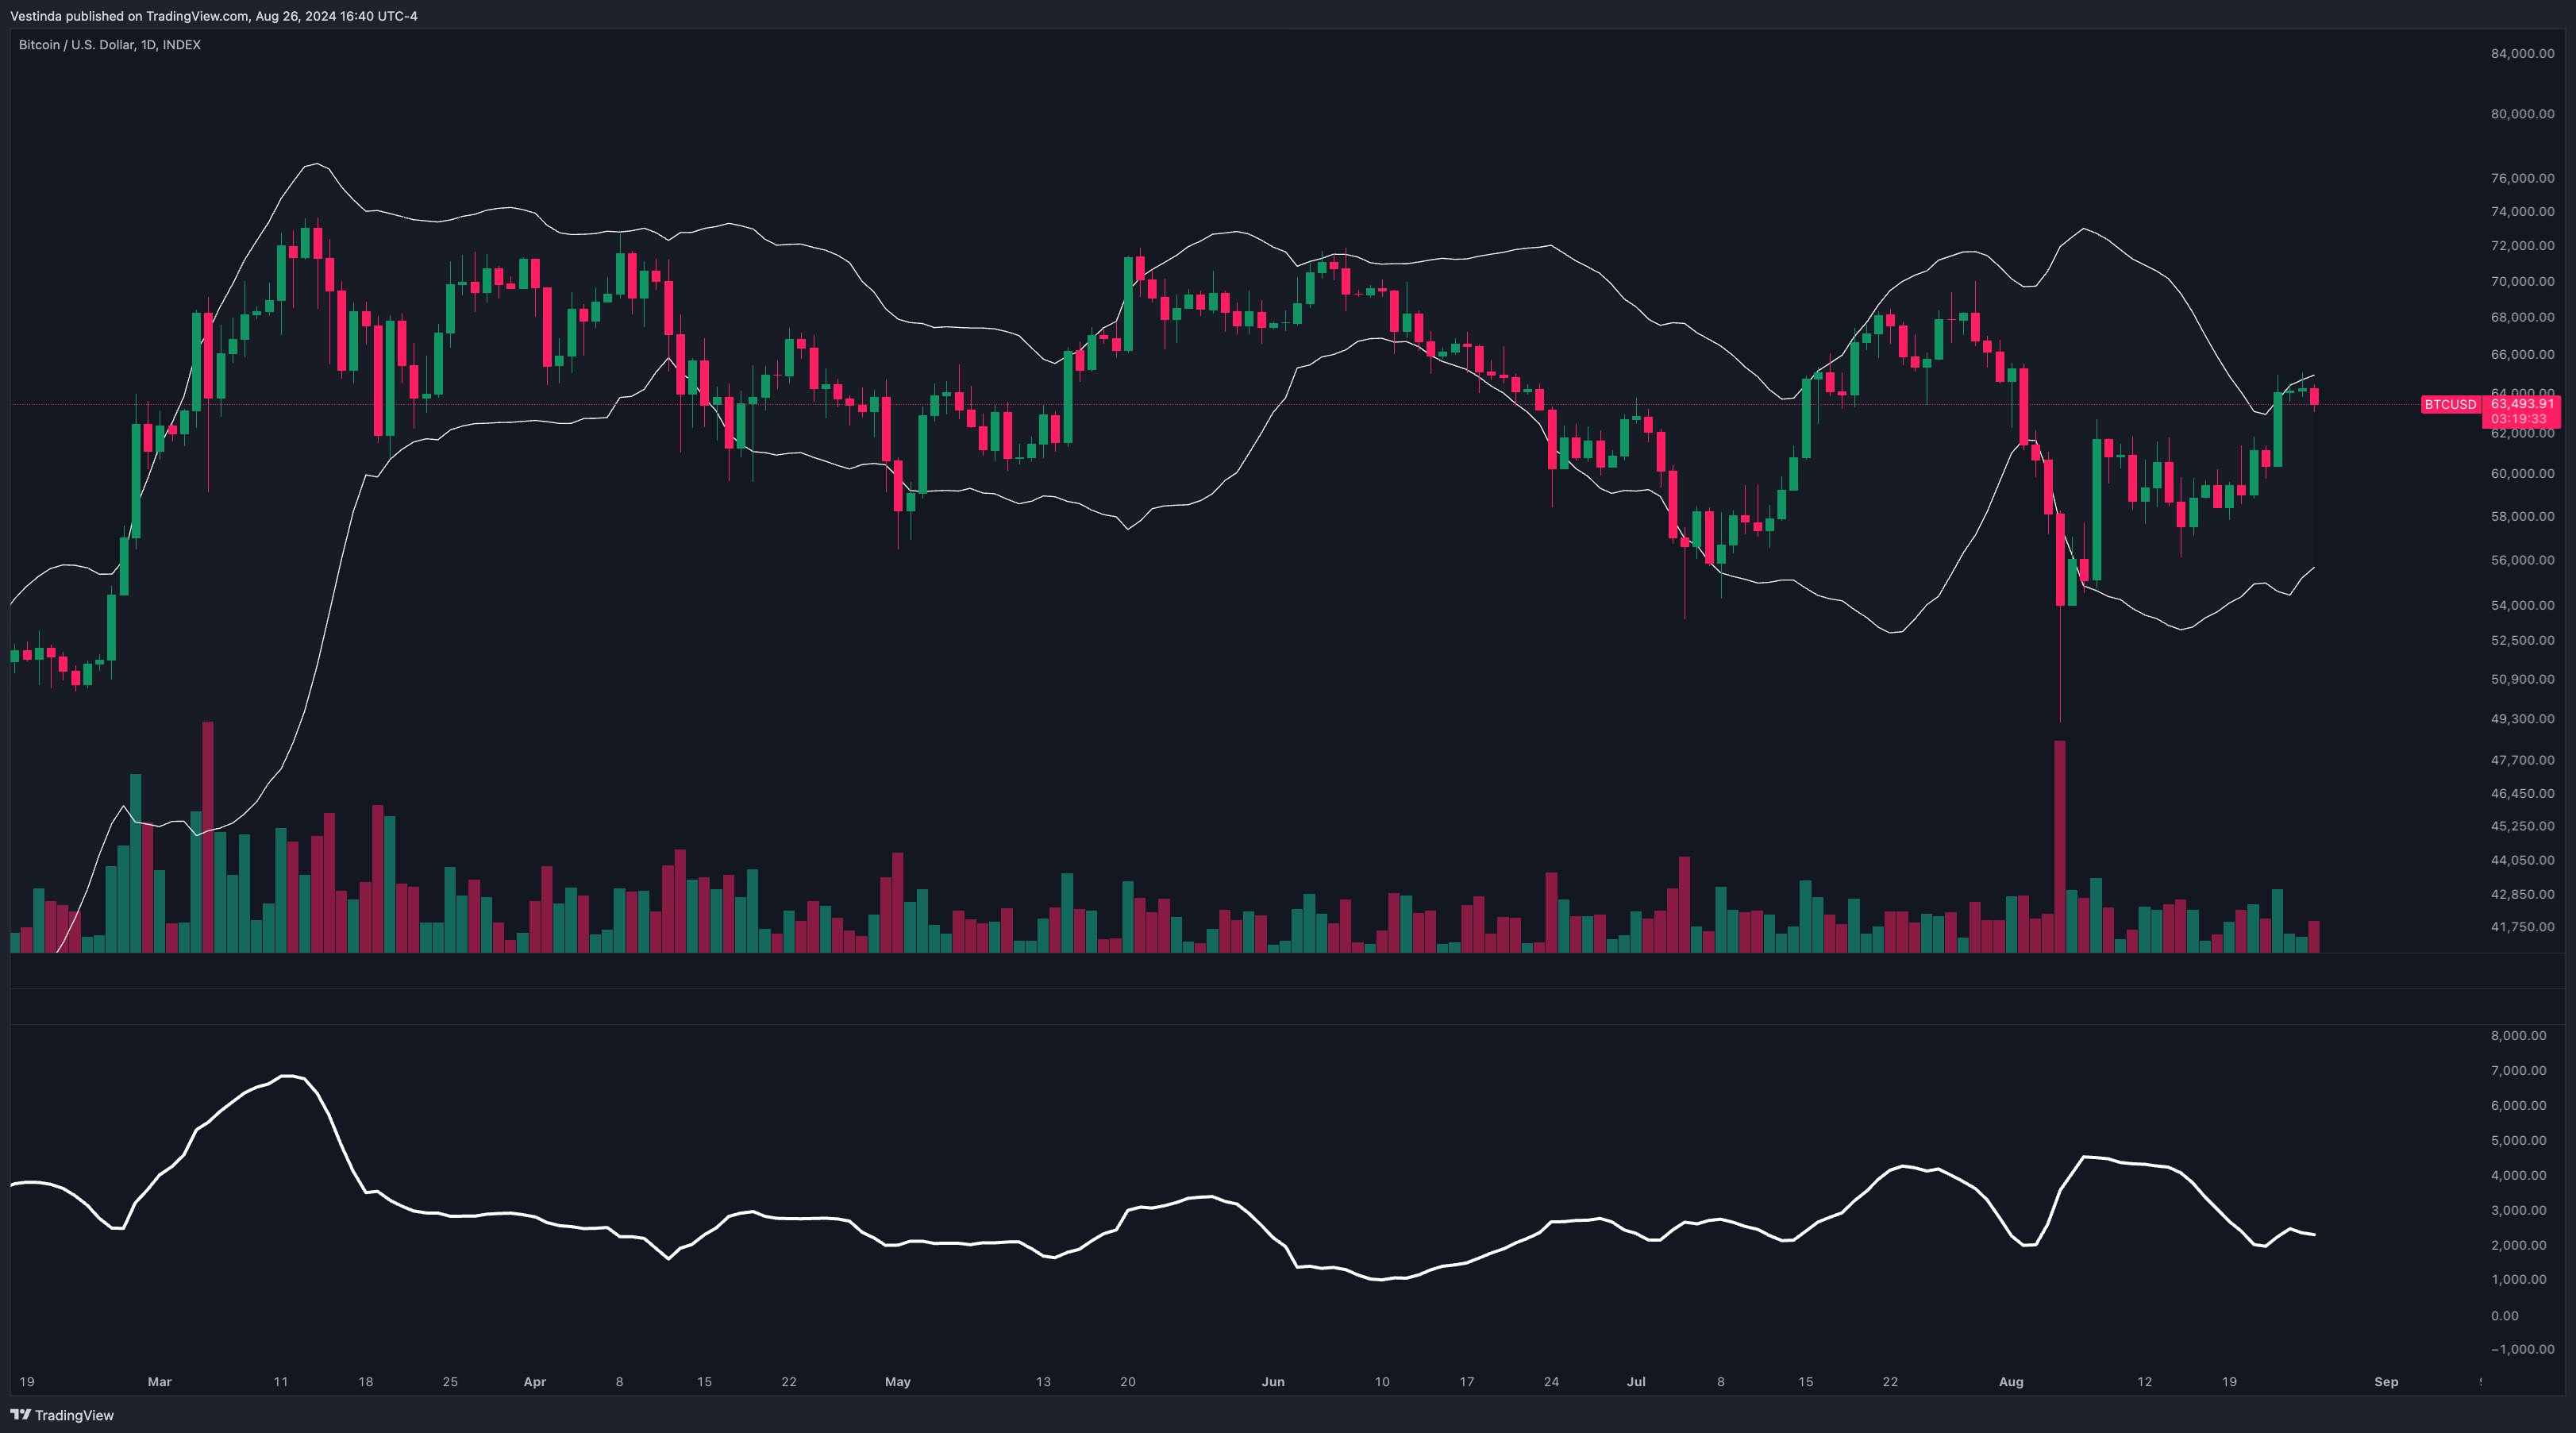
Concept: Bollinger Bands are built using the Standard Deviation, and they can be used to trade price movements within the bands.
How to Implement:
- Indicators: Use Bollinger Bands (typically set at 2 standard deviations above and below a 20-period moving average).
- Buy Signal: When the price touches or moves below the lower Bollinger Band, consider entering a long position, expecting a bounce back toward the mean.
- Sell Signal: When the price touches or moves above the upper Bollinger Band, consider entering a short position, expecting a pullback toward the mean.
Application: This strategy is effective in ranging markets, where prices tend to move within the bands.
Standard Deviation and Trend Strength Strategy
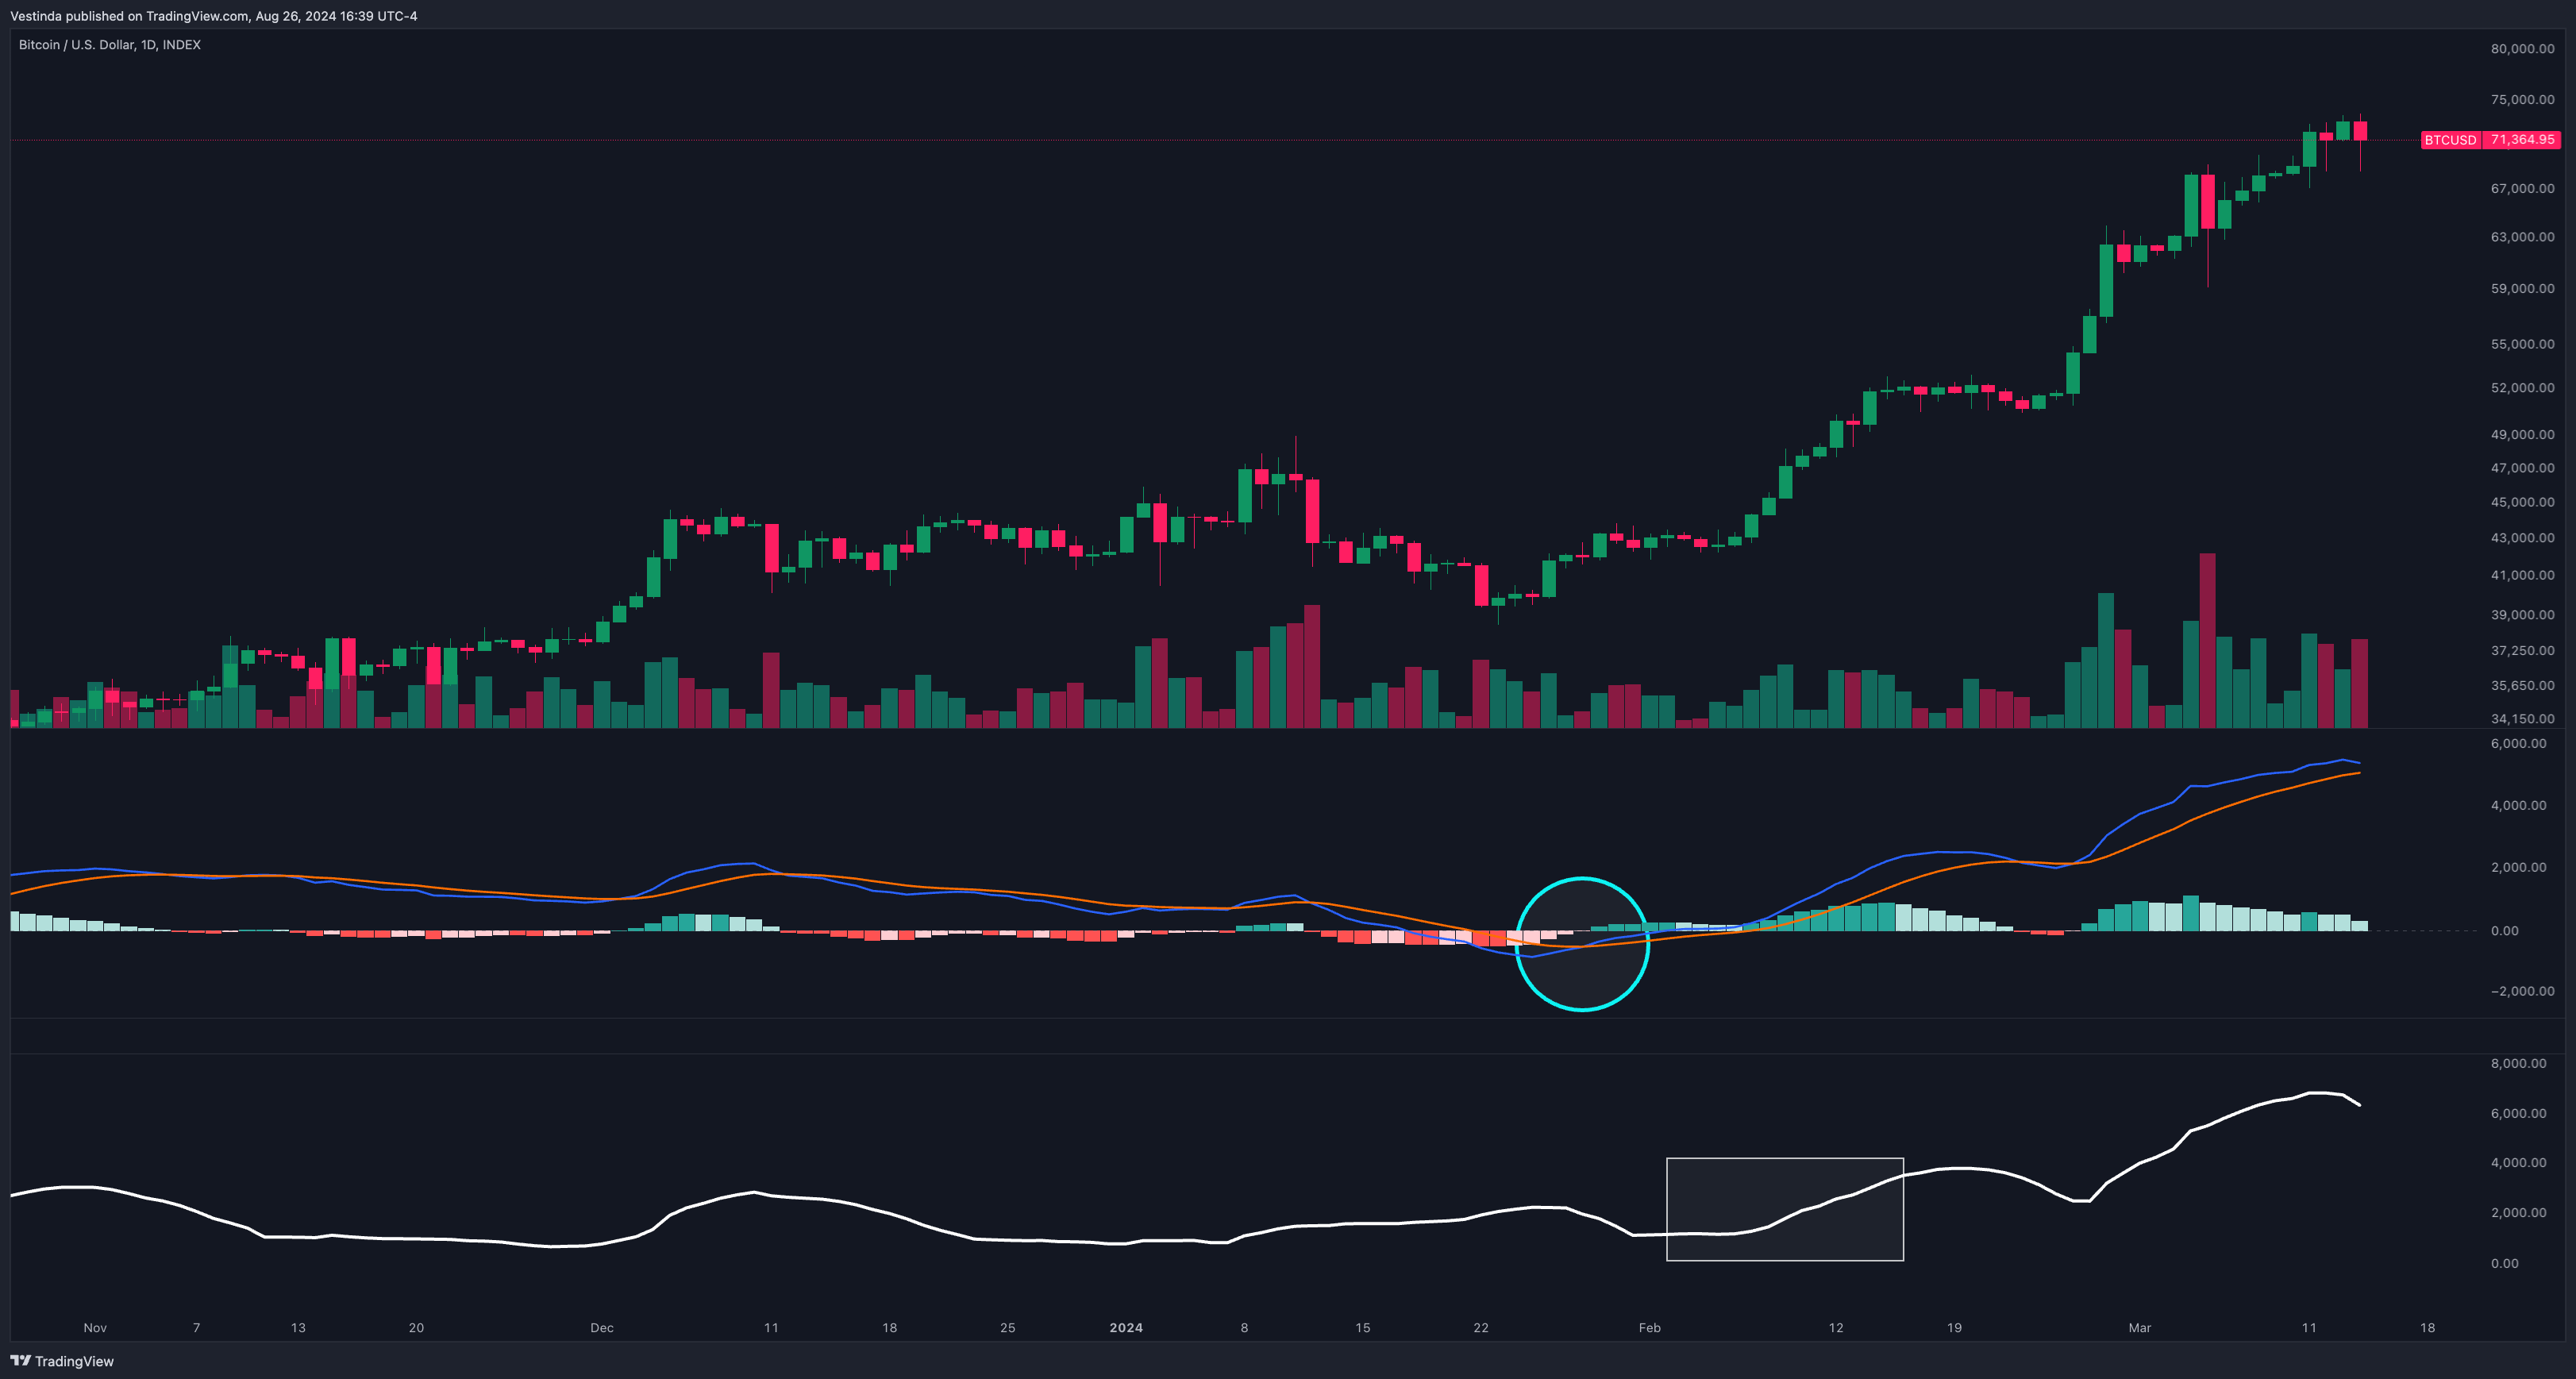
Concept: Use the Standard Deviation indicator to assess the strength of a trend by measuring the volatility within the trend.
How to Implement:
- Indicators: Combine the Standard Deviation with a trend-following indicator like the Moving Average Convergence Divergence (MACD).
- Buy Signal: When the Standard Deviation increases along with a bullish MACD crossover, consider entering a long position, indicating a strong uptrend.
- Sell Signal: When the Standard Deviation increases along with a bearish MACD crossover, consider entering a short position, indicating a strong downtrend.
Application: This strategy helps traders stay with the trend during periods of high volatility and exit when volatility decreases.
Using the Standard Deviation Indicator Across Markets
- Stocks: The Standard Deviation indicator can help identify periods of high volatility around earnings reports, news events, or market open/close.
- Forex: In forex trading, the Standard Deviation indicator is useful for identifying volatile currency pairs and adjusting trading strategies accordingly.
- Cryptocurrencies: Given the high volatility in crypto markets, the Standard Deviation indicator can help traders manage risk and capitalize on large price swings.
Benefits of Using the Standard Deviation Indicator
- Volatility Awareness: The Standard Deviation indicator provides clear insights into market volatility, helping traders adjust their strategies in real-time.
- Risk Management: By understanding the level of volatility, traders can better manage their risk by setting appropriate stop-loss levels and position sizes.
- Versatility: The Standard Deviation indicator can be applied across various markets and timeframes, making it suitable for different trading styles.
Optimizing Quantitative Trading with Standard Deviation
It measures the volatility or risk of a stock's price movement. Traders can use standard deviation to determine the potential range of future price movement. By analyzing historical data, traders can calculate the standard deviation of a stock's price and use it to identify periods of high or low volatility. This information can be used to make informed trading decisions. For example, a trader may choose to buy or sell a stock based on whether its price is currently trading within or outside of its standard deviation range. Additionally, standard deviation can be used in the development of trading strategies, such as mean reversion or trend following, to identify optimal entry or exit points. Overall, incorporating standard deviation into quantitative trading strategies can provide traders with valuable insights into market volatility and potential trading opportunities.
Pros of Standard Deviation Indicator in Trading
It helps traders identify market volatility and potential price fluctuations. With its ability to measure the dispersion of data points around the mean, the standard deviation indicator offers several advantages. Firstly, it provides insights into the level of risk associated with a particular investment or trading strategy. Traders can assess the likelihood of price movements and adjust their positions accordingly. Secondly, it helps identify overbought and oversold conditions, allowing traders to capitalize on potential reversal opportunities. By observing deviations from the mean, traders can spot when an asset's price is deviating from its normal range, indicating a potential change in market sentiment. Additionally, the indicator can be used to confirm trend strength or weakness. For example, if the standard deviation value is low during an uptrend, it suggests a stable and strong trend. Conversely, a high standard deviation during a downtrend may signal increased market uncertainty. Overall, the standard deviation indicator is a valuable tool for traders to navigate the dynamic financial markets.
Precision in Intraday and Day Trading: Standard Deviation
It measures the volatility of a financial instrument's price movement. The indicator calculates how far the price of an asset deviates from its average price over a given period. Intraday and day traders can use the standard deviation indicator to identify potential price reversals, breakouts, and trend exhaustion. By understanding the level of volatility in the market, traders can manage risk more effectively and make informed trading decisions. Traders can use the standard deviation indicator alongside other technical analysis tools such as moving averages or Bollinger Bands to confirm potential trading signals and improve their overall trading strategies. However, it is important to note that no indicator or strategy is foolproof, and traders should always consider other factors such as market conditions and fundamentals before making trading decisions.
-
100,000 available assets New
-
years of historical data
-
practice without risking money

Frequently Asked Questions
The best time for calculating the standard deviation depends on the specific context and data being analyzed. However, it is generally recommended to calculate the standard deviation after collecting a sufficient sample size to ensure statistical validity. This allows for a more accurate representation of the population or data set. Additionally, it may be useful to calculate the standard deviation at different intervals or time points to identify trends or patterns over time. Ultimately, the best time for calculating standard deviation is when there is enough data available to provide meaningful insights and analysis.
There is no single indicator that can be considered the most powerful for forex trading. Different indicators serve different purposes and have their own strengths and weaknesses. Traders often use a combination of indicators, such as moving averages, MACD, RSI, and Bollinger Bands, to enhance their analysis and decision-making. Ultimately, it is important for traders to develop a comprehensive trading strategy that takes into account a variety of indicators, along with other factors such as market sentiment, economic news, and risk management techniques.
To backtest a trading strategy using indicators, follow these steps: Firstly, select a platform or software that allows you to input indicators and trade historical data. Next, choose the indicators that align with your strategy. Define the entry and exit criteria using these indicators. Then, collect historical data and set a time frame for the simulation. Apply the indicators according to your strategy's rules and record the results. Finally, analyze the performance using metrics like profit/loss, win rate, and risk-reward ratio. Repeat the process with different timeframes or settings to refine your strategy.
Choosing the right technical indicator for your trading style requires considering various factors. Firstly, understand your trading goals and time horizons. Short-term traders may prefer indicators like RSI or MACD, while long-term investors might rely on moving averages or trendlines. Additionally, evaluate the indicator's effectiveness in different market conditions and its compatibility with your preferred trading assets. Consider your risk tolerance and trading experience as well. It's always prudent to test indicators on historical data and consult with experienced traders or professionals to determine which one aligns best with your trading style.
Standard deviation is a statistical measure that indicates the extent to which data points deviate from the mean. It is commonly used to understand the variability or dispersion in a dataset. By calculating the standard deviation, you can assess the spread of values and identify outliers. This helps in making informed decisions regarding data analysis, risk assessment, and quality control. Moreover, standard deviation allows for comparing data sets and determining which one has more variability. Overall, utilizing standard deviation effectively enhances data interpretation and aids in drawing meaningful conclusions.
There is no single technical indicator that can be labeled as the most accurate for forex trading. Various indicators, such as moving averages, MACD, RSI, and Bollinger Bands, among others, provide different insights into market trends and conditions. Traders often use a combination of indicators to increase the accuracy of their trades. It is essential to consider market conditions, timeframes, and other factors when selecting indicators for analysis. Ultimately, successful forex trading is based on a comprehensive approach that incorporates multiple indicators and thorough analysis rather than relying solely on a single indicator.
Conclusion
In conclusion, Standard Deviation indicator trading strategies offer valuable insights into market volatility and potential price movements. By incorporating the standard deviation indicator into trading strategies, traders can enhance risk management and make more informed investment decisions. This powerful tool helps traders identify overbought and oversold conditions, confirm trend strength, and determine optimal entry and exit points. Additionally, it measures the dispersion of data points around the mean, providing insights into the level of risk associated with a particular investment or trading strategy. While no strategy is foolproof, the standard deviation indicator is a valuable tool for traders to navigate the dynamic financial markets and improve their overall trading strategies.

Successful traders rely on backtesting to be profitable.
Be like them with our
Free Backtesting Guide