
Sophisticated backtesting is not only possession of high-esteemed hedge funds anymore.
Impressive Team and support, Backtesting engine with detailed reports, The Strategy builder.

Great purchase!
I have always manually invested in stocks and cryptocurrencies, but after studying Vestinda, I must say it has enormous potential.

Mature platform for trading
Pro: Easy to use, Nice UX, A lot of customization for strategies, Back testing is an awesome tool, can check any strategy in history.

Automated Strategies & Backtesting results for ETH
Here are some ETH trading strategies along with their past performance. You can validate these strategies (and many more) for free on Vestinda across thousands of assets and many years of historical data.
Automated Trading Strategy: Follow the trend on ETH
Based on the backtesting results statistics for the trading strategy from March 15, 2020, to March 15, 2021, the strategy has shown promising performance. The profit factor stands at 3.04, indicating that for every dollar risked, the strategy has generated $3.04 in profit. The annualized return on investment (ROI) is an impressive 184.99%, implying that if this performance is maintained over a year, nearly twice the initial investment can be expected. On average, trades were held for 1 week and 2 days, with an average of 0.44 trades per week. Out of a total of 23 closed trades, the winning trades percentage stands at 39.13%. These results suggest that the strategy has potential for generating profitable returns.

 ETHUSDT

Choose another period and try again.
Automated Trading Strategy: Template - LONG DEMA and Bollinger Bands on ETH
The backtesting results for this trading strategy from March 15, 2020 to March 15, 2021 are quite impressive. The profit factor stands at 3.1, indicating that for every dollar invested, the strategy managed to generate $3.1 in profit. The annualized return on investment (ROI) is an astounding 353.56%, showcasing the strategy's ability to generate high returns over a one-year period. On average, the holding time for trades was approximately 4 days and 7 hours, suggesting a relatively short-term approach. With an average of 0.97 trades per week and a total of 51 closed trades, this strategy indicates frequent but selective trading. The winning trades percentage is at 43.14%, demonstrating the strategy's ability to secure gains.
ETHUSDT
Choose another period and try again.
Automated Trading Strategy: Ride the clouds on ETH
During the period from March 15, 2020, to March 15, 2021, the backtesting results of the trading strategy reveal promising statistics. The profit factor stands at a commendable 5.34, indicating a highly profitable system. The strategy showcases an annualized return on investment (ROI) of an impressive 379.99%. On average, each position was held for approximately 4 days and 3 hours, highlighting a moderately short-term approach. Despite a relatively low average of 0.65 trades per week, the strategy managed to close a total of 34 trades. Notably, 47.06% of the trades were successful, further reinforcing the strategy's competitiveness and potential profitability.
ETHUSDT
Choose another period and try again.
Understanding Ethereum: The Future of Digital Currency
Ethereum (ETH) is a digital currency that operates on a decentralized blockchain platform. It was created to enable smart contracts and the development of decentralized applications (DApps). As one of the largest cryptocurrencies by market capitalization, ETH has gained significant attention in recent years. Unlike traditional money, ETH is not controlled by any central authority, making it highly secure and transparent. It has become increasingly popular for its potential to revolutionize industries such as finance, supply chain management, and gaming. With its widespread adoption and innovative features, ETH presents unique opportunities for traders in the crypto market.
Mastering Ethereum Trading Strategies: A Comprehensive Guide
Ethereum (ETH) has emerged as one of the leading assets for traders, providing numerous opportunities due to its significant volatility and liquidity. To thrive in trading ETH, it's crucial to grasp various strategies that can aid in making well-informed decisions. This article will explore the primary methods of trading Ethereum, including technical analysis, fundamental analysis, and the use of indicators for automation. We will also provide detailed charts to illustrate these strategies.
1. Technical Analysis
Technical analysis involves examining price charts and employing indicators to forecast future price movements. Here are some fundamental techniques:
Fibonacci Retracements
Fibonacci retracement levels are predicated on the notion that markets will retrace a predictable portion of a move before continuing in the initial direction. These levels, derived from the Fibonacci sequence, can assist in identifying potential reversal points.
How to Use Fibonacci Retracements on ETH:
- Identify the Market Trend: Determine whether the market is in an upward or downward trend.
- Choose Swing Points: Identify the recent significant swing high and swing low. In an uptrend, the swing low is the starting point, and the swing high is the ending point. In a downtrend, the roles are reversed.
- Apply the Fibonacci Tool: Use the Fibonacci retracement tool to draw a line from the swing high to the swing low (or vice versa).
- Examine Key Levels: The main Fibonacci levels (23.6%, 38.2%, 50%, 61.8%, and 78.6%) serve as potential support and resistance levels where the price may reverse.

Support and Resistance Levels
Support and resistance levels are vital in technical analysis as they denote the price points where a security tends to find support as it falls or resistance as it rises. Understanding these levels can assist traders in deciding when to enter or exit trades.
How to Identify Support and Resistance Levels:
- Analyze Historical Data: Look at historical price movements to pinpoint areas where the price has consistently bounced off (support) or been rejected (resistance).
- Consider Psychological Levels: Psychological levels often occur at round numbers (e.g., $1,000, $2,000).
- Assess Volume Profile: Higher trading volumes at specific price levels can indicate strong support or resistance.
- Use Moving Averages: Long-term moving averages can act as dynamic support and resistance levels.


Trendlines
Trendlines are simple yet effective tools in technical analysis. They help determine the direction and strength of a trend, which is crucial for making trading decisions.

How to Draw Up and Down Trendlines:
- Creating Uptrend Lines: Connect two or more low points in an uptrend to form a line. This line acts as support.
- Creating Downtrend Lines: Connect two or more high points in a downtrend to form a line. This line acts as resistance.
- Validation: For a trendline to be considered valid, the price should touch it at least three times.
- Breakout Identification: A breakout above or below the trendline can signal a potential trend reversal.
MACD (Moving Average Convergence Divergence)
The MACD is a momentum indicator that shows the relationship between two moving averages of a security’s price. It is valuable for identifying changes in the strength, direction, momentum, and duration of a trend.

How to Interpret MACD on Ethereum:
- MACD Line: Calculated by subtracting the 26-period EMA from the 12-period EMA.
- Signal Line: A 9-period EMA of the MACD line, indicating potential buy or sell points.
- Histogram: The difference between the MACD line and the Signal line, reflecting momentum.
- Bullish Indications: Occur when the MACD line crosses above the Signal line or when the histogram turns positive.
- Bearish Indications: Occur when the MACD line crosses below the Signal line or when the histogram turns negative.
RSI (Relative Strength Index)
RSI is a momentum oscillator that measures the speed and change of price movements. It helps traders identify overbought or oversold conditions, signaling potential reversals.

How to Analyze RSI on Ethereum:
- Calculation: RSI is determined using the average gains and losses over a specific period (typically 14 days).
- Overbought Conditions: An RSI above 70 indicates that ETH might be overbought, suggesting a potential sell signal.
- Oversold Conditions: An RSI below 30 indicates that ETH might be oversold, suggesting a potential buy signal.
- Divergence: RSI divergence (when the price moves in the opposite direction to the RSI) can signal potential reversals.
Moving Averages
Moving averages smooth out price data to help identify the trend direction and potential support and resistance levels. They are fundamental tools in technical analysis.

How to Use Moving Averages on ETH:
- Simple Moving Average (SMA): Calculated by averaging the closing prices over a specific period. It helps identify the overall trend.
- Exponential Moving Average (EMA): Gives more weight to recent prices, making it more responsive to new information.
- Crossovers: When a short-term MA crosses above a long-term MA, it signals a bullish trend (Golden Cross). Conversely, a bearish trend is signaled when a short-term MA crosses below a long-term MA (Death Cross).
2. Fundamental Analysis
Fundamental analysis involves evaluating an asset's intrinsic value based on various economic, financial, and other qualitative and quantitative factors. For Ethereum, this might include:
- Market Developments: Staying updated on regulatory changes, technological advancements, and adoption rates.
- On-Chain Metrics: Analyzing data such as hash rate, transaction volumes, and wallet addresses to understand network activity and investor behavior.
- Macroeconomic Factors: Considering the impact of global economic trends, interest rates, and geopolitical events on Ethereum's value.

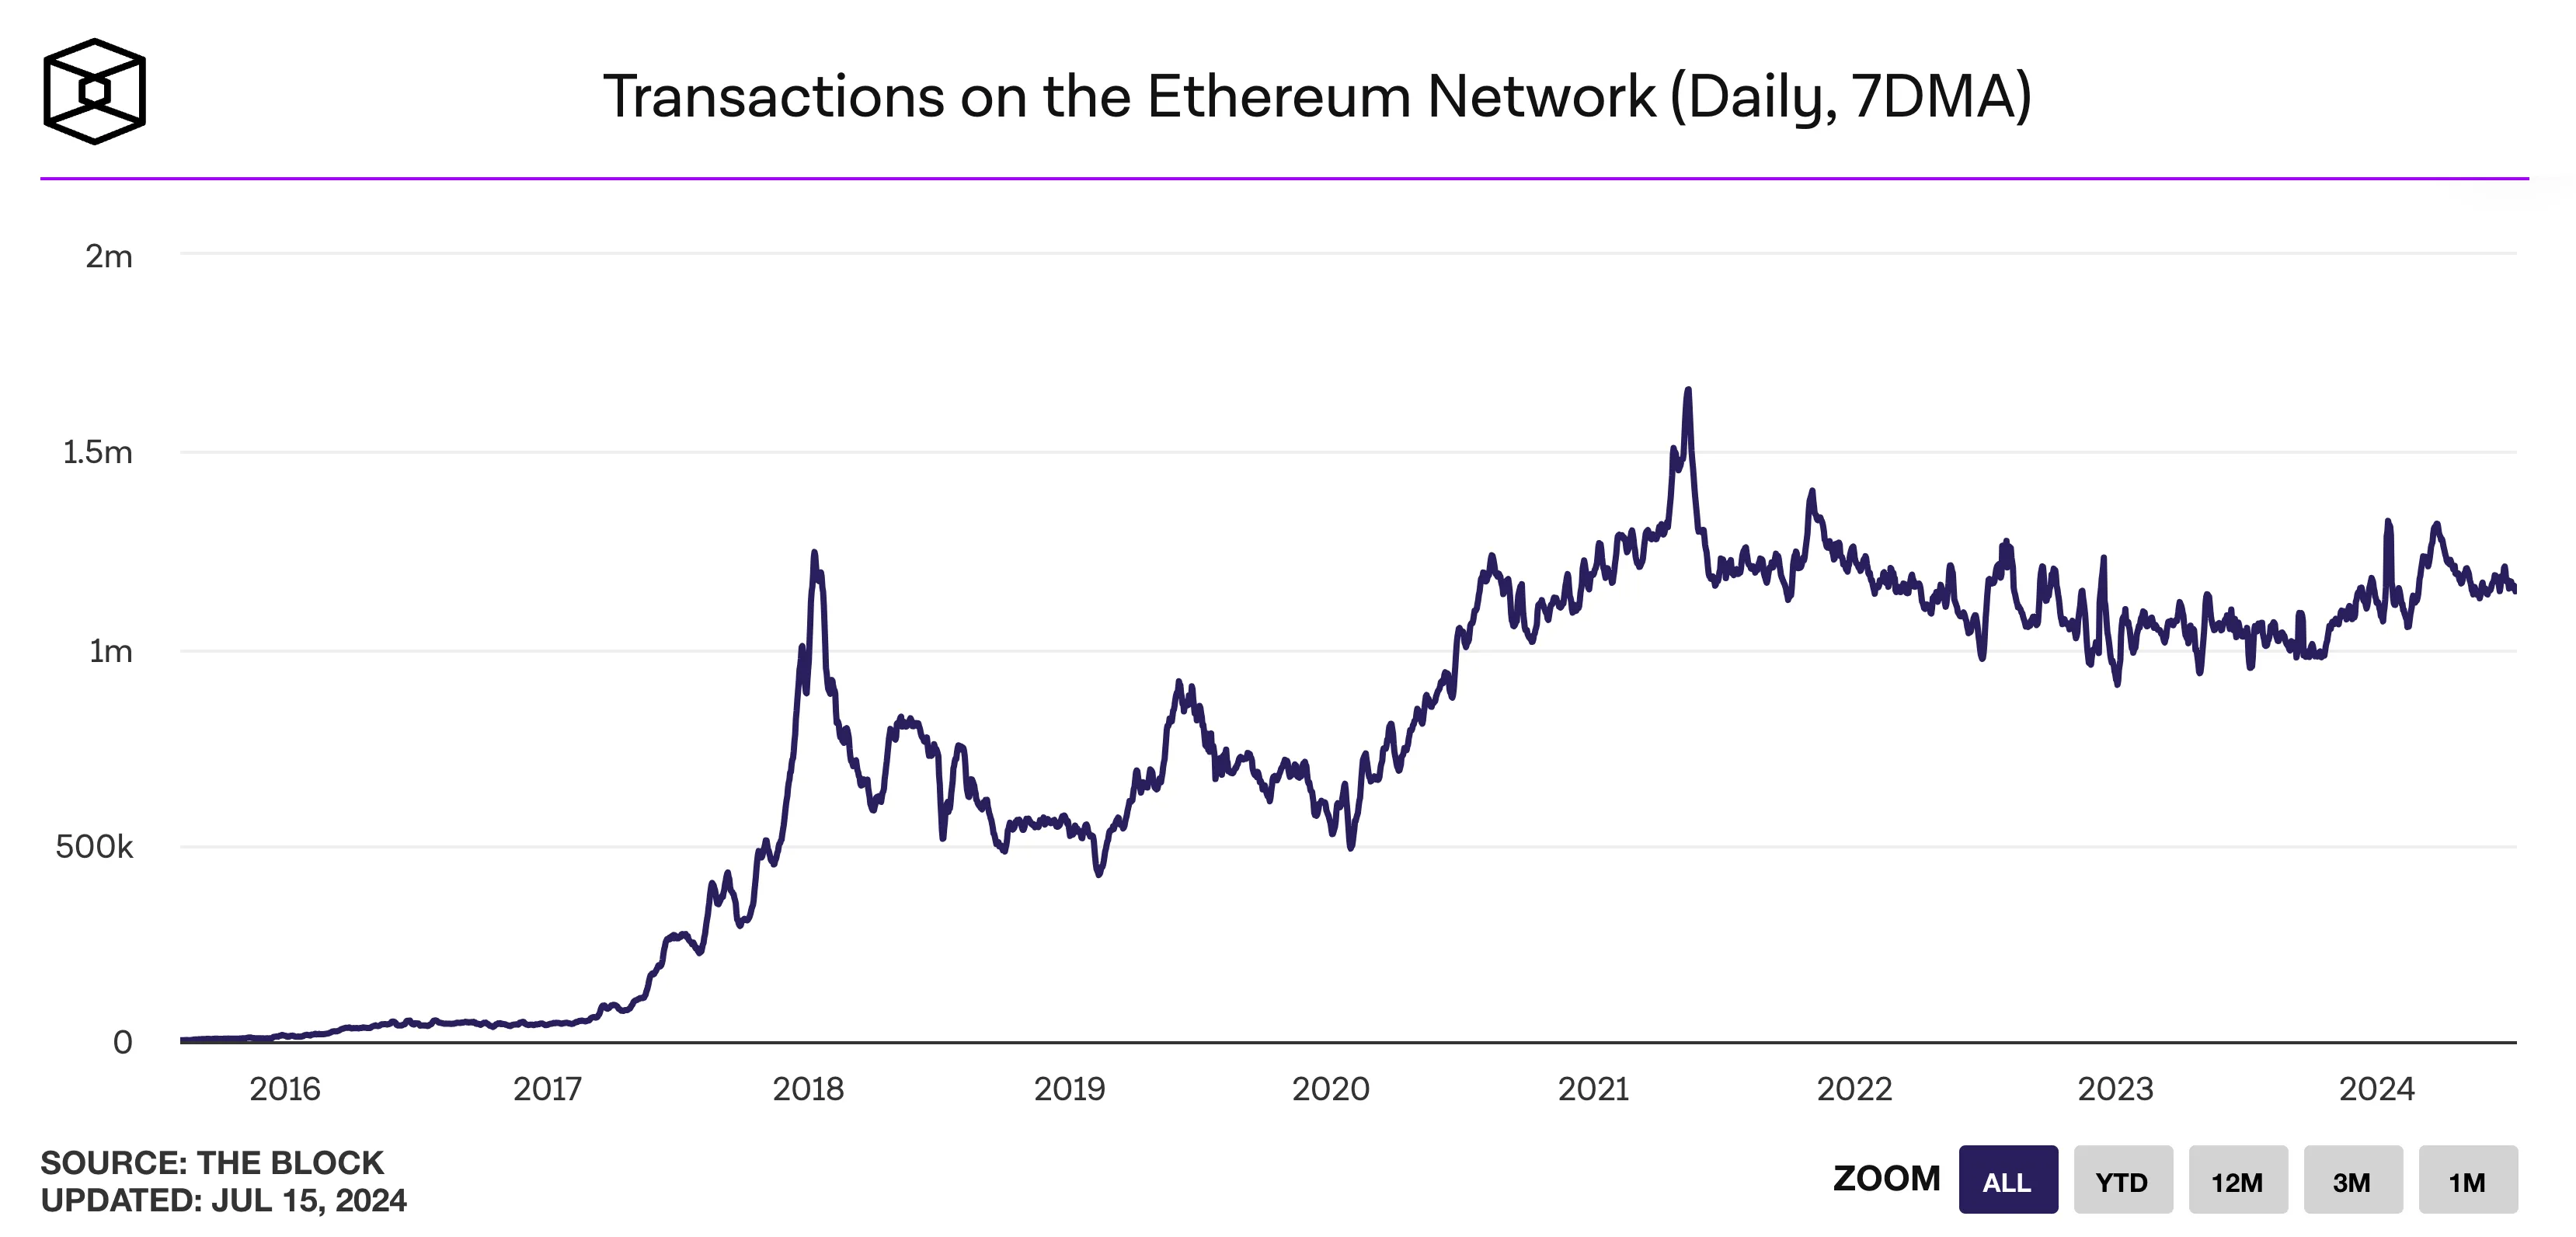

3. Automated Trading
Automating your Ethereum trading strategies can help you execute trades more efficiently and eliminate emotional decision-making. Various platforms, like Vestinda, offer automation tools that allow you to use indicators and predefined strategies.

Using Indicators for Automated Trading:
- Setting Up Indicators: Choose indicators like MACD, RSI, or Moving Averages based on your trading strategy.
- Creating Strategies: Combine multiple indicators to create robust trading strategies. For example, using MACD for trend confirmation and RSI for entry/exit points.
- Backtesting: Test your strategies using historical data to ensure their effectiveness. Backtesting helps identify strengths and weaknesses, allowing for adjustments before live trading.
- Automation Tools: Use platforms like Vestinda to automate the execution of your strategies. This ensures that trades are executed according to predefined rules without human intervention, reducing the risk of emotional trading.
Utilizing Tools for ETH Trading Success
Technical Analysis Tools for ETH Trading
When trading Ethereum (ETH), utilizing technical analysis tools can help you make more informed trading decisions. These tools provide insights into past price data and trends, aiding in predicting future price movements.
One commonly used tool is moving averages. They help identify the average price over a specific time period, smoothing out short-term fluctuations. By comparing different moving averages, such as the 50-day and 200-day moving averages, you can identify potential buy or sell signals.
Support and resistance levels are another valuable tool. Support represents a price level where buying pressure outweighs selling pressure, while resistance indicates a level where selling pressure surpasses buying. Identifying these levels can help determine optimal entry and exit points for trades.
Additionally, chart patterns can reveal important information. Patterns like triangles, head and shoulders, and double bottoms can indicate potential price reversals or continuations. By recognizing these patterns, traders can make educated decisions about market sentiment.
Indicators, such as the Relative Strength Index (RSI) and Moving Average Convergence Divergence (MACD), provide further insights. The RSI measures the strength and speed of price movements, indicating overbought or oversold conditions. The MACD helps identify changes in momentum and potential trend reversals.
It's important to note that while technical analysis tools can be highly useful, they are not foolproof. It's essential to combine them with other factors, such as market news and fundamental analysis, to make well-rounded trading decisions.
In conclusion, incorporating technical analysis tools into your ETH trading strategy can significantly enhance your trading skills. Moving averages, support and resistance levels, chart patterns, and indicators all offer valuable insights into market trends. By understanding and utilizing these tools effectively, you can increase your chances of success in the dynamic world of ETH trading.
-
 Create
account -
 Build trading strategies
with no code -
 Validate
& Backtest -
 Connect exchange
& start earning
Frequently Asked Questions
There are several effective automated trading strategies for crypto. One commonly used strategy is trend following, where the algorithm identifies and trades with the prevailing trend. Another approach is mean reversion, where the algorithm identifies price deviations and trades when prices revert to their average. Breakout strategies involve trading when prices break through key support or resistance levels. Additionally, arbitrage strategies take advantage of price discrepancies between different exchanges. Finally, sentiment analysis strategies utilize algorithms to analyze social media and news sentiment to make trading decisions. Ultimately, the best strategy depends on various factors and requires continuous optimization.
To discover new and profitable strategies in crypto trading, you can follow these steps. First, study and understand different trading indicators and technical analysis tools. Next, evaluate historical price data to identify patterns or trends. Use backtesting to test your strategies on past data. Consider utilizing trading bots and algorithms to automate your strategies. Stay updated with industry news and market trends to identify potential opportunities. Additionally, joining crypto trading communities or forums can provide valuable insights and strategies shared by experienced traders. Remember, continuous learning and adaptation are crucial for discovering successful strategies in the dynamic crypto market.
Smart contracts have various potential uses. One common use is for financial transactions, such as automating payment transfers or creating decentralized lending platforms. They can also be used for supply chain management, ensuring transparency and traceability. Smart contracts can enable decentralized governance systems, allowing stakeholders to make decisions collectively. They can facilitate the creation of decentralized applications (DApps) by providing a secure and efficient framework. Additionally, smart contracts have the potential to revolutionize the field of identity verification and authentication, providing individuals with control over their digital identities. Overall, smart contracts have wide-ranging applications across different industries.
If you have $100 to trade cryptocurrency daily, follow these steps: First, choose a reputable cryptocurrency exchange. Conduct research and study the market to understand price trends. Create a trading plan with clear entry and exit strategies. Start by investing a small portion of your funds and gradually increase as you gain experience. Consider trading popular and high-volume cryptocurrencies to optimize liquidity. Use stop-loss orders to limit potential losses. Keep emotions in check and stick to your trading plan. Continuously educate yourself about market developments and adjust your strategies accordingly. Always remember to only invest what you can afford to lose.
To improve your crypto trading strategies, follow these steps. Firstly, keep a trading journal to track your trades and analyze their outcomes. Review your journal regularly to identify patterns and areas for improvement. Stay updated with market news and analysis to make informed trading decisions. Continuously educate yourself about different strategies and indicators. Utilize backtesting to evaluate the performance of your strategies on historical data. Consider diversifying your portfolio to manage risk. Practice disciplined risk management by setting stop-loss orders. Lastly, learn from your mistakes and adapt your strategies accordingly to continually improve your trading skills.
Conclusion
In conclusion, developing and implementing effective trading strategies for Ethereum (ETH) can lead to profitable outcomes in the crypto market. By combining technical analysis tools, practicing risk management, and customizing your approach, you can navigate the dynamic world of ETH trading with confidence. Remember to stay informed about market trends, continuously evaluate your strategies, and adapt as needed. Whether you are a beginner or an experienced trader, the key is to remain disciplined, patient, and open to learning from both successes and failures. With dedication and sound strategies, you can increase your chances of trading ETH successfully. Happy trading!

Successful traders rely on backtesting to be profitable.
Be like them with our
Free Backtesting Guide