-
 Create
account -
 Build trading strategies
with no code -
 Validate
& Backtest -
 Automate
& start earning
Automated Strategies & Backtesting results using RSI
Discover below a selection of trading strategies based on the RSI indicator and how they have performed in backtesting. You can test all these strategies (and many more) for free on thousands of assets, using their complete historical data.
Automated Trading Strategy: Ride the RSI Trend with VWAP and Engulfing Candles on KCS
The backtesting results for the trading strategy from October 24, 2022, to October 24, 2023, show promising statistics. The profit factor stands at 1.44, indicating a positive outcome for the strategy. The annualized return on investment (ROI) is 4.41%, which suggests a steady growth over the year. On average, positions were held for 21 hours, and there were approximately 0.23 trades per week. A total of 12 trades were closed during this period. The winning trades percentage is 25%, representing a lower success rate. However, the strategy outperformed the buy and hold approach, generating excess returns of 115.87%. Overall, the strategy displayed potential for profitability.
Choose another period and try again.
Automated Trading Strategy: Ride the SuperTrend with RSI and Shadows on BBUC
Based on the backtesting results for a trading strategy spanning from November 5, 2022, to November 5, 2023, several key statistics emerged. The strategy demonstrated a profit factor of 1.49, indicating its ability to generate returns in proportion to the losses incurred. The annualized return on investment (ROI) stood at 4.44%, showcasing the strategy's profitability over the analyzed period. On average, positions were held for approximately 1 week and 5 days, with a frequency of 0.15 trades per week. It is noteworthy that a total of 8 trades were closed during this period. The strategy's winning trades made up 25% of the total, highlighting potential areas for improvement. Interestingly, the backtest results revealed that the strategy outperformed the traditional buy and hold approach, generating excess returns of 40.32%.
Choose another period and try again.
Understanding the RSI Indicator
The Relative Strength Index (RSI) is a momentum oscillator developed by J. Welles Wilder in 1978. It measures the speed and change of price movements, helping traders identify overbought or oversold conditions in a market. The RSI is a valuable tool for assessing the strength of a trend and spotting potential reversal points.
Theory Behind RSI
The RSI operates on a scale of 0 to 100 and is typically set to a 14-bar period, although traders can adjust this setting to suit their trading style. The formula for calculating the RSI is as follows:

Where: RS (Relative Strength) = Average gain of up periods over the specified time frame / Average loss of down periods over the specified time frame.
Key Levels and Interpretations
- Overbought Condition: When the RSI rises above 70, it indicates that the asset may be overbought, and a reversal or pullback could be imminent.
- Oversold Condition: When the RSI falls below 30, it suggests that the asset may be oversold, potentially leading to a reversal or a bounce.
Chart Example: Identifying Overbought and Oversold Conditions
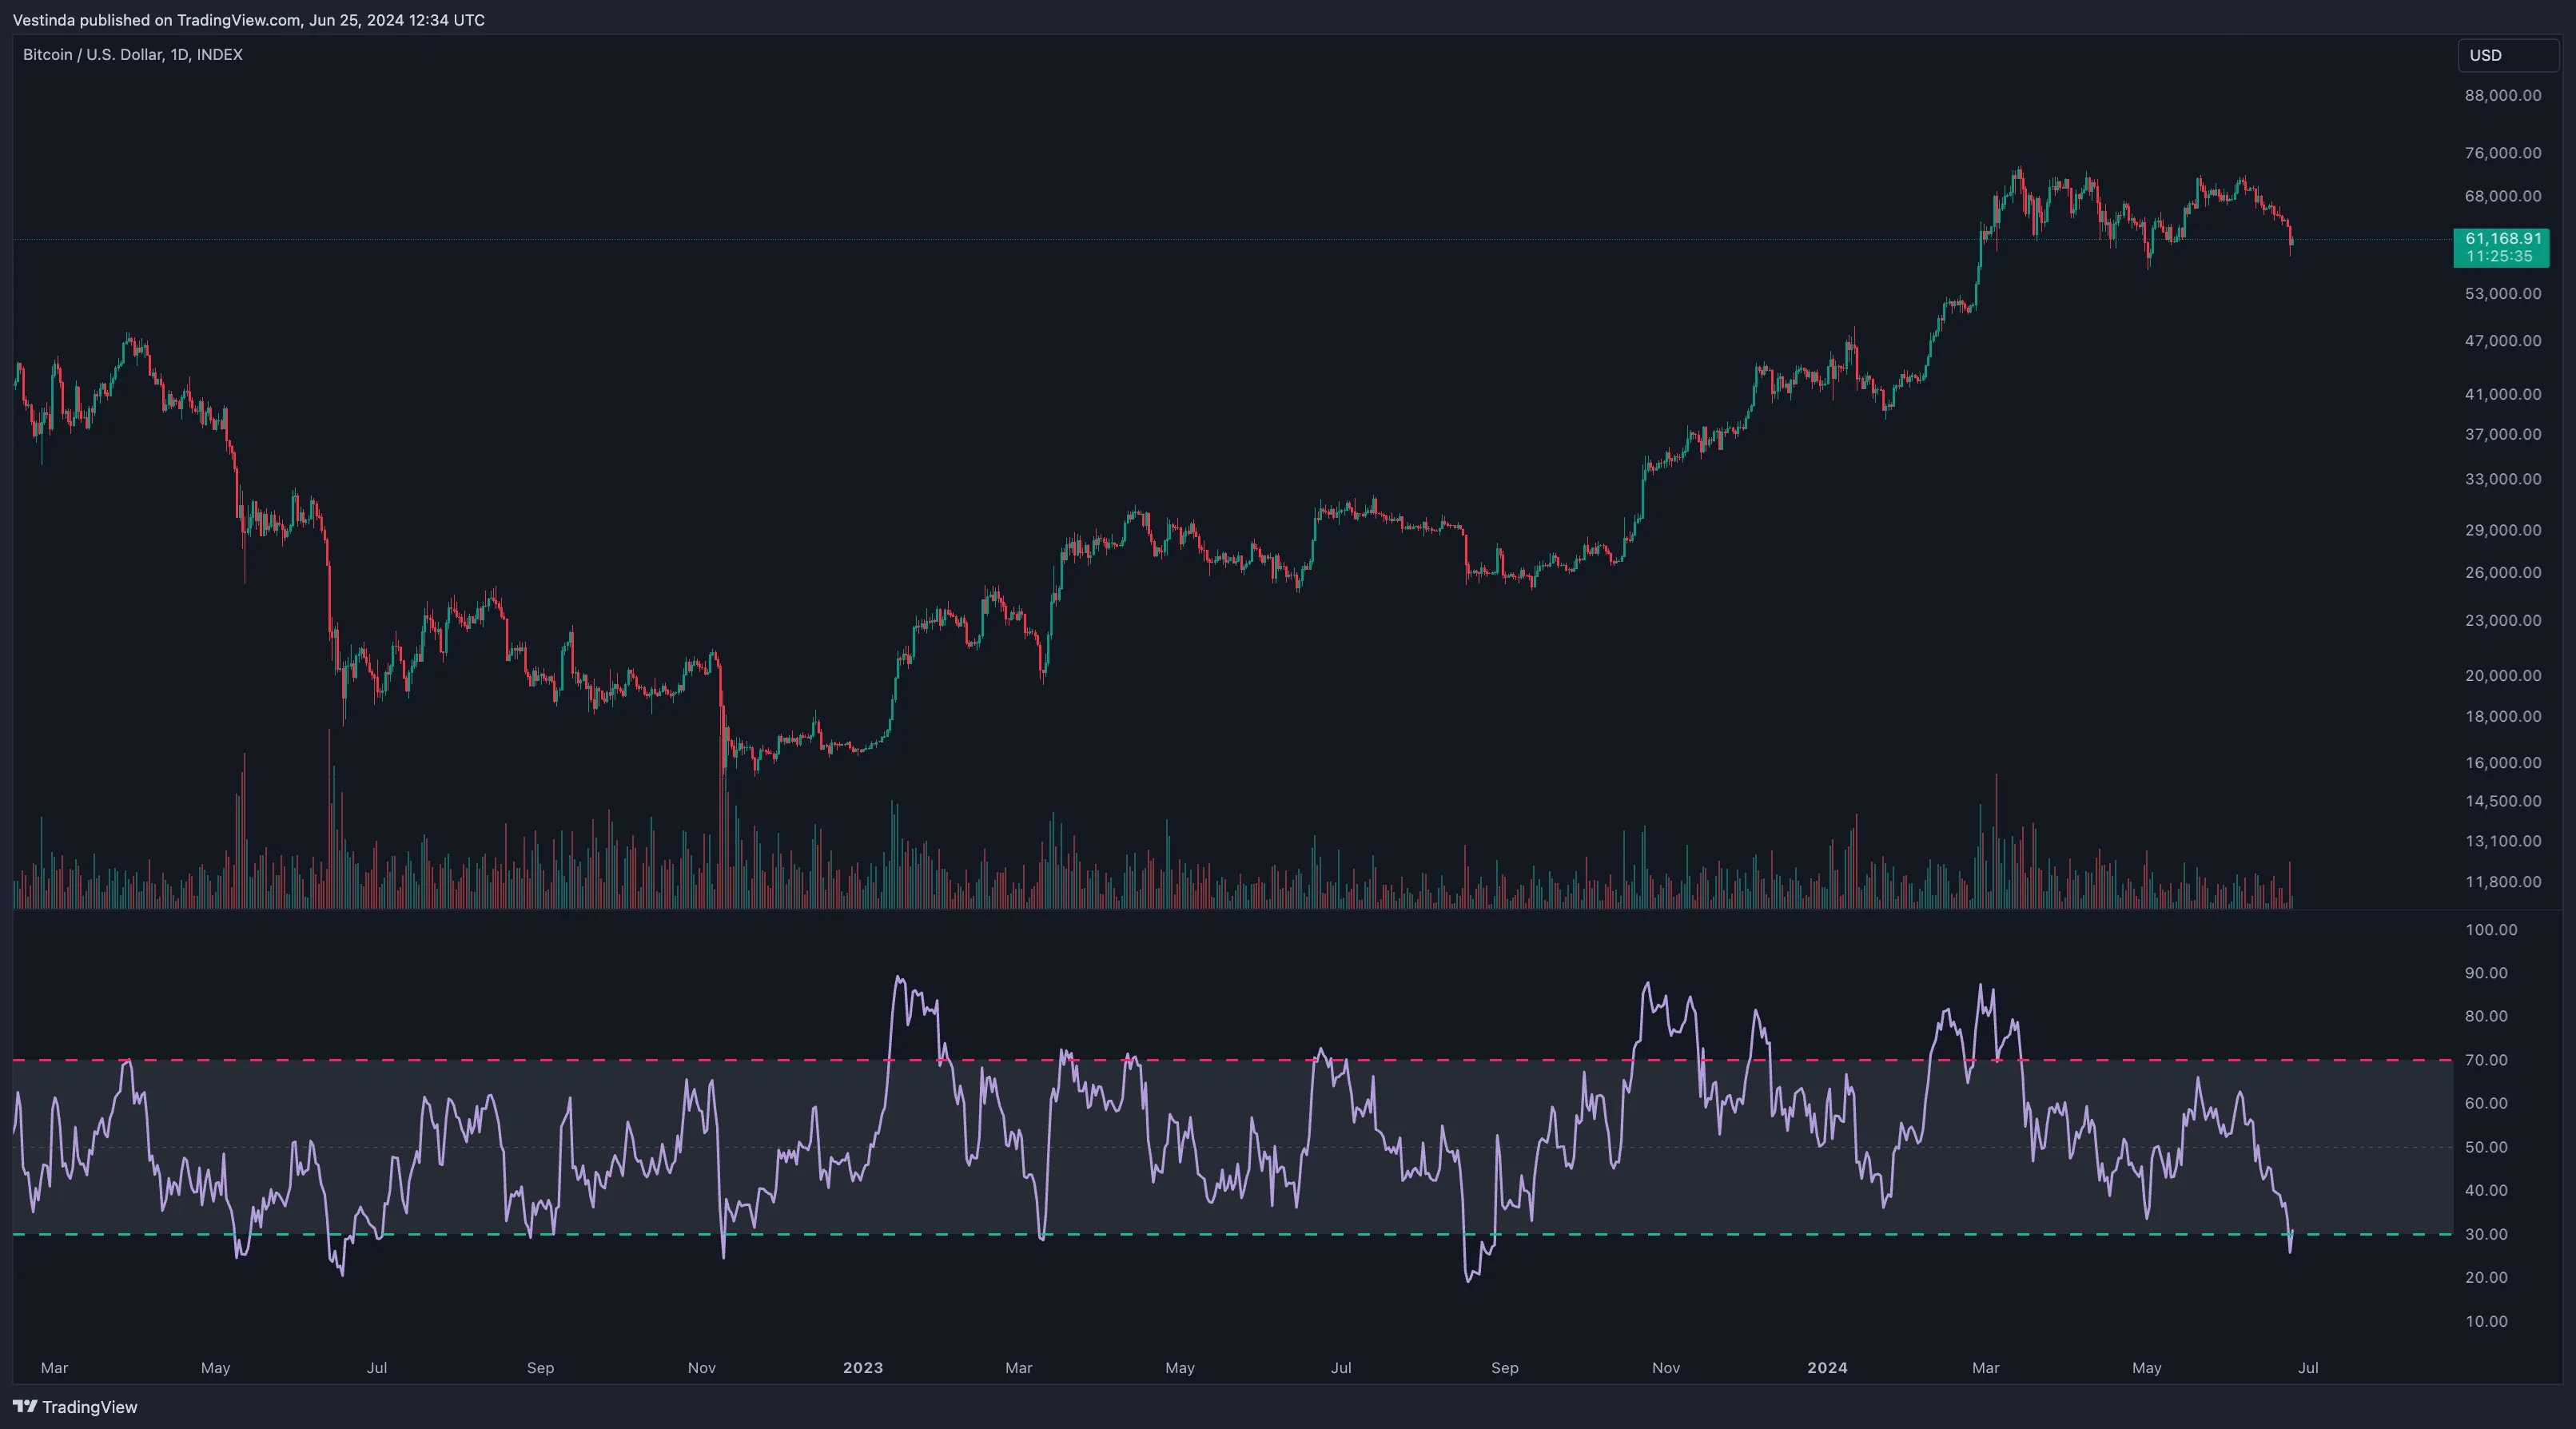
The chart above shows an asset's price movement with the RSI indicator below it. The red line at the 70 level marks the overbought condition, while the green line at the 30 level marks the oversold condition. Notice how the price reacts when the RSI crosses these levels.
RSI Divergence: A Powerful Indicator
Divergence occurs when the price action and the RSI indicator move in opposite directions. This can signal potential reversals or continuation of trends.
Bullish Divergence
Occurs when the price hits a new low, but the RSI forms a higher low. This suggests that the downward momentum is weakening, and a reversal to the upside may be imminent.

In the chart, the price makes a lower low while the RSI makes a higher low, indicating a bullish divergence. This suggests a potential upward reversal.
Bearish Divergence
Happens when the price hits a new high, but the RSI forms a lower high. This indicates that the upward momentum is losing strength, and a reversal to the downside could occur.

In this chart, the price makes a higher high while the RSI makes a lower high, indicating a bearish divergence, suggesting a potential downward reversal.
RSI Strategies for Trading
1. RSI Swing Trading Strategy
This strategy focuses on buying when the RSI is in the oversold zone (below 30) and selling when it is in the overbought zone (above 70). It is best used in markets with clear trends.
Steps:
- Identify the trend direction using a longer-term moving average.
- Enter a long position when the RSI crosses above 30 after being in the oversold region.
- Exit or short when the RSI crosses below 70 after being in the overbought region.

The chart illustrates a swing trading strategy where the RSI crosses above 30 (buy signal) and crosses below 70 (sell signal).
2. RSI Pullback Strategy
This strategy capitalizes on the pullbacks within a strong trend. Traders buy when the RSI dips into the oversold territory and then reverses back above 30, confirming the trend’s continuation.
Steps:
- Confirm the trend using a higher timeframe trend indicator.
- Wait for the RSI to drop below 30, then look for a bullish reversal pattern (e.g., a hammer candle or engulfing pattern).
- Enter a trade when the RSI crosses back above 30, signaling a continuation of the trend.
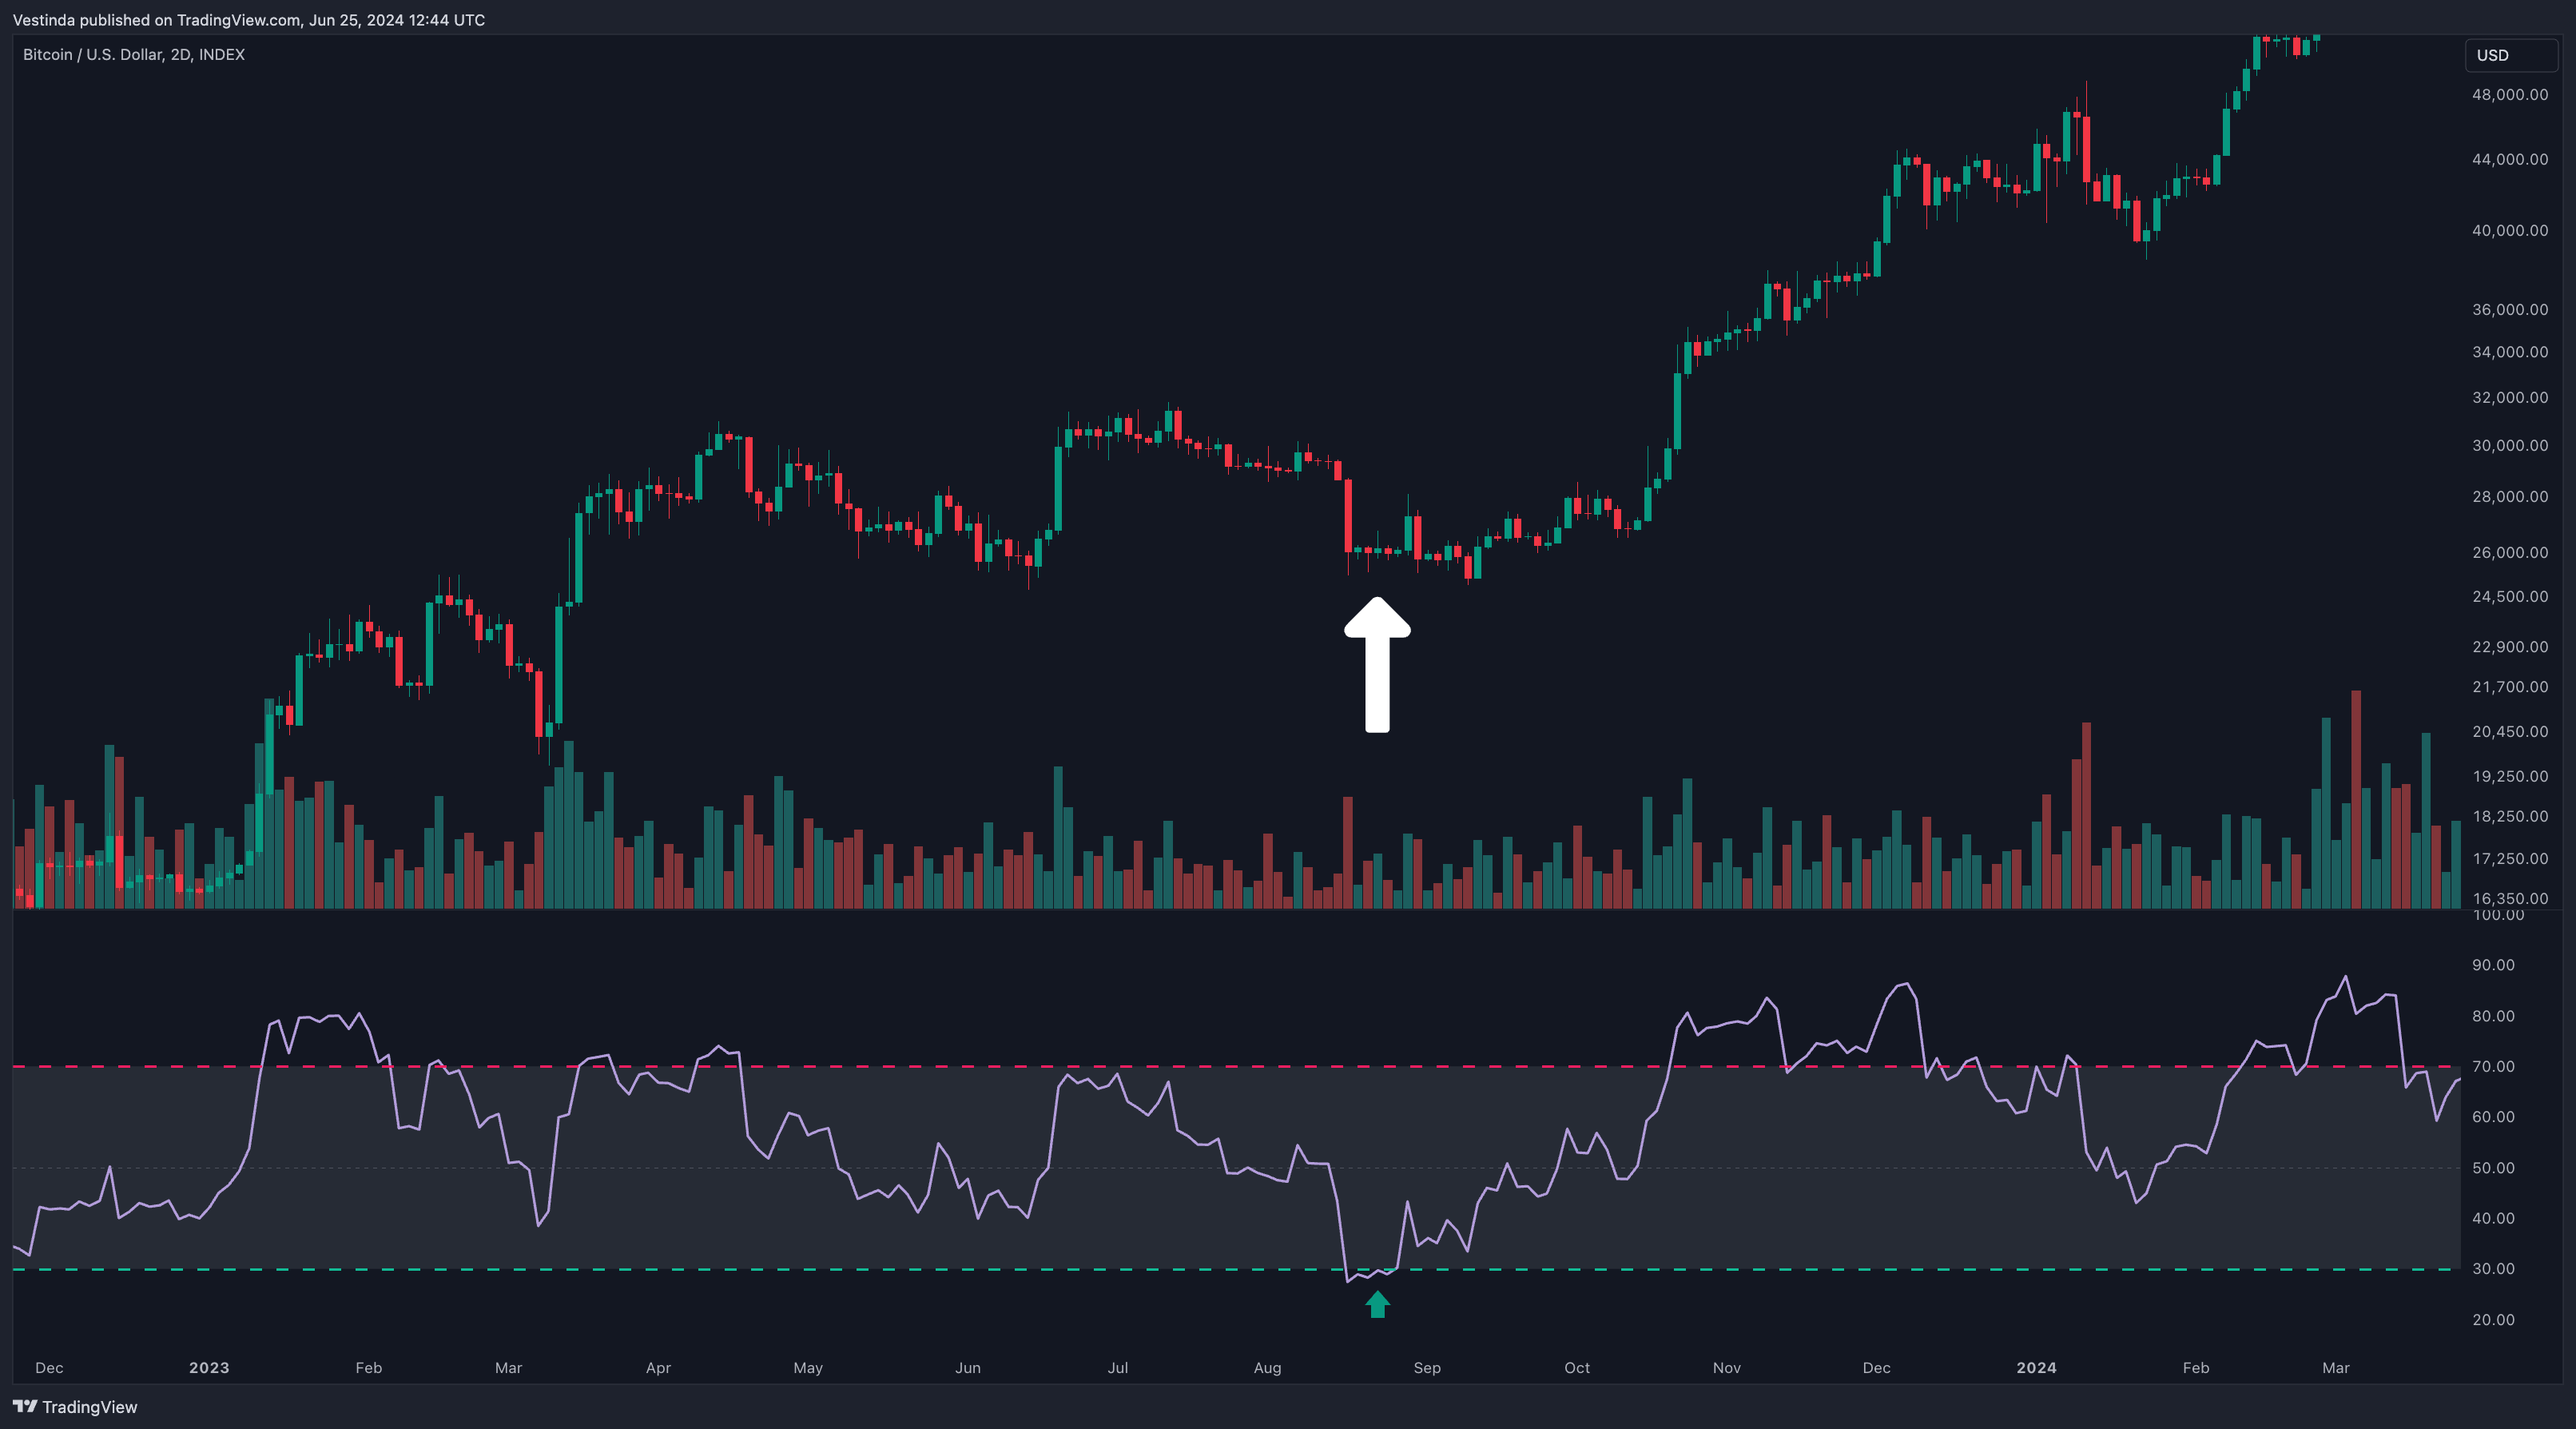
The chart shows a pullback strategy where the RSI dips below 30 and then crosses back above, indicating a buy signal in a continuing uptrend.
Intraday and Day Trading Techniques with RSI
It helps measure the speed and change of price movements. Traders use it to identify overbought and oversold conditions in the market. RSI ranges from 0 to 100, with readings above 70 indicating an overbought condition and readings below 30 indicating an oversold condition. Traders can use RSI to generate buy or sell signals. For intraday trading, traders can use shorter RSI periods (e.g., 9 or 14) to identify short-term price reversals. Day traders can look for divergence between RSI and price action to spot potential trend reversals. However, it is important to note that RSI should not be used in isolation but in conjunction with other technical indicators or analysis methods to confirm trading decisions.
Optimal RSI Settings for Effective Day Trading
It is used to determine overbought and oversold conditions in the market. The RSI indicator is a popular tool among day traders because it can provide valuable insights into market momentum. When it comes to choosing the best settings for day trading strategies, it is important to find a balance between responsiveness and accuracy. A shorter period, such as 9 or 14, can provide more timely signals but may be prone to false alarms. On the other hand, a longer period, like 25 or 30, can filter out noise and generate more reliable signals, but it may lag behind price action. Ultimately, the best settings for RSI will depend on the trader's specific trading style, time frame, and the asset being traded. It is advisable to experiment with different settings and adjust them based on individual preferences and market conditions.
RSI: A Powerful Tool for Forex Traders
It was developed by J. Welles Wilder Jr. and is used to measure the strength and speed of price movements in a market. Traders in the forex market can use RSI to identify overbought and oversold conditions. When the RSI is above 70, it is considered overbought, indicating that the price may soon reverse. Conversely, when the RSI is below 30, it is considered oversold, suggesting that the price may soon rise. Traders can use these signals to enter or exit positions, depending on their trading strategy. However, it is important to note that RSI is just one tool among many and should be used in conjunction with other indicators and analysis techniques for more accurate trading decisions.
-
100,000 available assets New
-
years of historical data
-
practice without risking money

Frequently Asked Questions
Traders should consider using a combination of charts to gain a comprehensive understanding of the market. Candlestick charts are popular as they provide valuable information on price action, giving insights into market sentiment. Line charts are useful for identifying long-term trends. Bar charts offer a visual representation of price movements. Additionally, traders should also utilize technical indicators alongside these charts to further enhance their analysis. Ultimately, the most effective chart for traders depends on individual preferences, strategies, and the specific market being traded.
The RSI formula, which stands for Relative Strength Index, is a popular technical analysis tool used in stock market analysis. The formula calculates the ratio of average gains to average losses over a specified period, typically 14 days. It measures the strength and speed of price movements and indicates whether a stock is overbought or oversold. The RSI formula is as follows: RSI = 100 - (100 / (1 + RS)), where RS (Relative Strength) is calculated as the average gain over the specified period divided by the average loss. RSI values range from 0 to 100, with readings above 70 suggesting overbought conditions and below 30 indicating oversold conditions.
No, RSI (Relative Strength Index) does not directly measure volatility. RSI is a momentum oscillator that measures the speed and change of price movements in a security. It indicates overbought and oversold levels of an asset. Volatility, on the other hand, measures the range and rate at which the price of an asset fluctuates over a specific period. While RSI can indirectly reflect changes in volatility as it measures the strength of price movements, it does not provide a direct measurement of volatility itself.
To backtest the Relative Strength Index (RSI), follow these steps. First, collect historical price data of the asset being analyzed. Next, calculate RSI values using the RSI formula for each data point. Establish RSI threshold levels (typically 30 and 70) to define overbought and oversold conditions. Utilize these thresholds to generate buy/sell signals accordingly. Backtest the strategy on historical data by simulating trades and tracking performance metrics like returns and drawdown. Adjust parameters, thresholds, or other variables based on the results obtained, and repeat the process until an optimal approach is identified.
There is no definitive answer to what the best lagging indicator is, as it depends on the specific context and goals of the analysis. However, some commonly used lagging indicators include moving averages, MACD, Bollinger Bands, and the relative strength index (RSI). These indicators help assess historical price trends and provide insights into market conditions. Ultimately, the best lagging indicator is one that aligns with the specific trading strategy or investment objectives of the individual or organization using it. It is crucial to consider multiple indicators and use them in conjunction with other analysis tools to make well-informed decisions.
The success rate of the Relative Strength Index (RSI) strategy can vary depending on market conditions and individual trading decisions. RSI is a popular technical indicator used to identify overbought and oversold conditions in a security. Its success rate can be influenced by factors such as the time frame of analysis, the asset being traded, and the skill and experience of the trader. While there is no fixed success rate, traders often combine RSI with other indicators and tools to improve the probability of profitable trades. It is essential to thoroughly backtest, refine, and refine the RSI strategy to maximize its effectiveness.
Conclusion
In conclusion, the RSI indicator is a powerful tool that can greatly enhance your trading strategies. By measuring the speed and change of price movements, it helps identify overbought and oversold conditions in the market, allowing you to pinpoint potential entry and exit points. Incorporating RSI trading strategies into your technical analysis can significantly improve risk management and overall profitability. However, it is essential to remember that RSI should not be used in isolation. It should be utilized in conjunction with other technical indicators and analysis methods to confirm trading decisions and maximize accuracy. Experimentation with different settings and adjustments based on individual preferences and market conditions are advisable.

Successful traders rely on backtesting to be profitable.
Be like them with our
Free Backtesting Guide