-
100,000 available assets New
-
years of historical data
-
practice without risking money

Quant Strategies & Backtesting results using OB
Discover below a selection of trading strategies based on the OB indicator and how they have performed in backtesting. You can test all these strategies (and many more) for free on thousands of assets, using their complete historical data.
Quant Trading Strategy: On Balance Volume Continuation with Doji on PORTO
The backtesting results for the trading strategy from November 16, 2021, to October 20, 2023, reveal promising statistics. The strategy indicates a profit factor of 1.24, meaning that for every unit risked, there is a 1.24 times return. The annualized return on investment stands at an impressive 49.71%. On average, trades were held for approximately 2 weeks and 1 day, and the strategy executed an average of 0.28 trades per week. With a total of 29 closed trades, the winning trades percentage is 24.14%. Remarkably, the strategy outperformed the buy-and-hold approach, generating excess returns of 742.79%. These results portray a successful trading strategy.
Choose another period and try again.
Quant Trading Strategy: OBV Reversals with ZLEMA and Candlesticks on POWR
During the period from October 20, 2022 to October 20, 2023, the backtesting results for a trading strategy showed promising statistics. The strategy yielded a profit factor of 1.17, indicating that for every unit of risk taken, it generated a profit of 1.17 units. The annualized return on investment stood at an impressive 23.78%. On average, each trade held for approximately 18 hours and 42 minutes, with an average of 2.66 trades executed per week. The strategy closed a total of 139 trades, with a winning trades percentage of 30.94%. Interestingly, the strategy outperformed the buy and hold approach, generating excess returns of 25.63%.
Choose another period and try again.
Mastering OBV Indicator Trading Strategies for Success
Understanding the On-Balance Volume (OBV) Indicator
The On-Balance Volume (OBV) indicator is a momentum-based technical analysis tool that measures buying and selling pressure as a cumulative indicator that adds volume on up days and subtracts volume on down days.
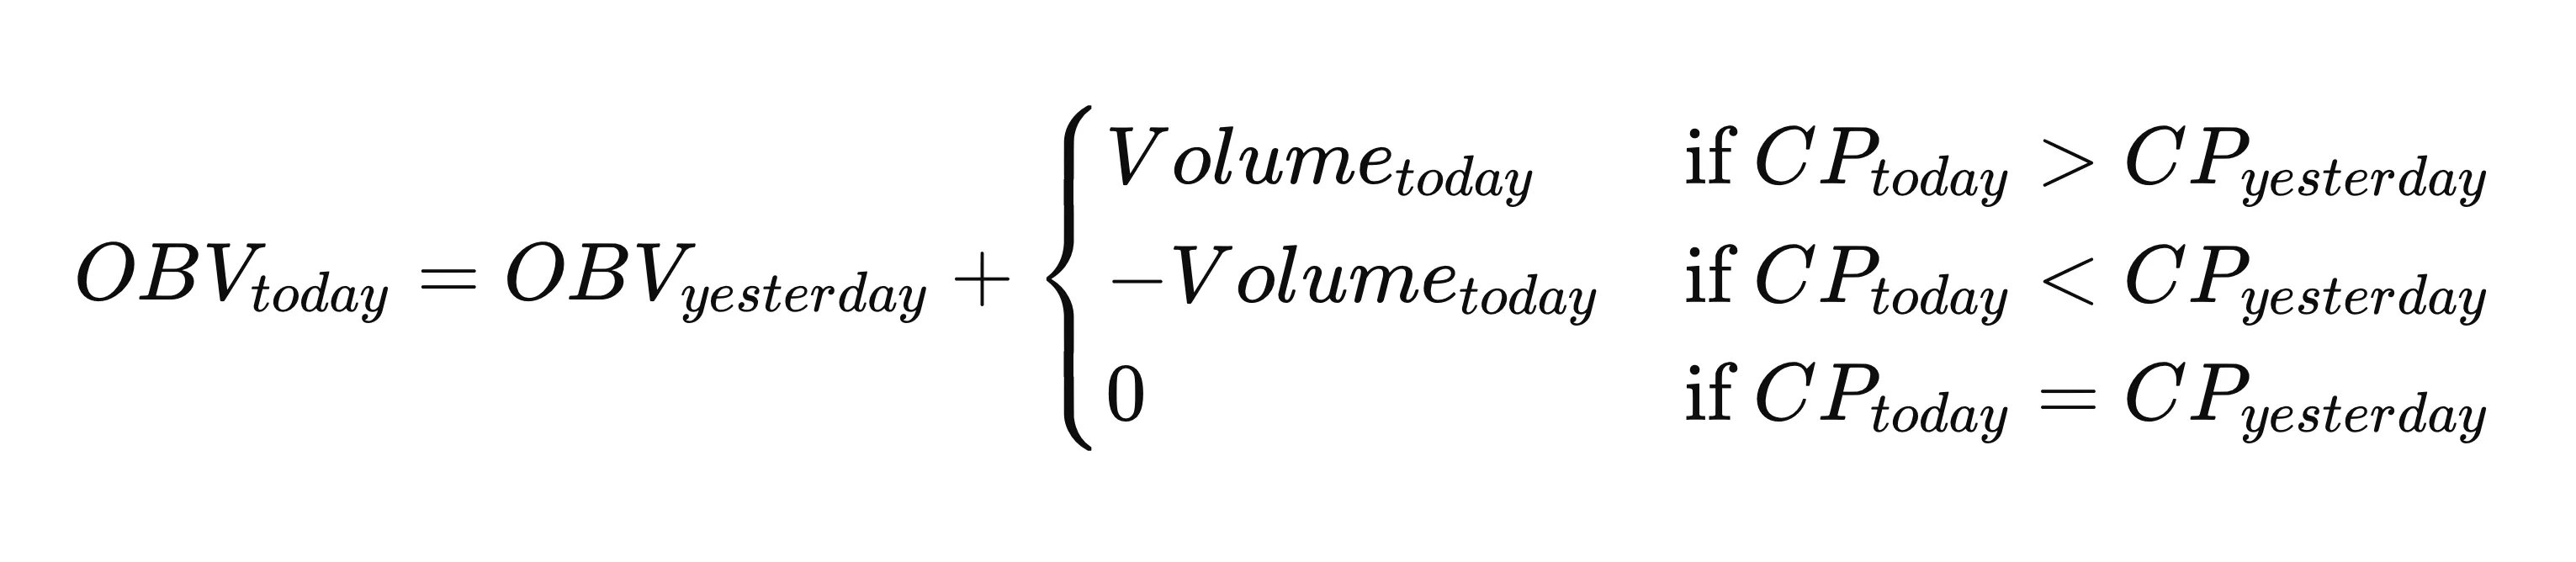
The OBV indicator was developed by Joe Granville and introduced in his 1963 book "Granville's New Key to Stock Market Profits." Granville theorized that when volume increases sharply without a significant change in the stock's price, the price will eventually increase or decrease accordingly.
Why Use the OBV Indicator?
- Volume Insight: OBV provides a unique perspective by incorporating volume into trend analysis, offering early signals of potential reversals or trend continuations.
- Trend Confirmation: OBV is especially effective in confirming the strength of a trend, helping traders avoid false breakouts and stay in profitable trades longer.
- Simple Yet Powerful: Despite its simplicity, OBV is a versatile indicator that can be combined with other tools to create robust trading strategies.
The Theory Behind OBV
The OBV indicator is based on the concept that volume precedes price movement. According to this theory, changes in the OBV indicator reflect investor sentiment, which can be used to predict future price movements. The basic premise is that when the OBV is rising, it indicates that volume is increasing on upward price moves, suggesting strong buying pressure. Conversely, when the OBV is falling, it shows that volume is increasing on downward price moves, indicating strong selling pressure.
Key Points:
- Cumulative Measure: OBV is a running total of volume. Volume is added when the security closes higher than the previous close and subtracted when it closes lower.
- Trend Confirmation: A rising OBV confirms an uptrend, and a falling OBV confirms a downtrend.
- Divergence: OBV can be used to identify divergences, where the indicator and the price move in opposite directions, potentially signaling a reversal.
How to Use OBV in Trading
Using OBV in trading involves looking for confirmations of trends, divergences, and breakouts. Here's how you can incorporate OBV into your trading strategy:
Trend Confirmation:
- When OBV is making higher highs and higher lows along with the price, it confirms the uptrend.
- When OBV is making lower highs and lower lows along with the price, it confirms the downtrend.
Divergence
Bullish Divergence:
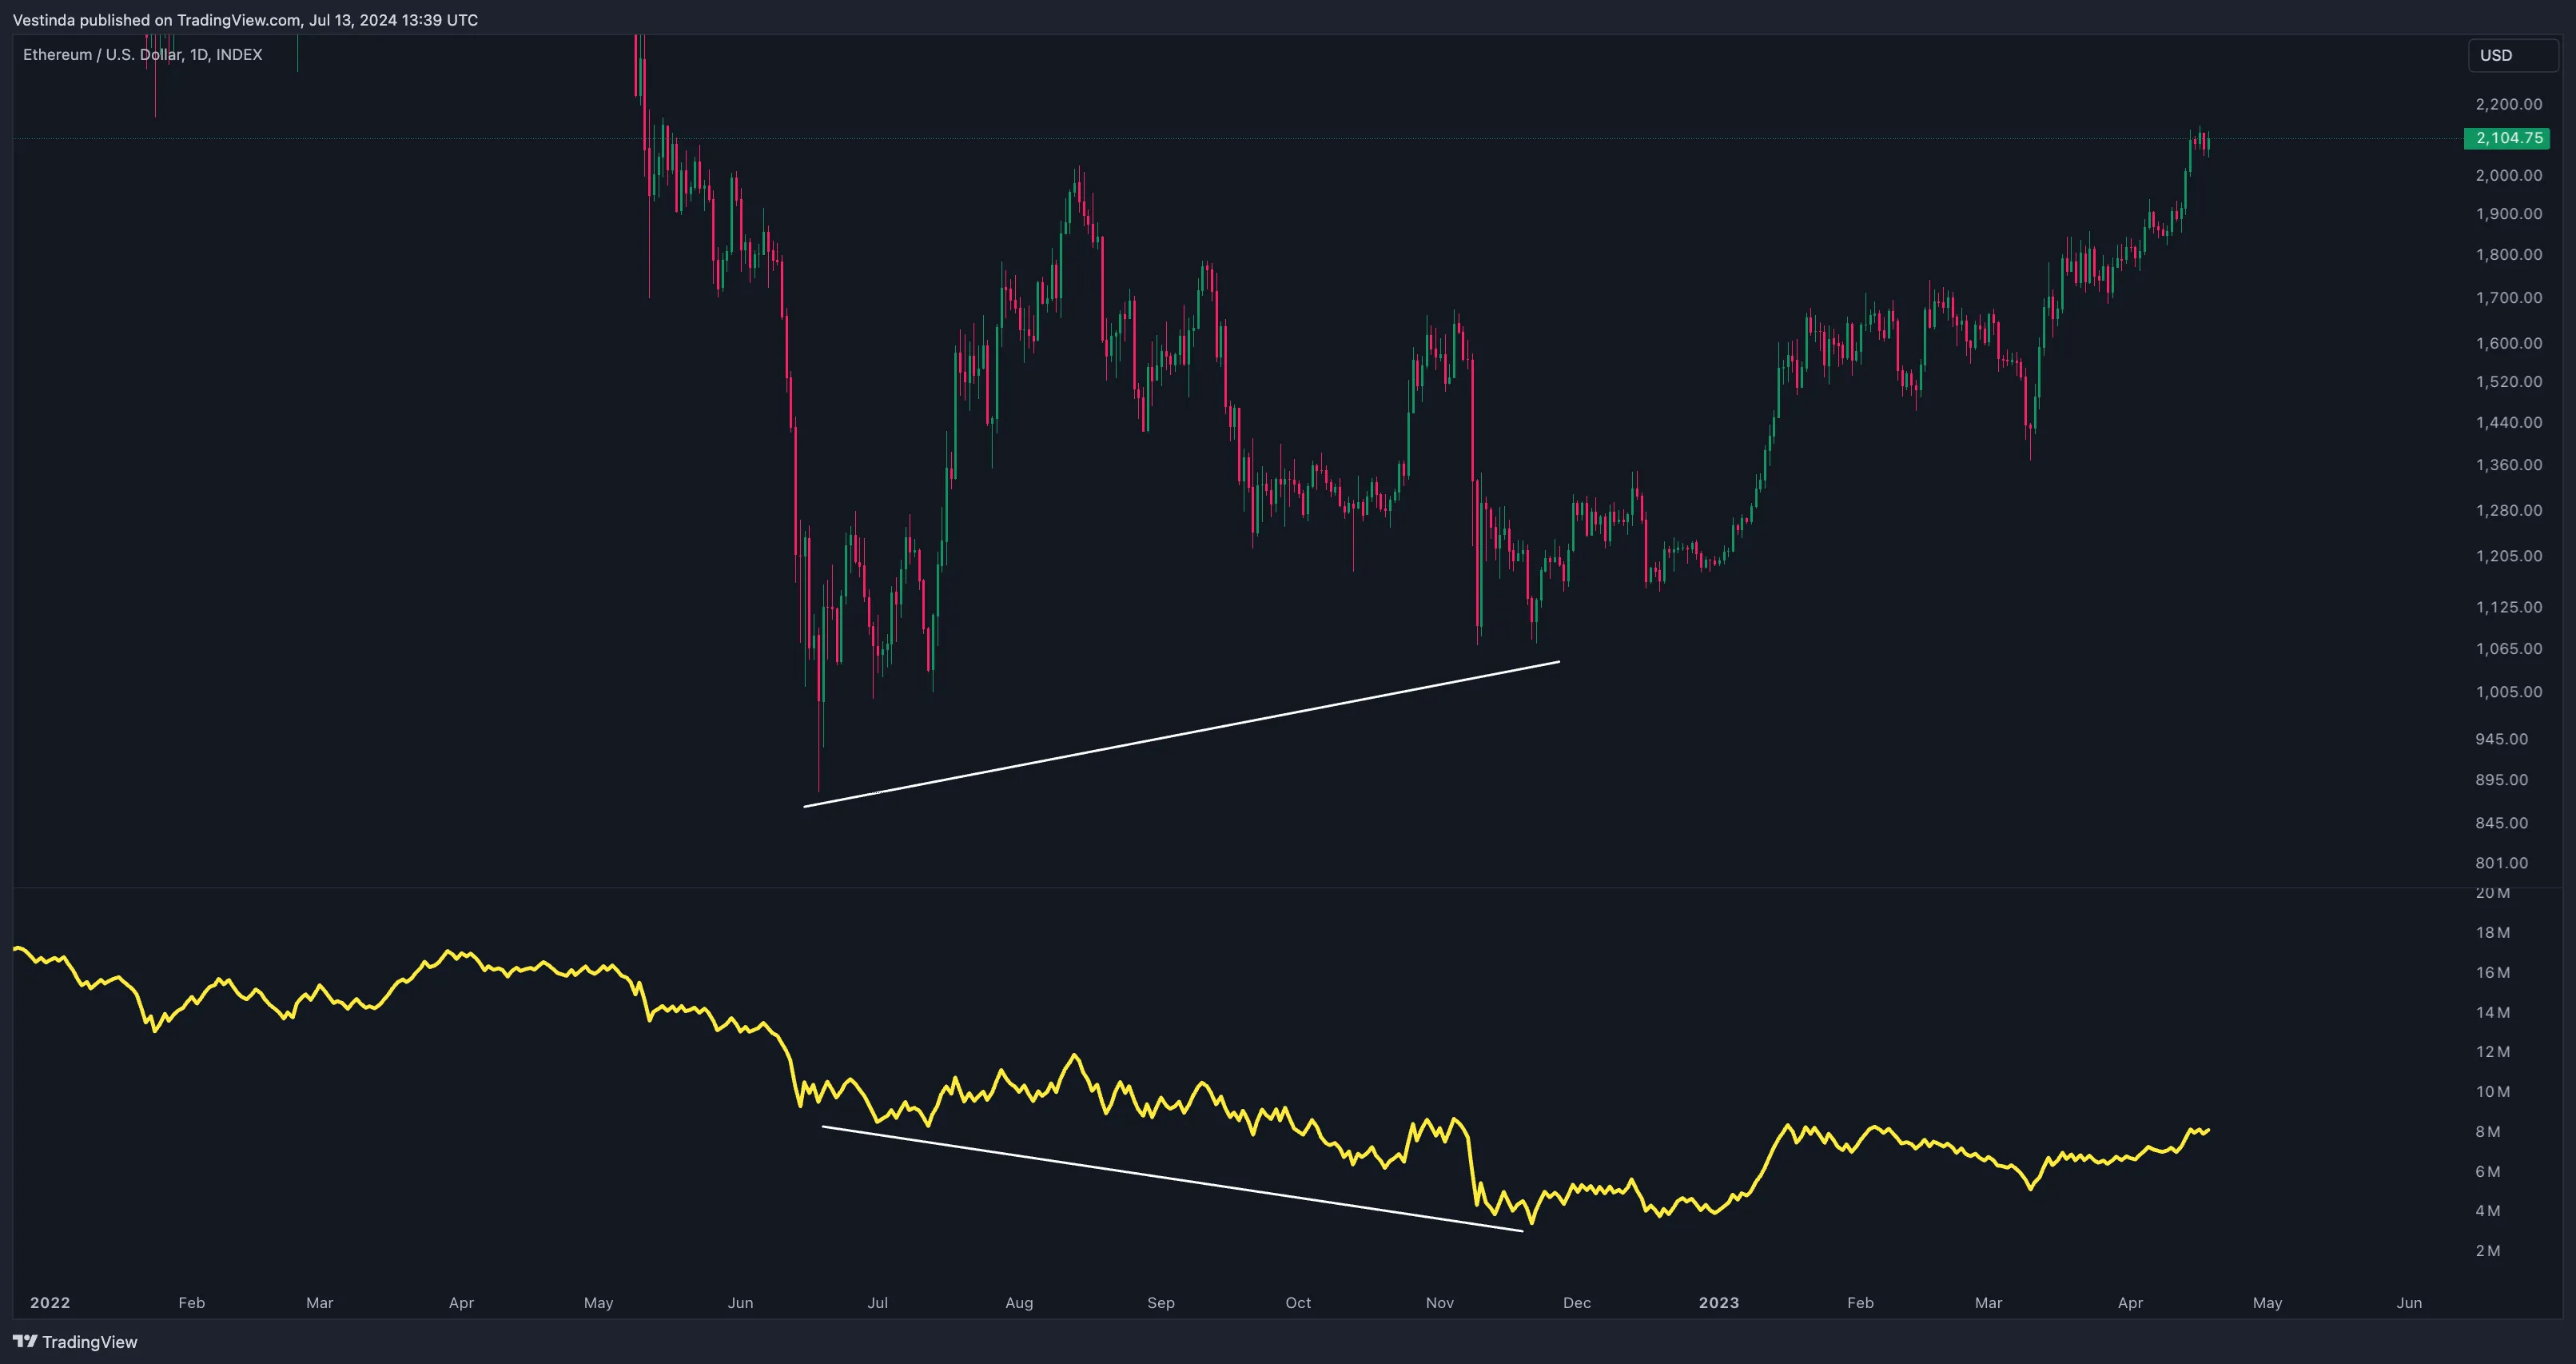
When the price makes a higher low while the OBV makes a lower low, it can actually indicate a bullish divergence. This suggests that, despite the price showing some weakness by making a higher low (but not a higher high), the overall volume trend is increasing on down days, potentially signaling that there is accumulation happening.
Bearish Divergence:
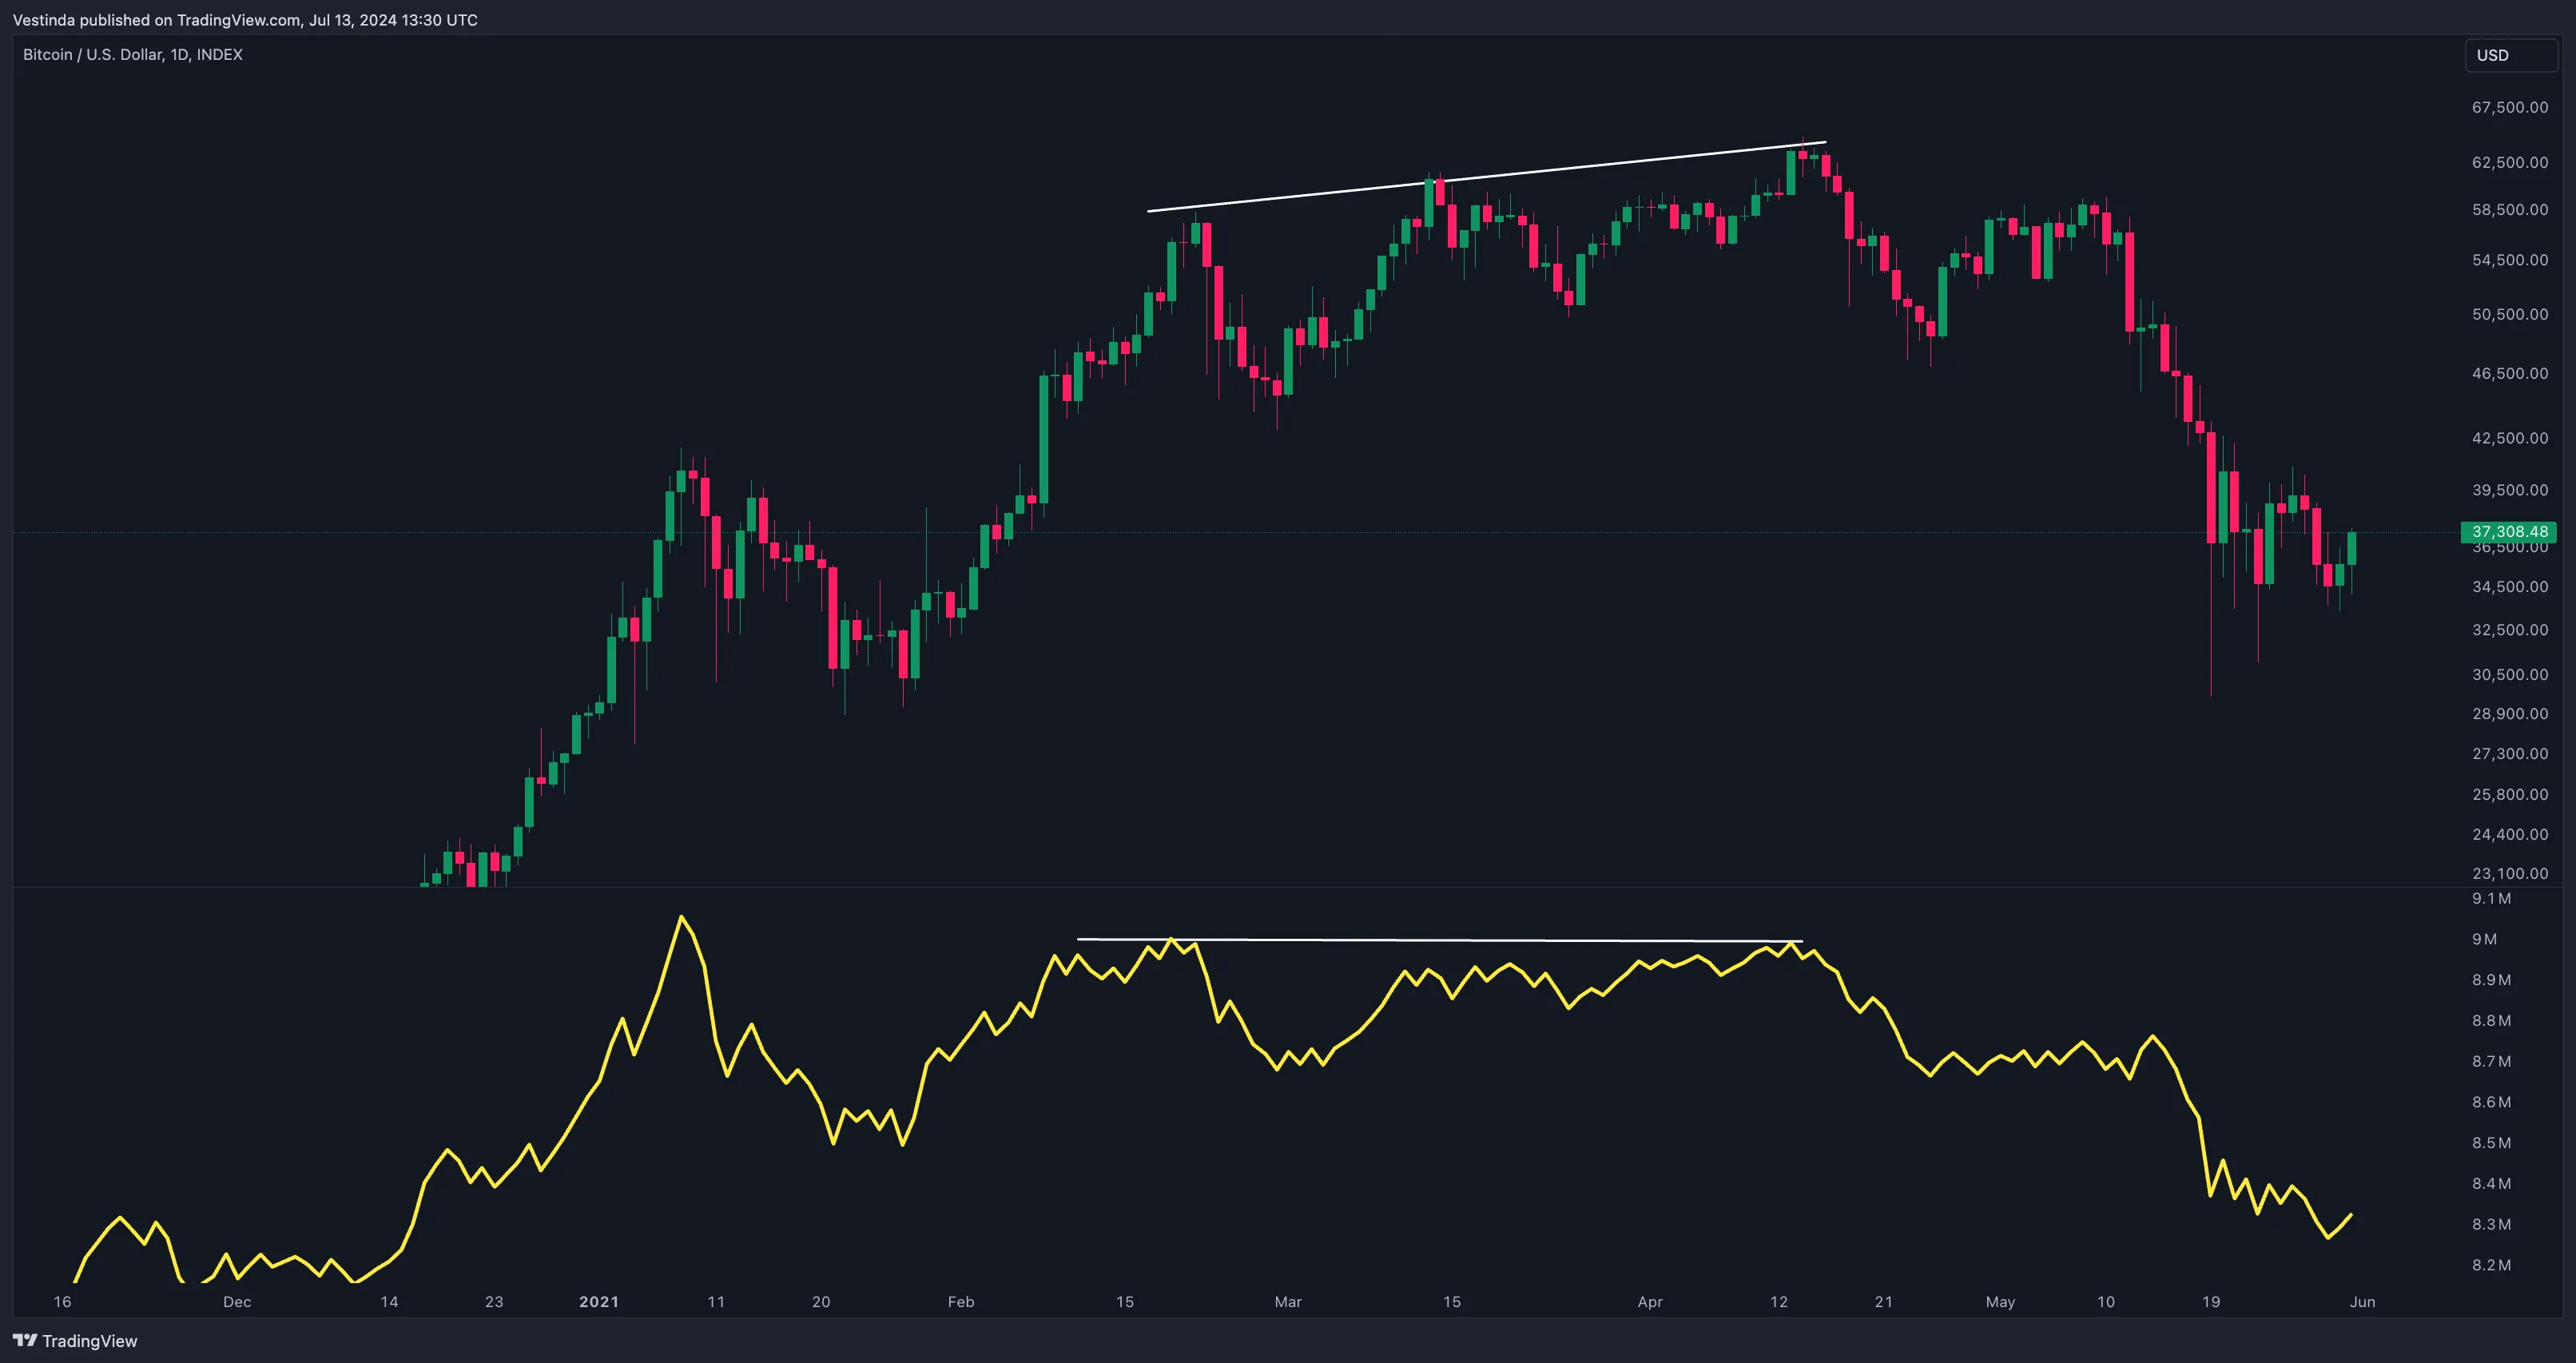
Occurs when the price makes a higher high while OBV makes a lower high. This suggests that despite the price rising, there is selling pressure, potentially signaling an upcoming downward reversal.
Breakouts:
Volume spikes can indicate the strength of a price breakout. A breakout accompanied by a significant change in OBV can signal the continuation of the new trend.
Tools and Indicators for Successful OBV Trading:
Timeframes:
- Why: OBV can be applied across various timeframes, but it's particularly effective on daily and weekly charts for identifying longer-term trends.
- How to Use: Apply OBV to your preferred timeframe, whether you’re trading intraday, swing trading, or focusing on long-term positions.
Volume Analysis:
- Why: Volume is the core component of OBV, so understanding how volume behaves in relation to price is crucial.
- How to Use: Monitor volume spikes and trends in conjunction with OBV to validate the strength of the price movement.
Chart Patterns:
- Why: Combining OBV with chart patterns like triangles, rectangles, or head and shoulders can improve the accuracy of your trading signals.
- How to Use: Look for OBV confirmation when price breaks out of a chart pattern to increase the likelihood of a successful trade.
Risk Management for OBV Trading:
Position Sizing:
- Concept: Use appropriate position sizing to manage risk, particularly when trading on OBV signals, which may sometimes provide early entry points.
- How to Implement: Calculate your position size based on the distance to your stop-loss and your overall risk tolerance, typically risking no more than 1-2% of your trading capital per trade.
Stop-Loss Orders:
- Concept: Protect your capital by placing stop-loss orders to limit potential losses.
- How to Implement: Set stop-loss levels below recent support (for long positions) or above recent resistance (for short positions) based on OBV signals.
Take-Profit Orders:
- Concept: Lock in profits by using take-profit orders when price targets are reached.
- How to Implement: Place take-profit orders at significant support or resistance levels, or use a trailing stop to capture more of the trend while protecting your gains.
Mastering OBV: Trading Tactics and Strategies
It measures the strength of buying and selling pressure in a market. Traders can use the OBV to identify potential trends and reversals in price. To trade with the OBV indicator, start by looking for divergences between the OBV and price movements. A bullish divergence occurs when the OBV is making higher lows while the price is making lower lows. This suggests buying pressure is accumulating and a reversal may be imminent. Conversely, a bearish divergence occurs when the OBV is making lower highs while the price is making higher highs, indicating selling pressure is building up. Another trading strategy is to use trendline breaks. When the OBV breaks a trendline, it can signal a potential change in the market direction. Combined with other technical analysis tools, the OBV can be a valuable asset for traders.
Intraday and Day Trading with OBV Indicator
It is used by intraday and day traders to analyze the volume flow of an asset. The OBV indicator calculates the buying and selling pressure based on the volume. Intraday traders can use OBV to identify potential price reversals or confirm trends. It is especially useful when combined with other technical indicators or chart patterns. Day traders can use OBV to spot divergences between the price and the volume, which can signal a potential trend reversal. The OBV indicator can also be used to confirm breakouts or breakdowns in price. Overall, OBV is a valuable tool for intraday and day traders looking to make informed trading decisions based on volume analysis.
Swing Trading with OBV Power
It is commonly used by swing traders to identify potential trend reversals. OBV measures the cumulative buying and selling pressure in a stock or market. When the OBV line is rising, it indicates that buying volume is outpacing selling volume, suggesting a potentially bullish trend. Conversely, when the OBV line is falling, it suggests selling volume is dominating, indicating a potentially bearish trend. Swing traders can use the OBV indicator to confirm the strength of a trend or to spot potential divergences between OBV and price movements, which could signal a trend reversal or weakening momentum. By incorporating OBV into their swing trading strategy, traders can gain valuable insights into the market's overall buying and selling pressure.
Boosting Trading Success with OBV Indicator
It is used to analyze buying and selling pressure in the market. OBV takes into account the volume of trades to determine the strength of a price movement. One advantage of OBV is that it helps identify trends and confirm price movements. It can be a useful tool for traders and investors looking for confirmation of a trend or reversal in the market. Another advantage of OBV is its simplicity. It is easy to understand and use, making it suitable for beginners in technical analysis. Additionally, OBV can provide early signals of potential price reversals, allowing traders to take advantage of profitable trading opportunities. Overall, the OBV indicator can enhance the accuracy and timing of trades, improving the overall profitability of a trading strategy.
-
 Create
account -
 Build trading strategies
with no code -
 Validate
& Backtest -
 Connect exchange
& start earning
Frequently Asked Questions
The three lagging indicators commonly used in business and economics are Gross Domestic Product (GDP), unemployment rate, and consumer price index (CPI). GDP measures the total value of goods and services produced in a country, reflecting economic growth or decline in the past. Unemployment rate indicates the percentage of the labor force that is jobless and actively seeking employment, providing insights into the past labor market conditions. CPI measures changes in the average prices paid by consumers over time and indicates inflation or deflation trends in an economy. These indicators are referred to as lagging because they reflect what has happened in the past and are slower to respond to immediate changes in the economy.
The Relative Strength Index (RSI) is considered one of the most powerful indicators for forex trading. It measures the speed and change in price movements, indicating whether a currency pair is overbought or oversold. RSI provides valuable insights into potential trend reversals and helps traders identify entry and exit points. However, it is crucial to use the RSI in conjunction with other indicators and analysis techniques to validate signals and confirm trading decisions.
On-Balance Volume (OBV) is a popular technical indicator used by traders to analyze the volume of a stock. OBV can be helpful in confirming stock trends and identifying potential buying or selling signals. It indicates whether the volume is flowing into or out of a stock, providing insights into the strength of a trend. However, it's important to note that no single indicator can guarantee success in the stock market. OBV should be used in conjunction with other indicators and analysis techniques to make informed trading decisions. Ultimately, a comprehensive approach that considers multiple factors is essential for trading success.
The best timeframe for the on-balance volume (OBV) indicator depends on individual trading goals and strategies. Short-term traders may prefer shorter timeframes such as 5 or 15 minutes to capture quick market movements, while swing traders might opt for daily or weekly charts to identify longer-term trends. Longer timeframes, such as monthly charts, are commonly used by investors seeking broad market analysis. Ultimately, the choice of the OBV timeframe should align with a trader's time horizon and trading objectives.
Conclusion
In conclusion, OBV indicator trading strategies have gained popularity among traders who want to incorporate technical analysis into their trading decisions. By tracking volume and comparing it to price movement, traders can identify trends and reversals. The OBV indicator can be used in various trading strategies, from simple trend-following techniques to advanced quant trading and algorithmic strategies. It is a valuable tool for intraday, day, and swing traders, providing insights into buying and selling pressure and confirming trends. Incorporating OBV into a trading strategy can enhance accuracy and timing, improving overall profitability. Risk management is crucial when utilizing the OBV indicator in trading plans.

Successful traders rely on backtesting to be profitable.
Be like them with our
Free Backtesting Guide