Unlock the full potential of Volume Profile Trading with this in-depth guide. Discover how to identify critical levels, analyze market sentiment, and implement winning trading strategies — all illustrated with real-world examples to boost your skills.
What Is Volume Profile?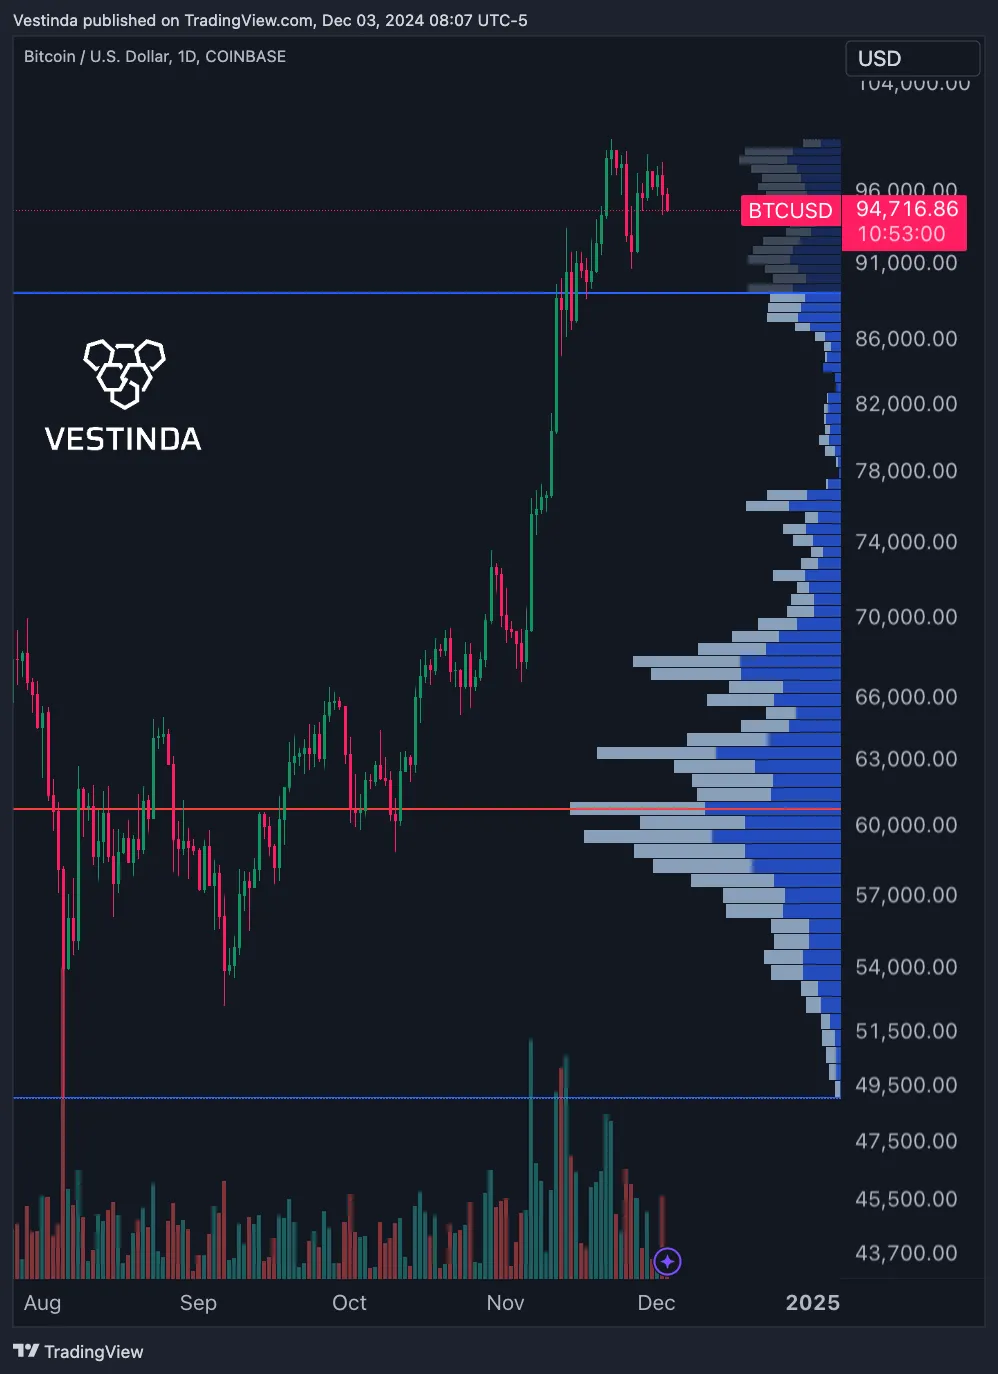

Volume Profile is a sophisticated charting indicator designed to give traders an in-depth understanding of trading activity at various price levels over a specific time period. Unlike traditional volume indicators, which display volume vertically against time, Volume Profile takes a horizontal approach, visually mapping volume against price levels. This unique perspective highlights the areas of highest trading activity, making it easier for traders to pinpoint significant zones of support and resistance.
At its core, Volume Profile serves as a bridge between price action and market sentiment. By showing where the majority of trading occurs, it reveals “fair value” areas where buyers and sellers agree, as well as areas where market interest is minimal. These insights provide a foundation for more informed trading decisions, whether you’re looking for entry points, exit levels, or potential breakout zones.
How It Works
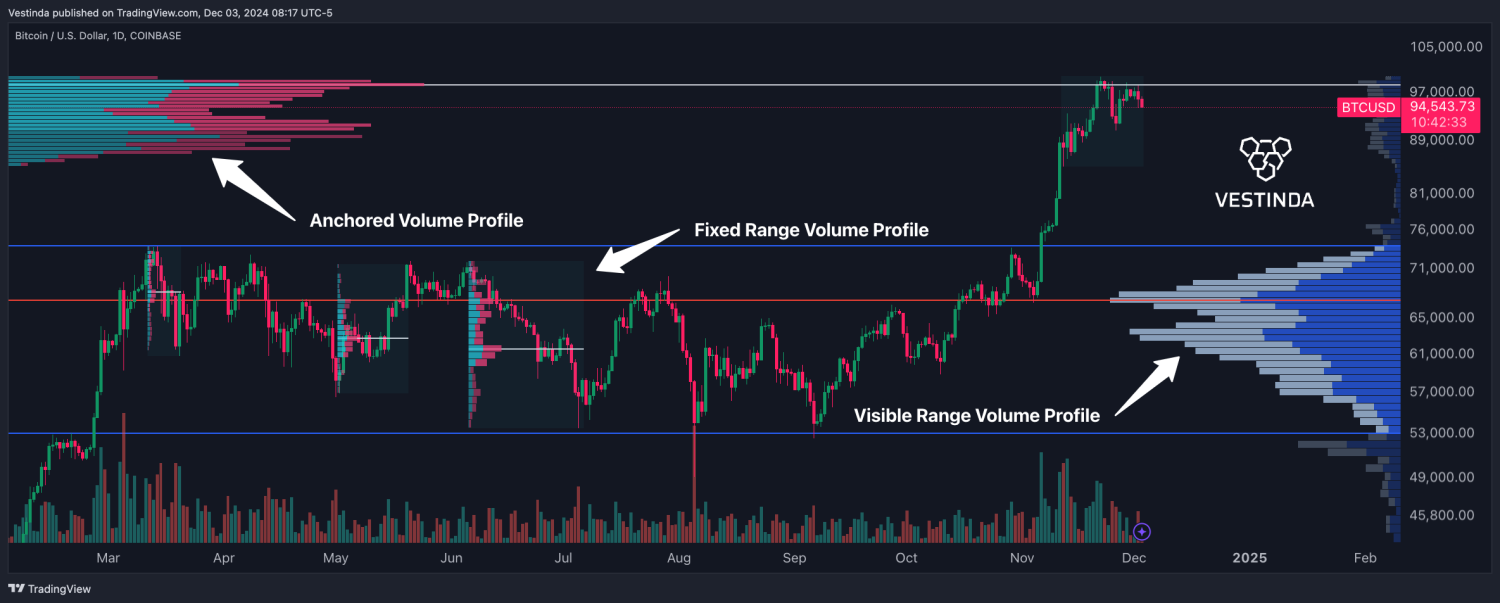
The indicator allows traders to customize parameters such as the number of rows (granularity of the histogram) and the time period for analysis. Based on these settings, it plots a histogram along the price axis of a chart. This histogram reflects the total traded volume at each price level and breaks it down into two distinct categories:
- Up Volume: Represents trades where the price moved upward, indicating bullish activity.
- Down Volume: Represents trades where the price moved downward, indicating bearish activity.
Key Insights for Traders
This breakdown into up and down volume offers a detailed view of market dynamics. For example:
Start earning 60% a year with automated trading Free Sign Up- If a price level shows a high concentration of up volume, it may indicate strong buyer interest, potentially acting as a support level in the future.
- Conversely, a level with significant down volume might signal heavy selling pressure, marking a potential resistance zone.
Why It Matters
By providing a horizontal view of trading activity, Volume Profile allows traders to:
- Identify Dominant Price Levels: These are areas with the highest trading activity, often aligning with key support or resistance zones.
- Anticipate Market Behavior: Understanding where the bulk of trading occurs helps traders forecast price movements, such as pullbacks to high-volume areas or rapid moves through low-volume zones.
- Optimize Entry and Exit Points: By analyzing volume distribution, traders can time their trades to coincide with areas of high market interest, reducing risk and enhancing profitability.
Volume Profile goes beyond simple volume tracking, offering a comprehensive tool for analyzing the interplay between price and trading activity.
Types of Volume Profile
Traders can customize Volume Profile to suit their analysis needs.
 Common types include:
- Auto Anchored Volume Profile: Automatically adjusts to key market structures.
- Fixed Range Volume Profile: Focuses on a specific time and price range selected by the trader.
- Periodic Volume Profile: Analyzes regular intervals, such as daily or weekly sessions.
- Session Volume Profile: Tracks volume data for specific trading sessions.
- Visible Range Volume Profile: Displays volume data for the currently visible chart range.
How Volume Profile Works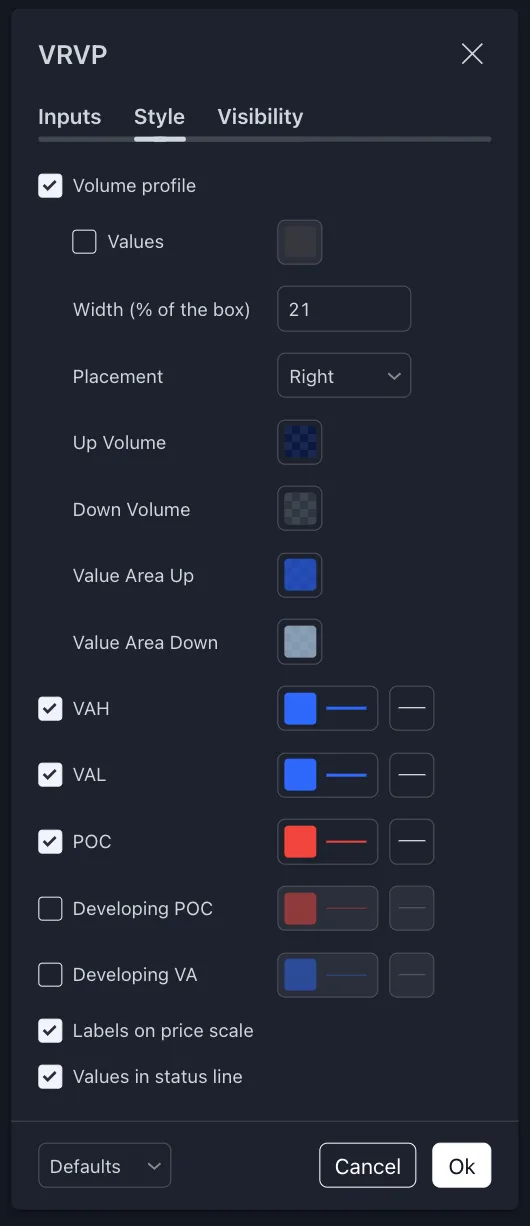

The indicator analyzes lower timeframe data to calculate the volume at each price level:
- Trade Volume for stocks.
- Tick Volume for indices, forex, and crypto CFDs, which measures price updates.
- Base/Quote Volume for crypto, calculated as up or down volume based on bar direction.
Each bar in the histogram reflects the volume traded at a specific price level. For instance, in a 1-minute bar for a daily session:
- If the bar closes above or equal to its open, it counts as Up Volume.
- If it closes below its open, it counts as Down Volume.
This granular calculation creates a highly detailed and visually intuitive profile of market activity by mapping out where the highest and lowest volumes of trades occurred across specific price levels. This level of precision allows traders to identify zones of strong support or resistance, understand the flow of buying and selling pressure, and anticipate potential breakout or retracement points. By analyzing these key price levels, traders can make more informed decisions, align their strategies with market sentiment, and improve the timing of their entries and exits, providing a significant edge in both volatile and stable market conditions.
For additional information, refer to the TradingView guide on VRVP (Visible Range Volume Profile).
Key Components of Volume Profile Trading Analysis
1. Point of Control (POC)
The Point of Control, often abbreviated as POC, is the price level with the highest traded volume within the specified time period. It represents the price at which the most buyers and sellers interacted, indicating a zone of equilibrium.
The POC is significant because it acts as a magnet for price action:
- Prices tend to gravitate toward the POC when they move too far away, reflecting the market’s inclination to return to levels of high activity.
- It can also serve as a pivot point for traders, offering opportunities to enter or exit trades based on the behavior of price around this level.
For example, in a strong uptrend, if the price pulls back to the POC, it often finds support before resuming its upward movement. Similarly, in a downtrend, the POC can act as resistance.
2. Value Area (VA)
 The Value Area is the range of price levels where approximately 70% of all trading volume occurs during a specific time frame. This area reflects the market’s perceived fair value zone, where buyers and sellers are most active and in relative agreement.
The Value Area offers valuable insights:
- Inside the Value Area: Prices tend to consolidate, reflecting balanced market conditions.
- Outside the Value Area: Movement outside this range often signals imbalance, leading to potential breakout opportunities as the market seeks new equilibrium levels.
Traders use the Value Area to identify strategic trading zones. For example, if the price moves above the Value Area High, it could indicate bullish momentum, whereas a drop below the Value Area Low might signal bearish sentiment.
3. Value Area High (VAH) and Low (VAL)
These two levels mark the upper and lower boundaries of the Value Area, representing the extremes of fair value within the 70% volume range:
- Value Area High (VAH): The highest price level within the Value Area. It often acts as a resistance level when prices rise.
- Value Area Low (VAL): The lowest price level within the Value Area. It often acts as a support level when prices fall.
The VAH and VAL are critical for spotting breakout opportunities. For instance:
- A sustained move above the VAH often leads to strong upward momentum, as buyers push prices higher.
- Conversely, a drop below the VAL indicates selling pressure and potential further downside.
4. High-Volume Nodes (HVNs)
High-Volume Nodes are zones of concentrated trading activity, appearing as peaks in the Volume Profile histogram. These areas signify price levels of high market interest, where buyers and sellers are heavily engaged.
Key characteristics of HVNs:
- They represent fair value areas, where prices are likely to consolidate.
- HVNs act as strong support or resistance levels due to the significant volume traded in these zones.
For example:
- If the price approaches an HVN during an uptrend, it may pause or pull back before resuming the trend.
- In a downtrend, an HVN can provide strong resistance, requiring substantial momentum to break through.
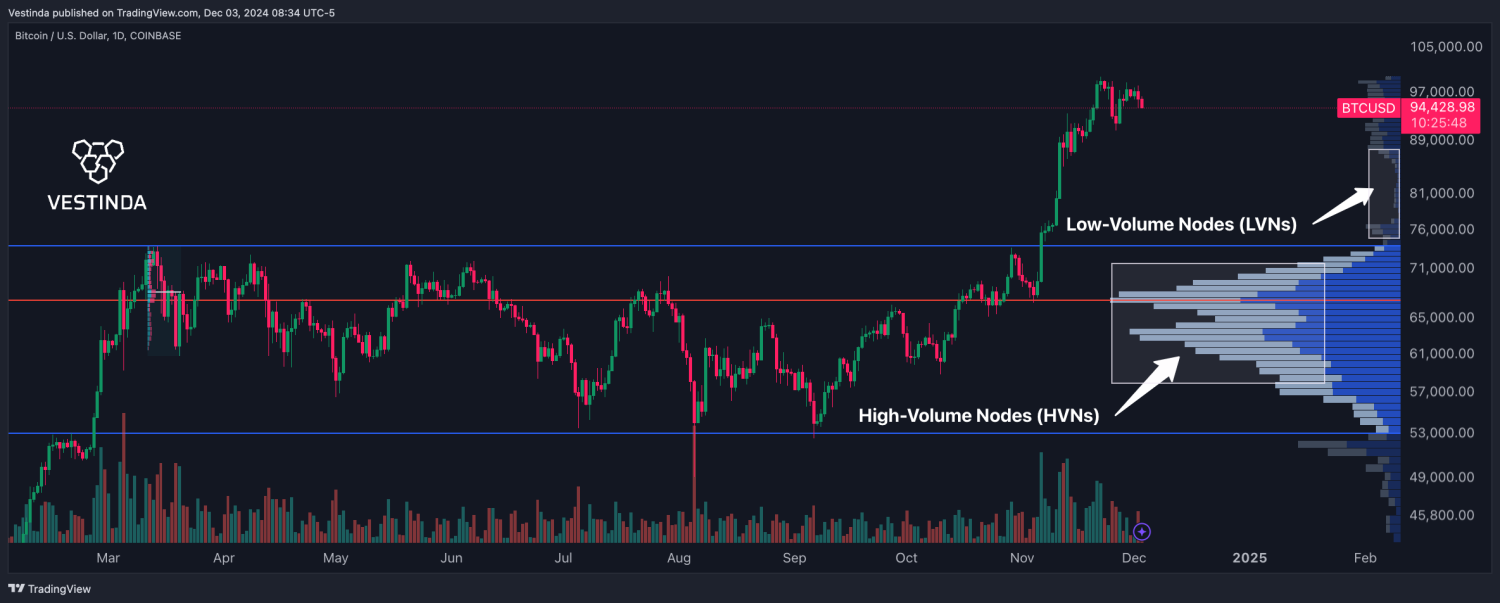
5. Low-Volume Nodes (LVNs)
Low-Volume Nodes are the opposite of HVNs, characterized by valleys or drops in the Volume Profile histogram. These zones indicate price levels with minimal trading activity, often created during breakout rallies or sharp declines.
Key characteristics of LVNs:
- They represent unfair value areas, where prices move quickly due to the lack of market interest.
- LVNs are prime zones for breakouts, as prices tend to pass through them with minimal resistance.
For example:
- If the price approaches an LVN from below, it may surge through this level rapidly in a bullish breakout.
- Similarly, if the price drops into an LVN, it often accelerates downward due to the absence of significant support.
Practical Uses of Volume Profile in Trading
1. Identifying Support and Resistance
HVNs represent robust support or resistance due to sustained trading activity. In contrast, LVNs highlight potential breakout zones, where price movement is faster due to lower trading interest.
2. Understanding Market Sentiment Through Volume
The POC acts as a benchmark for market sentiment:
- Prices above POC indicate bullish conditions.
- Prices below POC suggest bearish sentiment.
3. Predicting Price Movements
By examining volume clusters, traders can forecast future price actions. For example:
- High volume at higher prices suggests bullish strength.
- High volume at lower prices indicates bearish dominance.
Volume Profile Trading Strategies
1. High-Volume Node Retracements
When price retraces to an HVN, it often bounces off due to the strong support or resistance.
 Example: A trader identifies an HVN at $1,800 and $2,000 on ETH/USD and sets a buy order at this level, expecting a rebound.
2. Low-Volume Node Breakouts
Prices tend to move rapidly through LVNs due to minimal trading activity.
 Example: On BTC/USD, an LVN at $20,000 signals a potential breakout opportunity, prompting a buy stop above this level.
3. Trend Confirmation Using Value Areas
Value Areas help confirm trends.
- Bullish Trend: Increasing volume at higher prices.
- Bearish Trend: Rising volume at lower prices.
4. Daily Open Strategy
Compare the current day’s open to the previous day’s Volume Profile:
- Above VAH: Look for retracement to POC before a bullish continuation.
- Below VAL: Look for retracement to POC before a bearish continuation.
- Outside the Profile Range: Expect a potential runner in the direction of the breakout.
Multi-Time Frame Volume Profile Trading for Precision Analysis
Use multiple timeframes to enhance Volume Profile insights:
- Weekly Chart: Identify major HVNs and LVNs for broader trends.
- Daily Chart: Fine-tune entry and exit points.
- Intraday Chart: Pinpoint high-probability setups for scalping or day trading.
Limitations of Volume Profile Trading: What You Should Know
- Synthetic Data on Non-Standard Charts
Volume data on Heikin Ashi or Renko charts is synthetic, potentially leading to inaccuracies. Use standard candlestick charts for precise calculations. - Reactive Nature
Volume Profile relies on past data, making it less predictive than trendlines or moving averages. Combine it with proactive tools for a balanced strategy.
Example Strategy: Volume Profile and Daily Open
- Identify the Previous Day’s POC, VAH, and VAL.
- Assess Today’s Opening Price:
- If above VAH, expect retracement to POC and continuation upward.
- If below VAL, expect retracement to POC and continuation downward.
- If outside the previous day’s range, trade the breakout in the direction of the opening price.
Conclusion
Volume Profile is a versatile and indispensable tool for traders, offering a clear view of market dynamics and actionable insights. From identifying support and resistance to forecasting price movements, it provides a powerful edge in navigating volatile markets. By mastering its components and integrating it into your strategy, you can make more informed decisions and unlock new opportunities in your trading journey.

With over seven years of experience in trading since 2017, I specialize in cryptocurrency markets while sharing insights through engaging content. Proud to rank among the top 100 most popular analysts on TradingView of all time, I bring a blend of expertise, passion, and actionable strategies to the trading community.
