

As we wrap up 2024, many traders are fine-tuning their strategies to get a head start on 2025. Whether you’re new to trading or a seasoned pro, having the right tools is crucial in navigating ever-changing markets. Top trading indicators for 2025 can provide the edge needed to make informed decisions. TradingView, with its flexible charting platform, offers free and premium indicators for traders at every level. Let’s explore the top trading indicators for 2025 and discuss when upgrading to premium tools may be worth considering.
Article summary
How to Access Free Indicators on TradingView
To access top trading indicators for 2025, head to TradingView charts and click the “Indicators” button in the top toolbar.
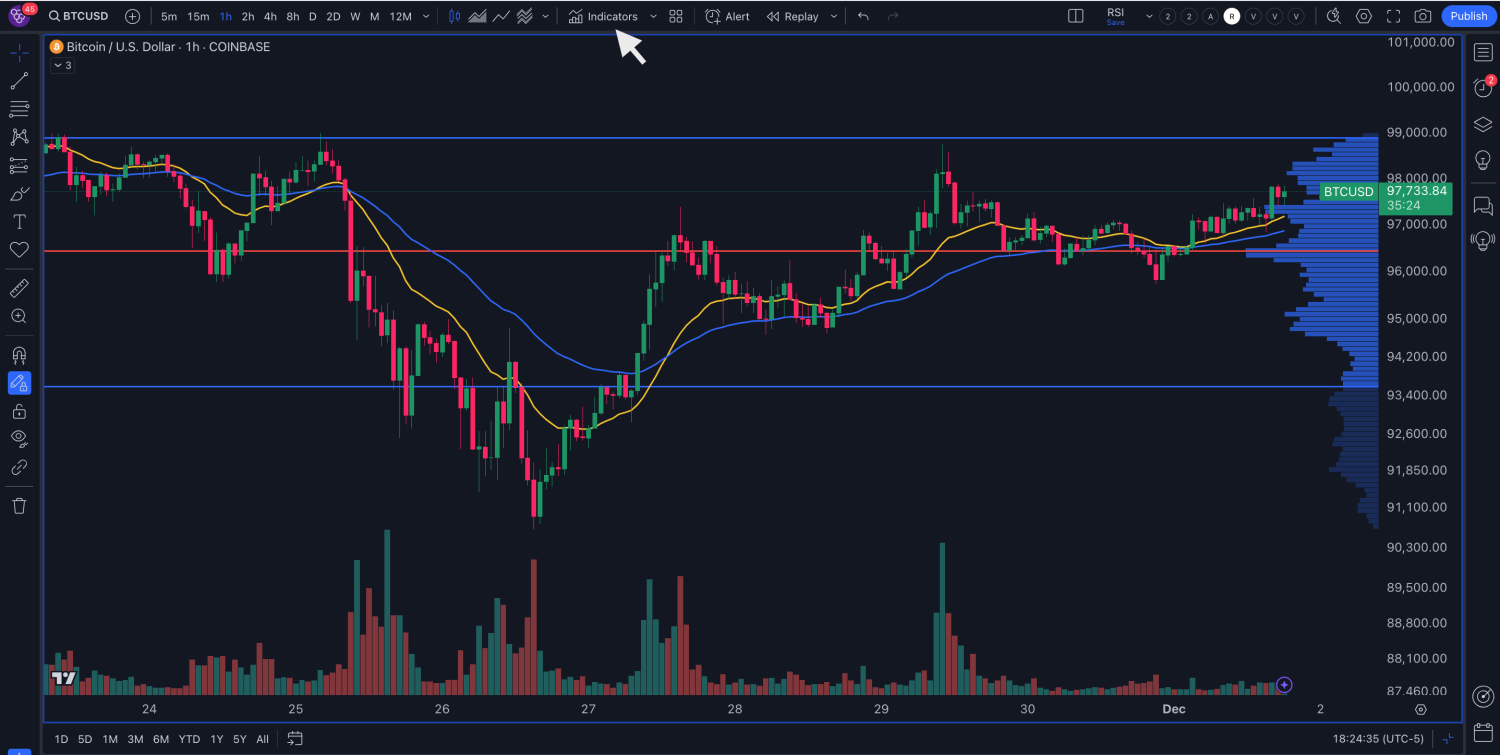
You’ll find a wide array of indicators available, many of which are completely free. These tools are organized by categories, including trend indicators, volume-based indicators, and oscillators, providing more than enough options to help you gain a deeper understanding of market behavior.
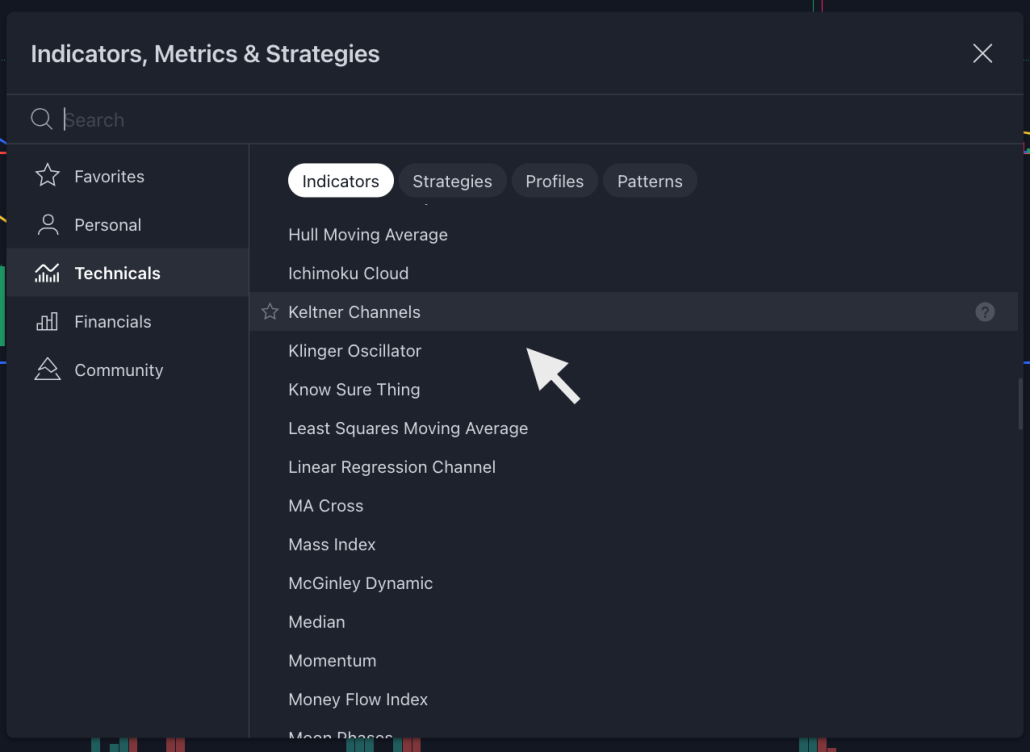
No need for complex downloads or premium upgrades — just select, apply, and start trading!
Start earning 60% a year with automated trading Free Sign UpTop Free TradingView Indicators to Watch for 2025
Let’s break down the top trading indicators for 2025 and how they can improve your trading:
1. Moving Average Crossover: Simplifying Trend-Following
One of the simplest and definitely top trading indicator for 2025 is the Moving Average Crossovers, which is particularly popular for spotting trend reversals. This indicator relies on the relationship between two moving averages — typically the 9-period and 21-period moving averages. The 9-period MA moves faster, reacting more quickly to price action, while the 21-period MA smooths out fluctuations and helps confirm the trend.
- How It Works:
- When the 9-period MA crosses above the 21-period MA, it’s a signal of an uptrend.
- When the 9-period MA crosses below the 21-period MA, it’s a signal of a downtrend.
This method is ideal for trending markets and can be used in multiple timeframes. For example, short-term traders might use it on the 5-minute chart for quick trades, while long-term investors may prefer the daily chart.

Tip: For better results, combine the Moving Average Crossover with volume indicators to confirm momentum.
2. RSI: One of the Best Trading Indicators for 2025
The Relative Strength Index (RSI) is one of the most widely used indicators for momentum analysis. It oscillates between 0 and 100, helping traders determine whether an asset is overbought or oversold.
- How It Works:
- RSI readings above 70 indicate that an asset might be overbought, signaling a potential sell opportunity.
- RSI readings below 30 suggest that an asset may be oversold, indicating a potential buying opportunity.
The real magic with RSI lies in divergences:
- Bullish Divergence occurs when

 the price makes a lower low while the RSI makes a higher low, indicating potential upward momentum.
 - Bearish Divergence forms when the price makes a higher high, but the RSI makes a lower high, signaling potential weakness.

Tip: RSI is even more effective when combined with support and resistance levels or candlestick patterns to confirm trend reversals.
3. VWAP: Perfect for Intraday Trading
Intraday traders, especially those focused on stocks and crypto, will find the Volume Weighted Average Price (VWAP) indispensable. VWAP gives you the average price weighted by volume throughout the trading session, reflecting fair value and market sentiment.
- How It Works:
- When the price is trading above VWAP, it indicates bullish momentum.
- When the price is below VWAP, bearish sentiment prevails.
VWAP is particularly valuable for scalping and day trading, as it can act as a dynamic support or resistance level.

Tip: Combine VWAP with the RSI to get a more accurate read on momentum and spot potential reversals.
4. Supply and Demand Zones: Key Indicators for 2025
Supply and demand dynamics dictate price movements in every market. The Supply and Demand Indicator on TradingView highlights the zones where buying or selling pressure is at its strongest. These zones can act as powerful support and resistance levels.
- How It Works:
- Demand Zones: Areas where buyers overwhelmed sellers, pushing the price higher.
- Supply Zones: Areas where sellers dominated, pushing the price lower.
These zones are excellent entry points for reversal traders, as price often reacts when revisiting these levels.
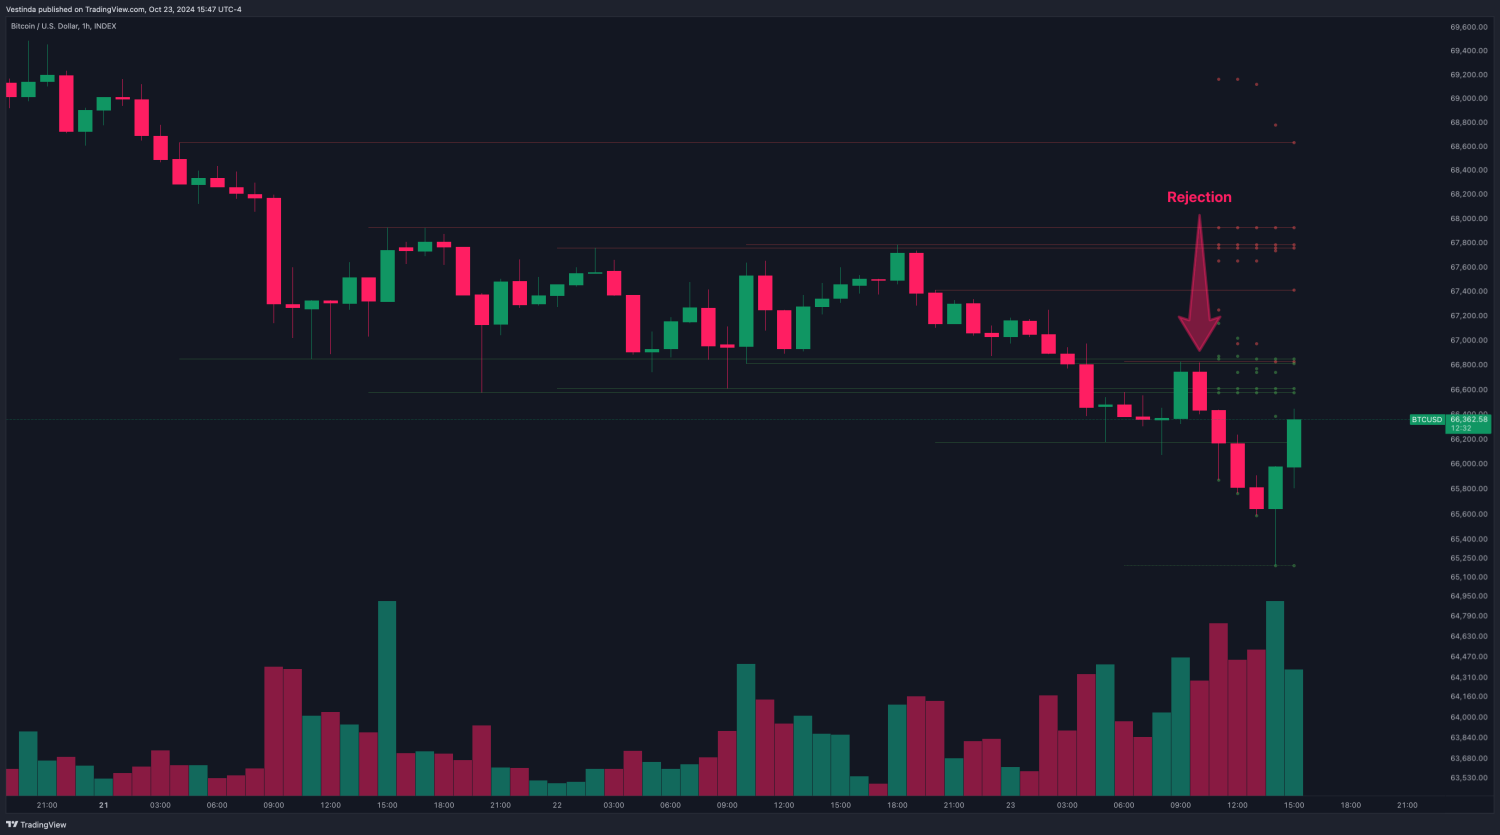
Tip: Combine supply and demand zones with the Volume Profile to confirm whether large participants are entering the market at these levels.
5. Support and Resistance Indicator: Foundation for Every Trader
Support and resistance are the building blocks of technical analysis, and TradingView’s Support and Resistance Indicator automatically plots these crucial levels on your chart. It looks for previous highs and lows and marks them as potential reversal zones.
- How It Works:
- Support: A price level where a downtrend could pause due to increased demand.
- Resistance: A price level where an uptrend may stall due to increased selling pressure.
By marking these levels, this indicator helps traders anticipate where price might bounce or break through.
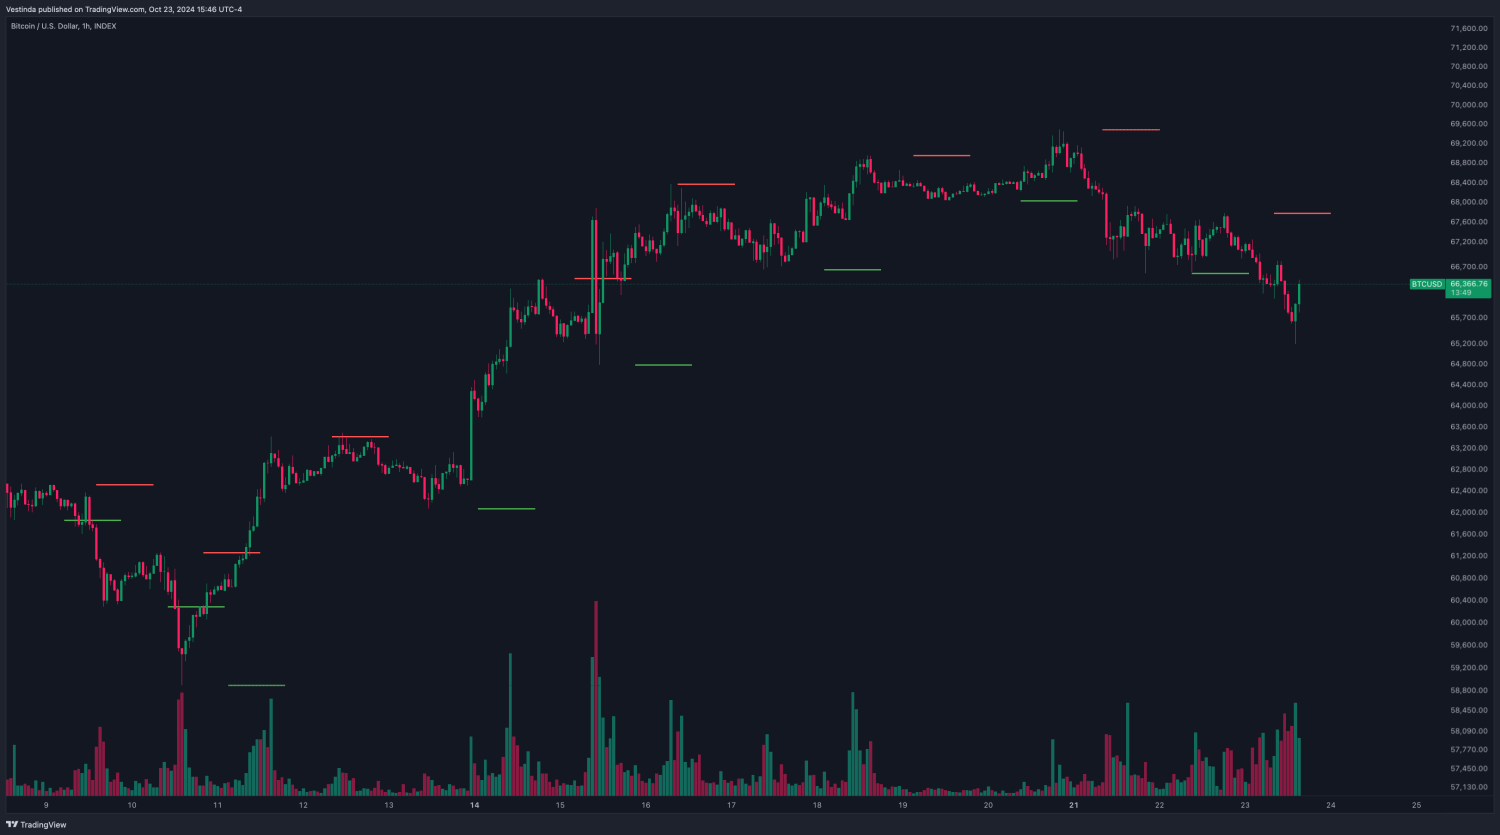
Tip: Always use these levels in conjunction with other indicators like RSI or Moving Averages to confirm the strength of the levels.
Why Upgrade? Advanced Trading Indicators for 2025
While TradingView offers a wealth of free indicators that cater to the needs of most traders, advanced users may benefit from some of the premium tools. One of the standout premium indicators is Volume Profile, which provides insights into market structure that free tools may not fully capture.
Volume Profile: Deep Dive Into Market Structure
The Volume Profile indicator is a more advanced tool that visualizes the volume traded at each price level over a given time period. This helps traders pinpoint key support and resistance zones where the most trading activity occurred.
- How It Works:
- Value Area Low (VAL) indicates the lower boundary of the area where most of the trading took place.
- Value Area High (VAH) marks the upper boundary.
- The Point of Control (POC) is the price level with the highest traded volume, often acting as a pivot point.
This indicator provides a comprehensive look at market sentiment and is ideal for traders who want to understand where institutional interest might be concentrated.

Tip: Use the Volume Profile in combination with supply and demand zones for better trade entry and exit decisions.
Why Free Indicators Are More Than Enough
The beauty of TradingView’s free indicators is that they offer robust solutions for most traders without needing to pay for premium services. Whether you’re focusing on trend-following, momentum analysis, or volume-based trading, the right combination of these indicators can provide everything you need to stay competitive in the markets.
Tip: Start by mastering a few key trading indicators — like RSI, VWAP, and Moving Averages — before adding more advanced tools like Supply and Demand Zones. Focus on building a simple but effective system and always incorporate proper risk management.
Conclusion: Are You Ready for 2025?
The top trading indicators for 2025 on TradingView are powerful tools for traders at any level. Whether you’re scalping crypto or swing trading stocks, mastering these indicators can help you stay ahead. Start with free tools like RSI, VWAP, and Moving Averages, and expand your toolkit as needed.

With over seven years of experience in trading since 2017, I specialize in cryptocurrency markets while sharing insights through engaging content. Proud to rank among the top 100 most popular analysts on TradingView of all time, I bring a blend of expertise, passion, and actionable strategies to the trading community.