

Introduction
Understanding how to read a Bitcoin Depth of Market Chart is crucial for traders looking to analyze market trends, predict price movements, and make informed trading decisions. Depth charts visually represent supply and demand through buy and sell orders, helping traders assess market liquidity, volatility, and sentiment. This guide explains the components of a Bitcoin depth chart, the significance of buy and sell walls, and how it complements other tools like candlestick charts.
Article summary
Why Is Understanding a Bitcoin Depth Chart Important?
A Bitcoin depth chart provides a snapshot of the current market order book, highlighting outstanding buy and sell orders. This tool helps traders determine liquidity levels, price resistance, and market psychology. Whether you’re trading long-term or day-trading, a depth chart is an indispensable tool for navigating the volatile world of cryptocurrency trading.
Components of a Bitcoin Depth Chart
1. Bid Line
- What It Shows: The cumulative value of buy orders at varying price points.
- How It Appears: Typically displayed as a green line sloping negatively from left to right.
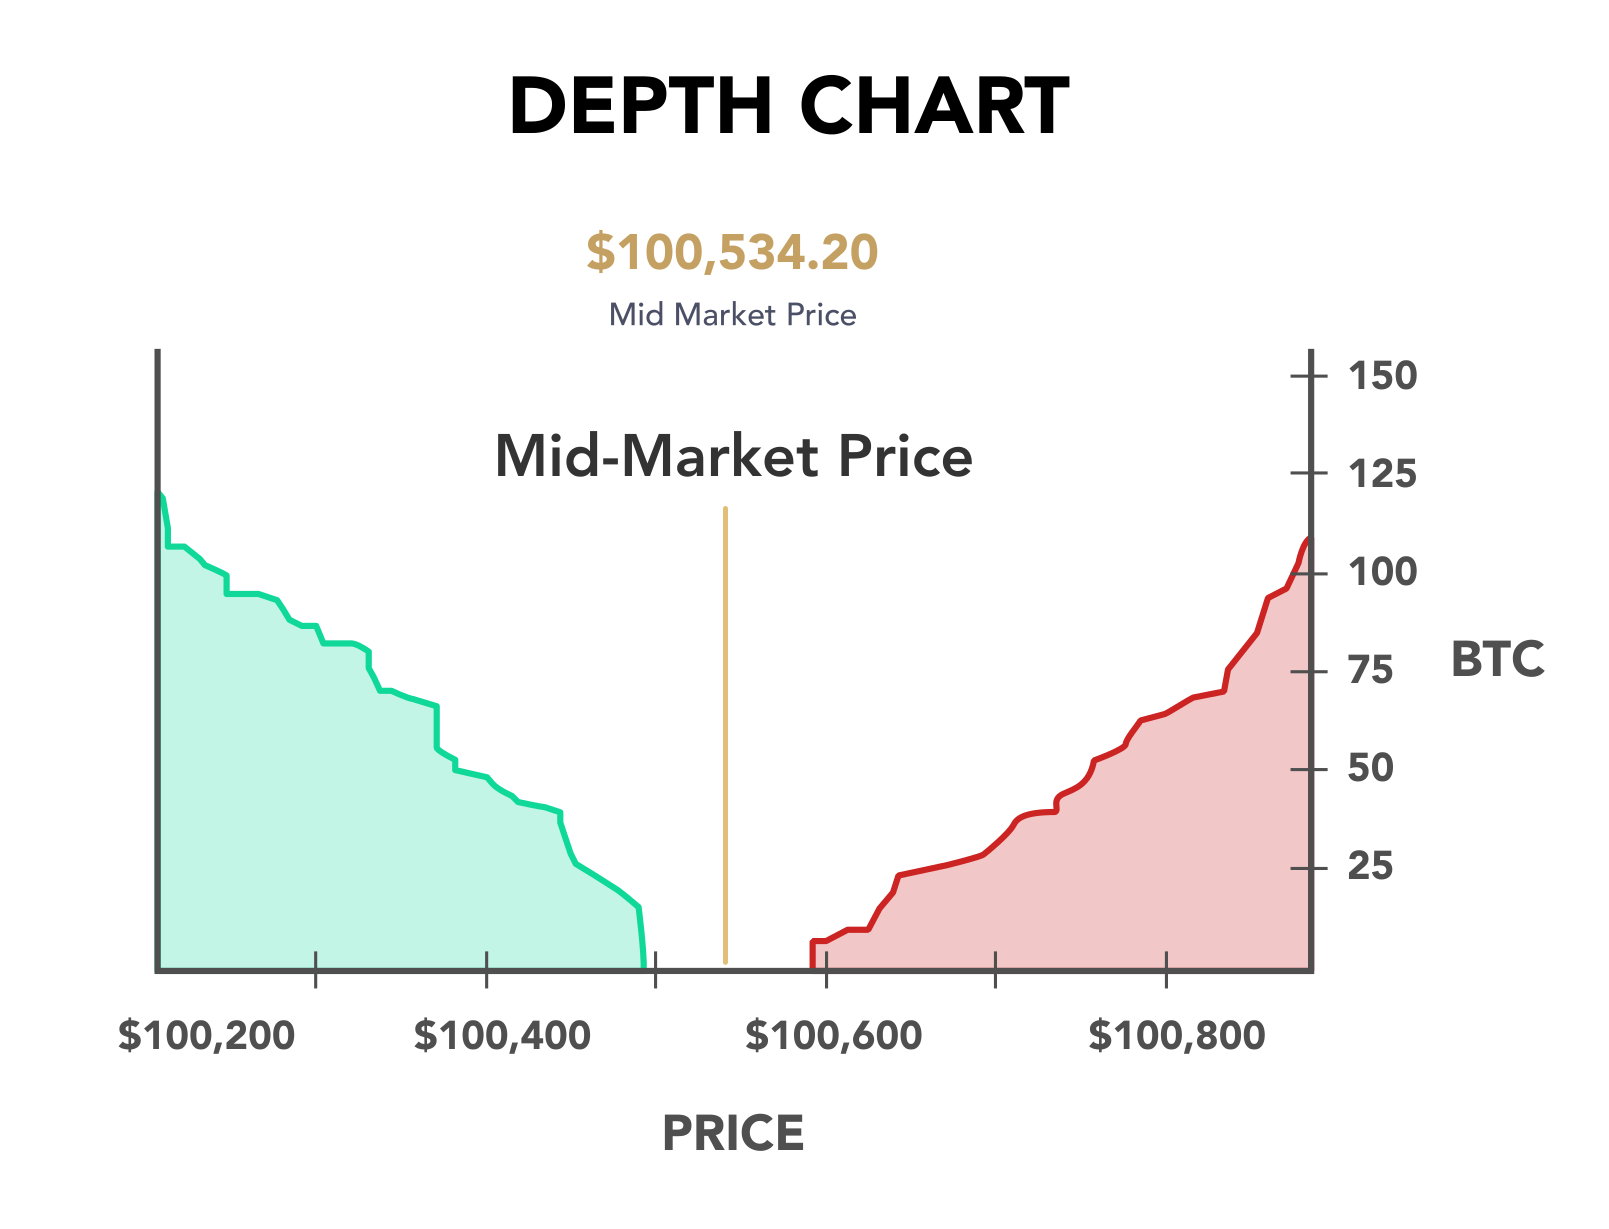
 2. Ask Line
- What It Shows: The cumulative value of sell orders at each price point.
- How It Appears: Represented as a red line sloping negatively from right to left.
3. Horizontal Axis (X-Axis)
- What It Represents: Price points where buy and sell orders are placed.
4. Vertical Axis (Y-Axis)
- What It Represents: The cumulative value of Bitcoin buy and sell orders, typically denominated in fiat currency.
What Is Represented by a Depth Chart?
A depth chart reveals the overall market sentiment, highlighting supply and demand imbalances:
- Buy Walls: Indicate strong buying pressure and suggest that traders believe the price won’t fall below a certain level.
- Sell Walls: Reflect selling pressure, signaling a belief that prices won’t exceed a given threshold.
The alignment or skew of the chart can also indicate liquidity levels and the overall volatility of the asset.
Understanding Buy and Sell Walls
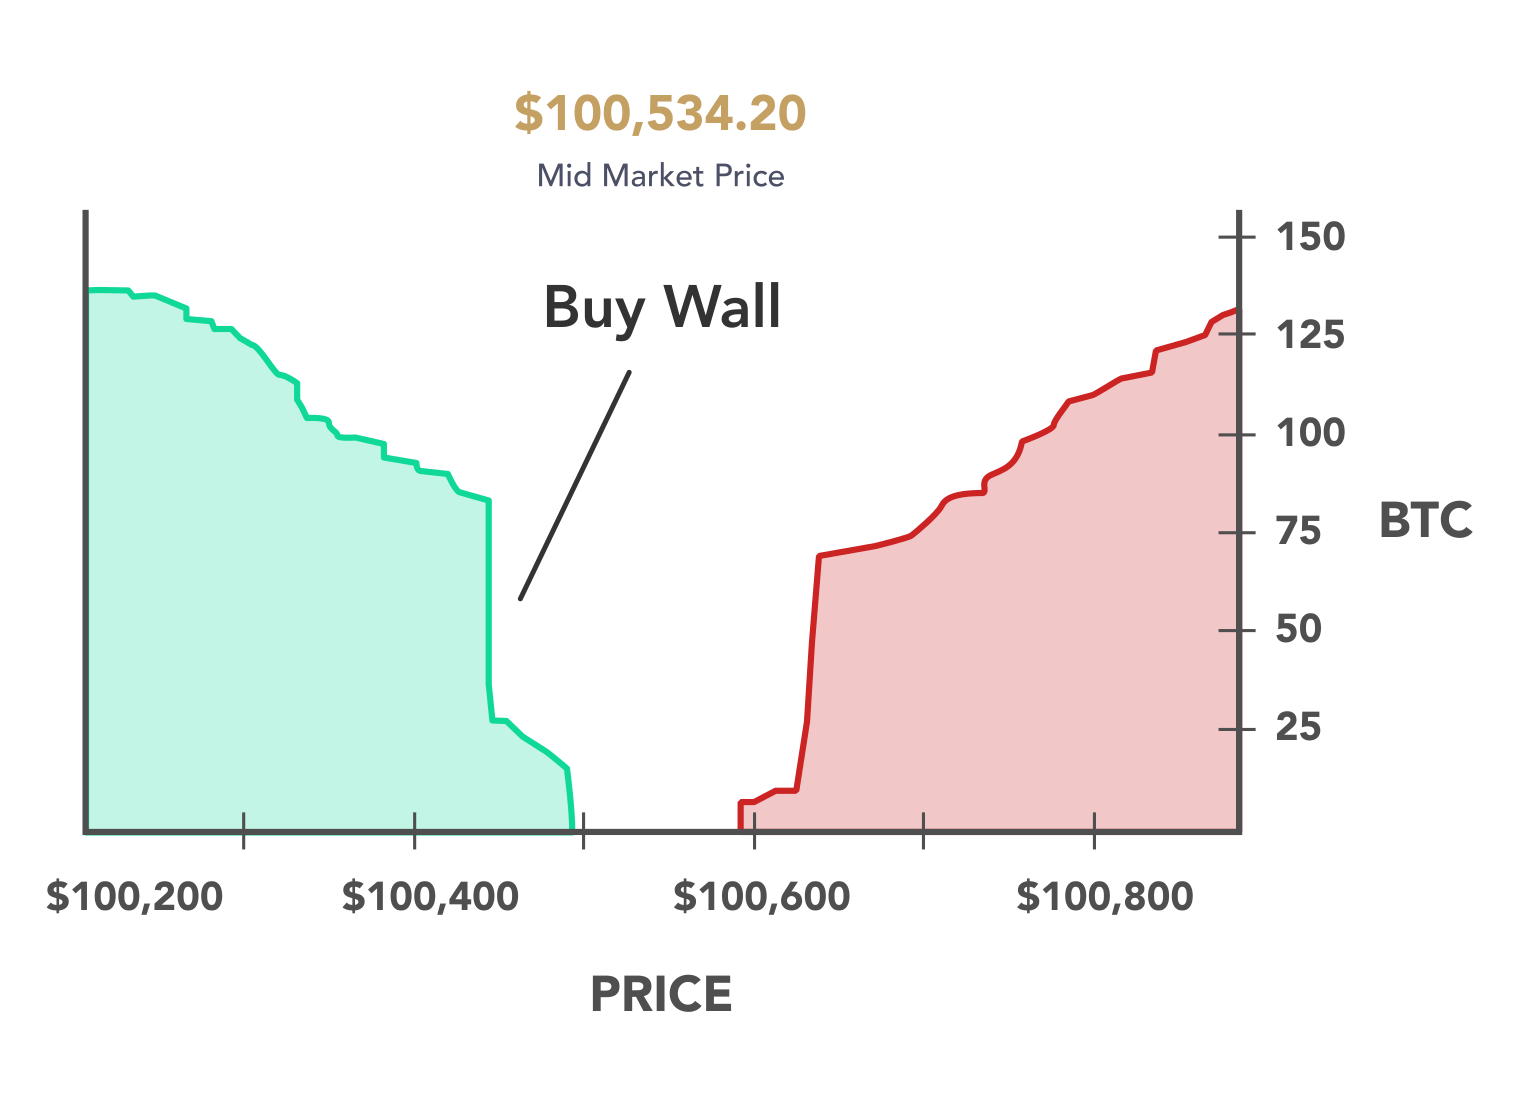
 Buy Walls
- Definition: High volumes of buy orders at a specific price level.
- Significance: Prevents rapid price drops, often viewed as a support level.
- Market Psychology: Large buy walls may lead traders to believe in upward price potential, influencing buying decisions.
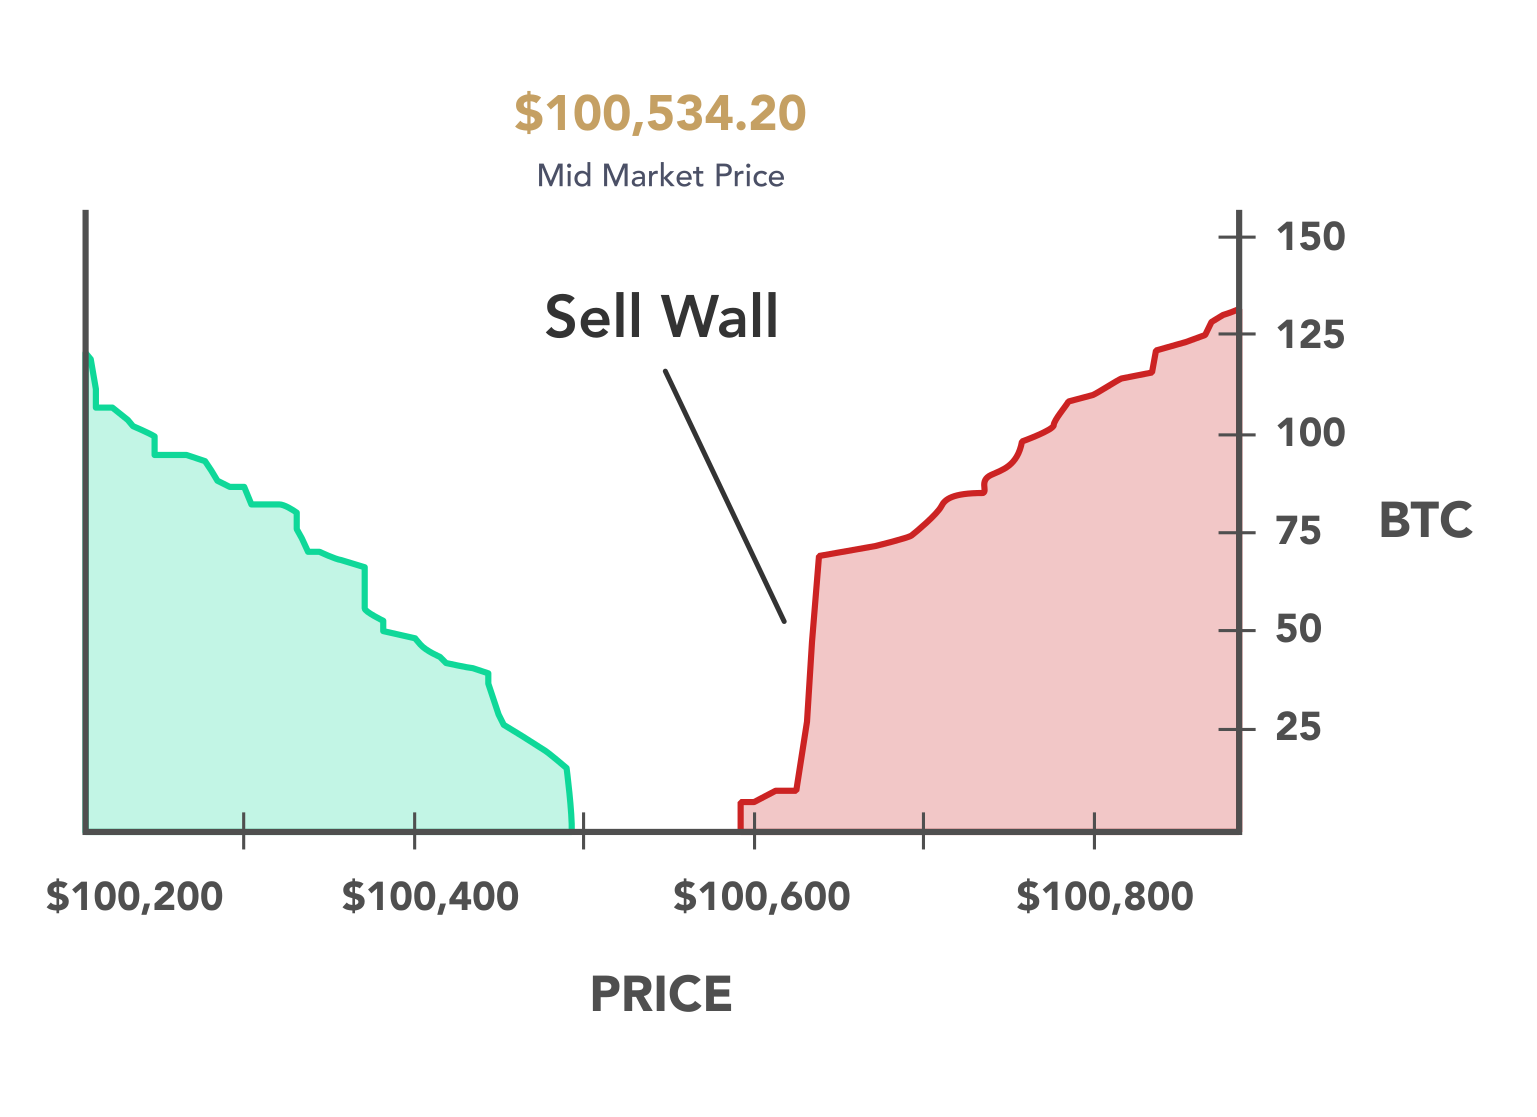
Sell Walls
- Definition: High volumes of sell orders at a specific price level.
- Significance: Acts as resistance, preventing prices from rising quickly.
- Market Psychology: Large sell walls may signal potential price declines, prompting traders to sell.
Complementary Tools: Candlestick Charts
Cryptocurrency exchanges often provide candlestick charts alongside depth charts.
Start earning 60% a year with automated trading Free Sign Up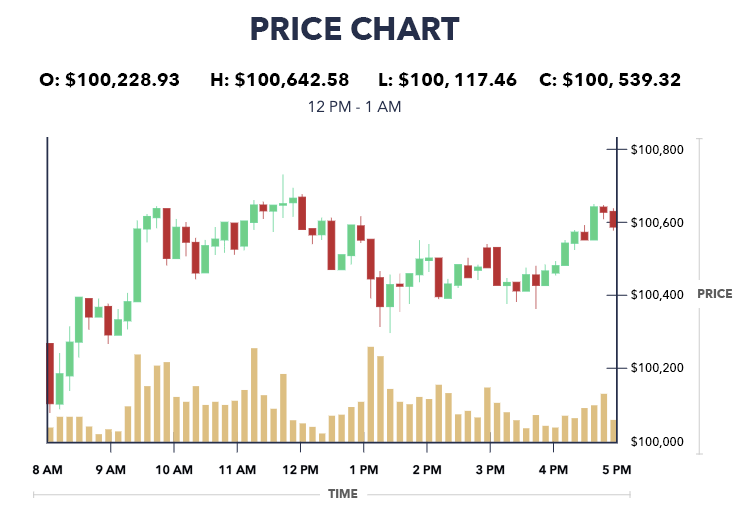
 Key Features of Candlestick Charts
- Representation: Shows price movements over a specified timeframe.
- Components:
- Real Body: The difference between opening and closing prices.
- Wicks: Represent the highest and lowest prices during the period.
- Color Coding:
- Green Candlesticks: Indicate a price increase.
- Red Candlesticks: Indicate a price decrease.
Candlestick charts excel in tracking price trends but lack liquidity and volume insights, making them a complementary tool to depth charts.
Conclusion
A Bitcoin depth chart provides valuable insights into the supply and demand dynamics of the market, highlighting critical price levels and liquidity. By combining depth charts with candlestick charts, traders can better understand market trends and make more informed decisions. Remember to account for hidden liquidity, as unregistered buy and sell orders can impact the depth chart’s accuracy.

With over seven years of experience in trading since 2017, I specialize in cryptocurrency markets while sharing insights through engaging content. Proud to rank among the top 100 most popular analysts on TradingView of all time, I bring a blend of expertise, passion, and actionable strategies to the trading community.