Introduction
Cryptocurrency trading thrives on precision, and Crypto Technical Analysis is a vital tool for traders aiming to predict price movements and identify trading opportunities. By analyzing historical price data, chart patterns, and indicators like RSI and MACD, technical analysis helps traders navigate the dynamic crypto market with confidence.
This guide explains the fundamentals of crypto technical analysis, including key tools and strategies, to help you succeed.
Article summary
1. Understanding Technical Analysis for Crypto Trading
The objective of technical analysis is to identify price patterns, trends, and market dynamics to inform trading decisions. Unlike fundamental analysis, which evaluates the intrinsic value of an asset, TA focuses on interpreting historical price movements and volume data.
1.1 Core Assumptions of Technical Analysis
- Market Discounts Everything: All relevant information about an asset is already factored into its price.
- Price Moves in Trends: Prices often follow recognizable trends, which can be identified and leveraged.
- History Repeats Itself: Patterns observed in the past can reoccur, making them useful for predicting future price movements.
2. How Crypto Technical Analysis Works
2.1 Steps in Technical Analysis
- Data Collection: Gather historical price and trading volume data for the cryptocurrency under consideration. Platforms like TradingView and major exchanges offer robust tools for this purpose.
- Charting: Visualize price data using charts such as candlestick charts, line charts, or bar charts. Candlestick charts are especially popular for identifying trends and market sentiment.
- Using Indicators: Employ technical indicators like Moving Averages (MA), Relative Strength Index (RSI), and Bollinger Bands to analyze price trends and momentum.
- Recognizing Patterns: Identify chart patterns, such as head and shoulders, triangles, or double tops, which provide insights into potential market movements.
- Forecasting: Combine the insights from indicators and patterns to make informed predictions about price trends and determine entry or exit points.
3. Key Indicators for Crypto Technical Analysis
3.1 Moving Averages (MA)
- Simple Moving Average (SMA): Smooths price data over a defined period.
- Exponential Moving Average (EMA): Assigns more weight to recent prices, making it more responsive to recent trends.
3.2 Relative Strength Index (RSI)
- Measures the speed and magnitude of price changes to indicate overbought or oversold conditions.
- RSI values above 70 suggest overbought conditions, while values below 30 indicate oversold conditions.
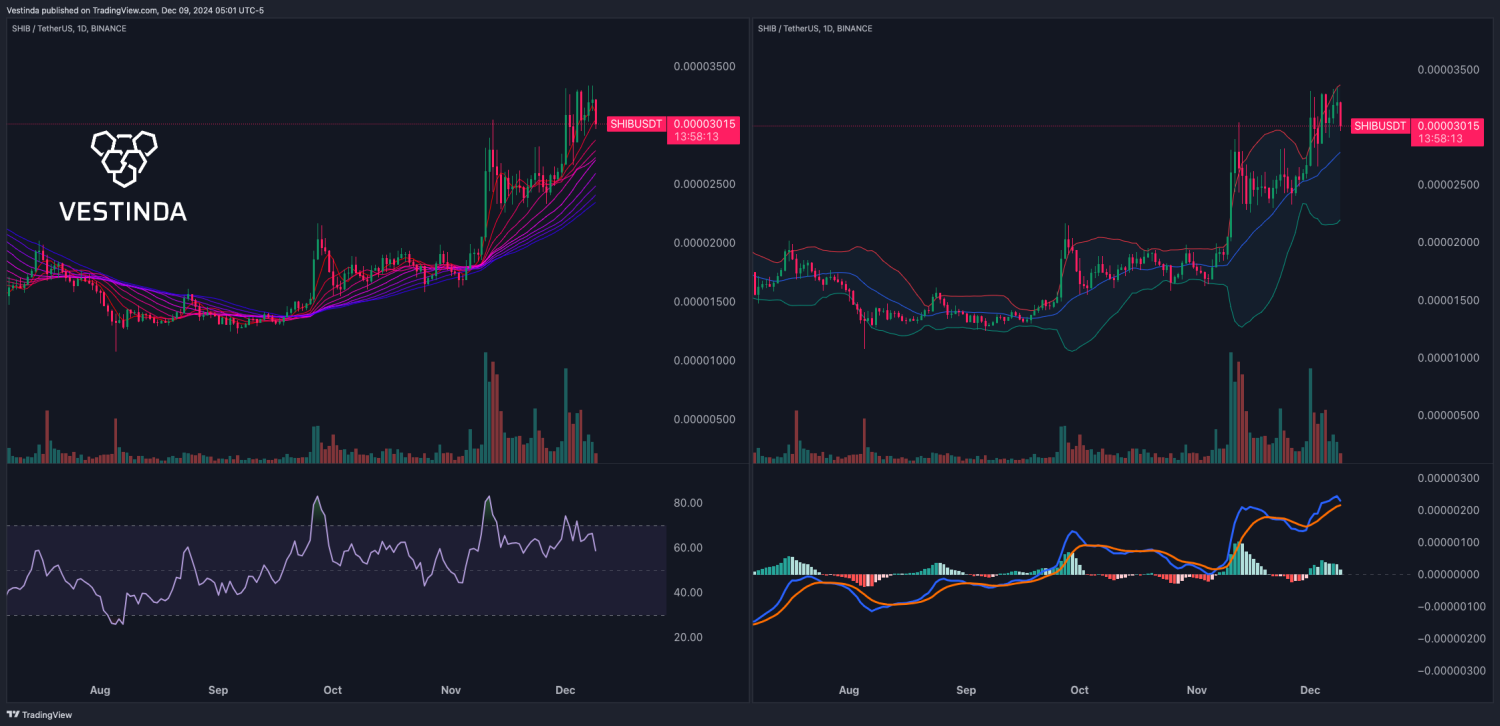
3.3 Moving Average Convergence Divergence (MACD)
- A momentum indicator that shows the relationship between two moving averages.
- Signal line crossovers highlight potential trend reversals or continuations.
3.4 Bollinger Bands
- Displays price volatility by plotting bands above and below a moving average.
- Prices nearing the bands often signal overbought or oversold conditions.
4. Recognizing Patterns in Crypto Charts
 4.1 Head and Shoulders
- Indicates a potential trend reversal.
- A head and shoulders pattern signals a bearish reversal, while an inverse pattern suggests bullish momentum.
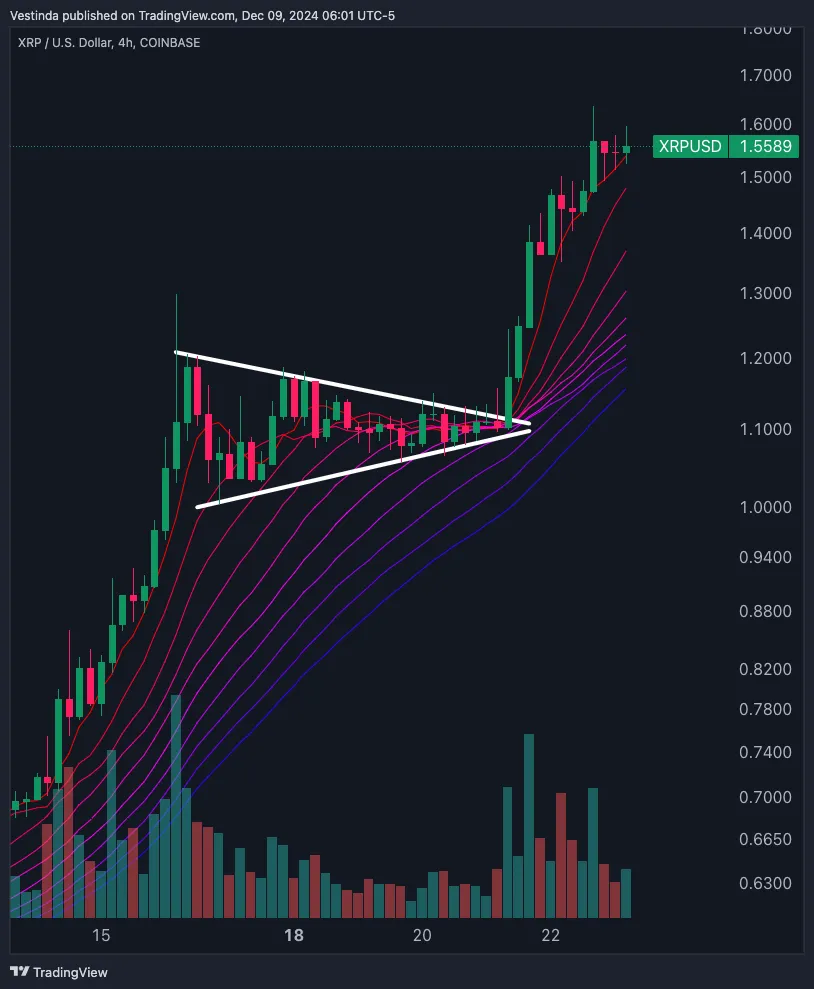
4.2 Triangles
- Ascending triangles typically indicate bullish continuations.
- Descending triangles suggest bearish trends.
4.3 Double Tops and Bottoms
- Double tops signal bearish reversals.
- Double bottoms highlight bullish reversals.
5. Why Technical Analysis Is Crucial in Crypto Trading
5.1 High Volatility
Cryptocurrencies are highly volatile, providing numerous opportunities for short-term profits. TA helps traders capitalize on these price swings.
5.2 24/7 Markets
Unlike traditional markets, cryptocurrency trading is continuous. TA tools allow traders to monitor and react to trends at any time.
Start earning 60% a year with automated trading Free Sign Up5.3 Decentralized and Dynamic
The lack of central authorities and rapid adoption of cryptocurrencies make fundamental analysis challenging. TA offers an adaptable approach to understanding market behavior.
6. Risks and Criticism of Technical Analysis

 6.1 Subjective Interpretation
Traders may interpret the same charts differently, leading to conflicting decisions.
6.2 Dependence on Historical Data
TA relies on past data, which does not guarantee future performance. Unpredictable factors like news events can disrupt trends.
6.3 Emotional Influence
Market psychology can create self-fulfilling prophecies, where widely followed patterns influence traders’ behavior regardless of actual market dynamics.
7. Tips for Effective Technical Analysis
- Combine with Fundamental Analysis: Enhance your strategy by considering both technical and fundamental factors.
- Use Multiple Indicators: Avoid relying on a single indicator. Combine tools for more accurate predictions.
- Set Clear Goals: Define entry and exit points, risk tolerance, and profit targets before trading.
- Practice with Demo Accounts: Use demo accounts to refine your skills and test strategies without risking real capital.
8. Conclusion
Technical analysis is an essential tool for cryptocurrency traders, offering insights into price trends and market behavior. While it has limitations, mastering TA can significantly improve your decision-making and risk management. By integrating multiple indicators, recognizing patterns, and staying informed about market dynamics, traders can navigate the volatile crypto market with confidence.
With practice and a disciplined approach, technical analysis can become a powerful ally in your crypto trading journey.

With over seven years of experience in trading since 2017, I specialize in cryptocurrency markets while sharing insights through engaging content. Proud to rank among the top 100 most popular analysts on TradingView of all time, I bring a blend of expertise, passion, and actionable strategies to the trading community.
