-
 Create
account -
 Discover profitable
strategies -
 Connect exchange
& start earning
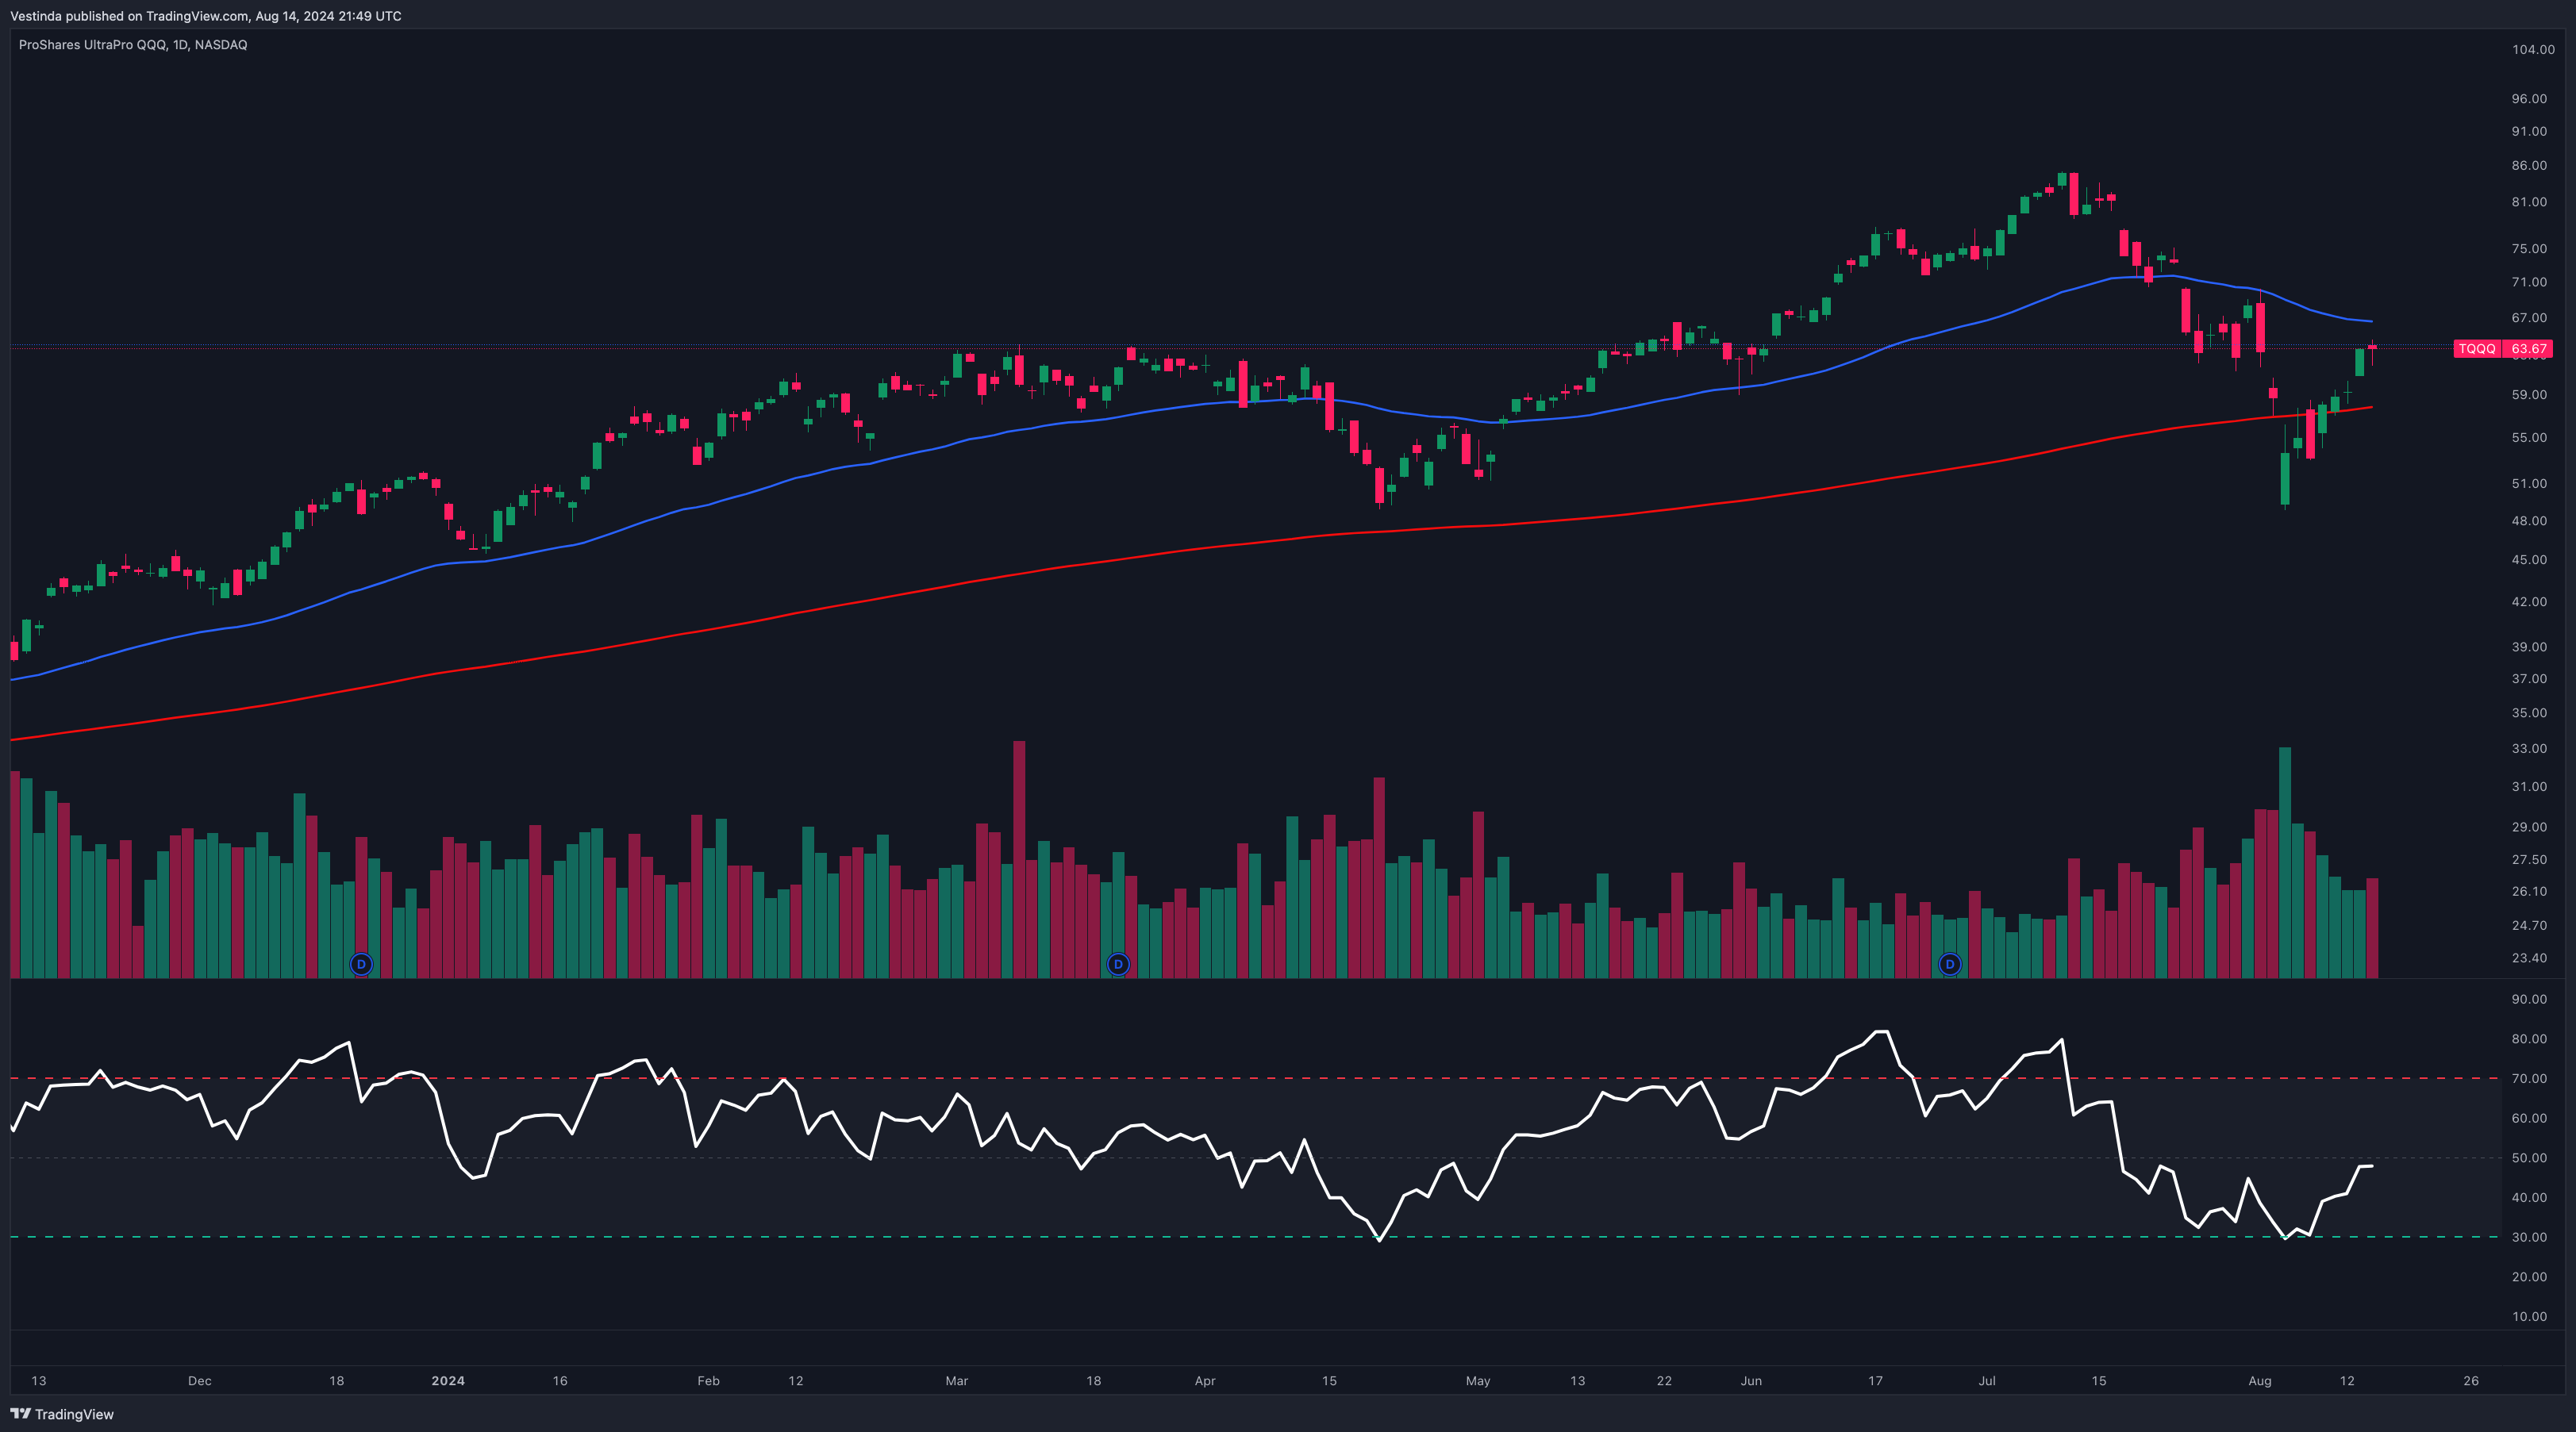
Automated Strategies & Backtesting results for TQQQ
Here are some TQQQ trading strategies along with their past performance. You can validate these strategies (and many more) for free on Vestinda across thousands of assets and many years of historical data.
Automated Trading Strategy: Stochastic Oscillator with SuperTrend on TQQQ
Based on the backtesting results statistics for the trading strategy, conducted from November 2, 2016, to November 2, 2023, several key insights can be gathered. The profit factor of the strategy stands at 1.26, indicating a positive outcome overall. The annualized ROI (Return on Investment) is reported to be 15.54%, reflecting a respectable return during the evaluated period. On average, the strategy held positions for approximately 3 days and 6 hours, implying a short to medium-term time horizon. The average number of trades per week was 0.61, indicating a relatively low trading frequency. The strategy executed 223 closed trades, with 47.53% of them resulting in a profit. The total ROI for the period amounted to an impressive 110.98%. These results suggest that the trading strategy exhibited profitability and potential for generating consistent returns.
Choose another period and try again.
Automated Trading Strategy: Play the swings and profit when markets are trending up on TQQQ
Based on the backtesting results for the trading strategy from November 2, 2022, to November 2, 2023, several key statistics emerge. The profit factor, calculated at 1.31, indicates that for every unit of risk taken, the strategy generated a profit of 1.31 units. This suggests a positive overall return. The annualized ROI stands at an impressive 21.77%, showcasing the strategy's ability to generate consistent returns on an annual basis. On average, trades were held for approximately 3 days and 23 hours, indicating a short-term approach. With an average of 0.65 trades per week and 34 closed trades overall, the strategy shows a moderate level of activity. The winning trades percentage is at 58.82%, further demonstrating a decent success rate. Overall, these results indicate a potentially promising trading strategy that has shown strong performance over the analyzed period.
Choose another period and try again.
Maximizing Gains with TQQQ Moving Averages: Mastering EMA and SMA Strategies for Volatile Markets
Introduction
TQQQ (ProShares UltraPro QQQ) is an exchange-traded fund (ETF) designed to deliver three times the daily return of the Nasdaq-100 Index. Given its leveraged nature, TQQQ is highly volatile, making it a popular choice among active traders. However, navigating this volatility requires robust trading strategies, and moving averages—specifically Exponential Moving Averages (EMAs) and Simple Moving Averages (SMAs)—are vital tools for identifying trends and making informed trading decisions. This article will explore how investors can use moving averages to enhance their trading strategies for TQQQ.
Understanding Moving Averages
Simple Moving Average (SMA): The SMA is calculated by averaging a set number of past prices. It’s a straightforward indicator used to smooth out price action and identify the overall trend.
Exponential Moving Average (EMA): The EMA gives more weight to recent prices, making it more responsive to recent market activity. This makes it particularly useful in volatile markets like TQQQ.
Why Use Moving Averages for TQQQ?
- Trend Identification: Moving averages help traders identify the prevailing trend in TQQQ, whether it's bullish or bearish.
- Entry and Exit Signals: Crossovers between different moving averages can signal potential buy or sell opportunities.
- Volatility Management: Given TQQQ's leveraged nature, moving averages can help smooth out short-term volatility, allowing traders to focus on the bigger picture.
Key Moving Averages Strategies for TQQQ
Golden Cross and Death Cross
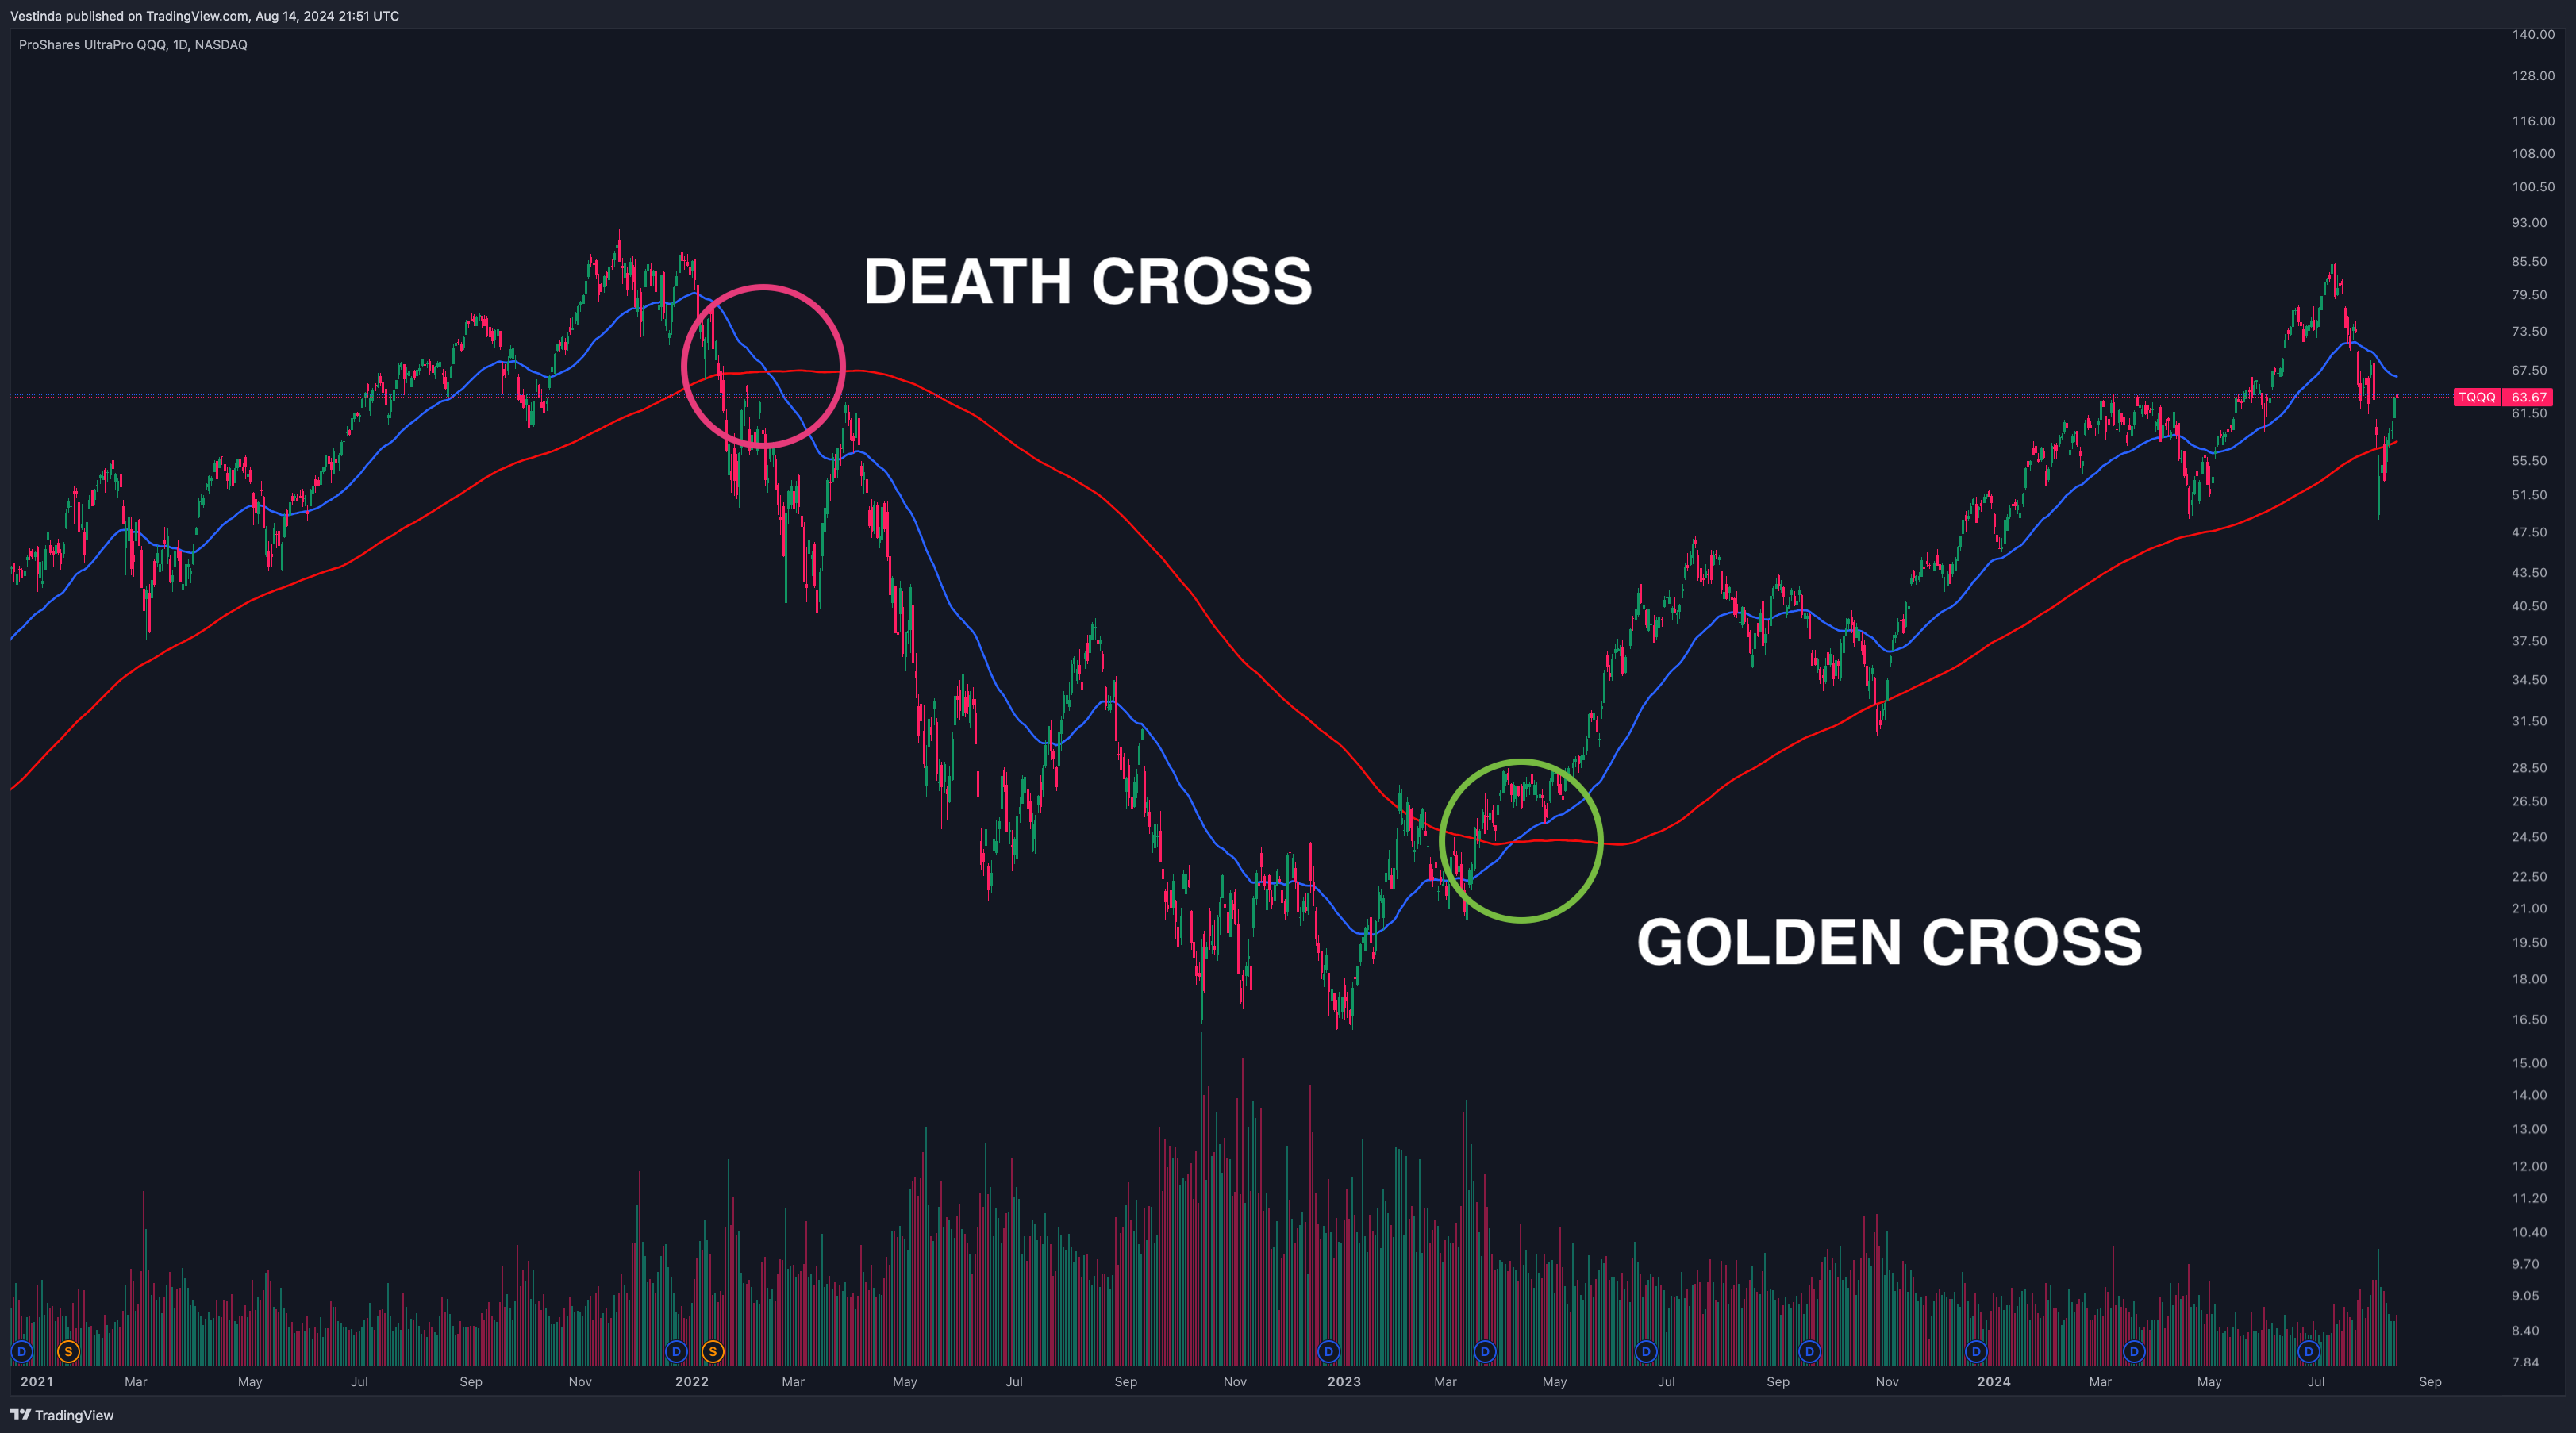
- Golden Cross: Occurs when the 50-day EMA/SMA crosses above the 200-day EMA/SMA, signaling a potential upward trend.
- Death Cross: Happens when the 50-day EMA/SMA crosses below the 200-day EMA/SMA, indicating a potential downtrend.
- Application: These crosses are powerful indicators for long-term trend shifts in TQQQ.
Dual Moving Average Crossover
- Short-Term vs. Long-Term:
- Short-Term MA: 10-day EMA.
- Long-Term MA: 50-day EMA.
- Buy Signal: When the short-term MA crosses above the long-term MA.
- Sell Signal: When the short-term MA crosses below the long-term MA.
- Application: Ideal for capturing medium-term trends and minimizing whipsaws in volatile markets.
Support and Resistance with MAs
- Dynamic Support/Resistance: Moving averages can act as dynamic support and resistance levels. For instance, the 50-day EMA may serve as a support level during an uptrend.
- Application: Use MAs to set stop-loss levels or to anticipate reversals when the price approaches a moving average.
Setting Up the TQQQ Moving Averages Strategy
- Plot the Moving Averages: Use your trading platform to plot the selected EMAs and SMAs on the TQQQ chart.
- Identify Crossovers: Monitor the chart for crossovers that could signal potential trading opportunities.
- Combine with Other Indicators: To improve accuracy, consider combining moving averages with other indicators like RSI or MACD.
Using Vestinda to Implement and Backtest the Strategy
- Automate Your Strategy: Vestinda allows you to automate your TQQQ moving averages strategy, ensuring you don’t miss critical trading signals.
- Backtesting: Utilize Vestinda’s backtesting feature to evaluate the performance of your strategy on historical TQQQ data, enabling you to optimize your approach before trading live.
Potential Risks and Considerations
- False Signals: In highly volatile markets like TQQQ, moving averages can sometimes produce false signals, leading to potential losses. It’s important to use additional indicators for confirmation.
- Leverage Risks: TQQQ’s leverage can amplify both gains and losses, so it’s crucial to manage risk carefully when trading with moving averages.
Conclusion
TQQQ (ProShares UltraPro QQQ) offers significant trading opportunities, but its volatility demands a disciplined approach. By incorporating moving averages into your trading strategy, you can better navigate market trends and make more informed decisions. Leverage Vestinda’s tools to automate and backtest your strategy, ensuring it’s optimized for success in the volatile world of TQQQ trading.
Common Pitfalls in Moving Average Analysis: TQQQ Insights
Moving average (MA) analysis is a popular tool among traders, but it is not immune to errors. One common mistake is the misuse of MA as a standalone indicator, without considering other factors. Traders should remember that MA is most effective when used in conjunction with other technical analysis tools. Another mistake is overlooking the importance of the timeframe. Different timeframes yield different results, so it is crucial to choose the appropriate MA period for the desired analysis. Additionally, traders often fail to adapt their strategies when market conditions change. They should constantly review and adjust their MA strategies to stay relevant. Lastly, relying solely on a single MA type can lead to biased analysis. It is important to experiment with different MA types, such as simple and exponential averages, to capture various aspects of price trends. By addressing these common mistakes, traders can enhance the effectiveness and accuracy of their MA analysis, increasing their chances of successful trading.
Moving Averages Unveiling Support and Resistance in TQQQ
When using moving averages to identify support and resistance levels for TQQQ, traders can look for a convergence of multiple moving averages, such as the 50-day and 200-day moving averages. This convergence indicates a strong level of support or resistance. Additionally, traders can observe how the price reacts to the moving averages. If the price bounces off the moving averages consistently, it suggests a strong support or resistance level. On the other hand, if the price breaks through the moving averages, it may indicate a weakening of support or resistance. It's important to note that moving averages are not foolproof, and other technical indicators should also be considered when identifying support and resistance levels.
Bearish Signal: The Death Cross and TQQQ.
The Death Cross is a bearish trading signal that can strike fear into investors. It occurs when the 50-day moving average crosses below the 200-day moving average. This crossover suggests that a long-term downtrend may be looming. Traders look at this signal as an indication to sell their positions or even open short positions. TQQQ, a leveraged ETF, is particularly vulnerable to the Death Cross due to its high sensitivity to market movements. When the Death Cross occurs for TQQQ, it amplifies the bearish sentiment, potentially leading to significant losses for investors. It is essential for traders to closely monitor technical indicators like the Death Cross to make informed investment decisions and mitigate risks.
Optimizing ETF Trades with Moving Averages
Moving averages are a popular technical indicator used by investors in ETFs like TQQQ. They help identify potential trends and support decision-making. To use a moving average, start by selecting a time frame, such as 50 or 200 days. The moving average line is then plotted on a chart, representing the average price over that period. When the price is above the moving average, it could indicate an uptrend, while a price below the moving average may indicate a downtrend. Traders often look for crossovers, where the price line crosses above or below the moving average line, as a signal to buy or sell. Additionally, observing the angle and slope of the moving average line can provide insight into the strength of the trend. Overall, using moving averages can assist investors in timing entries and exits, providing valuable data for ETF trading strategies.
-
Track your
Crypto Portfolio -
Copy Crypto trading
strategies -
Build trading strategies
with no code
-
Backtest trading strategies
on Crypto, Forex, Stocks, etc. -
Demo Trading
Risk-free Paper Trading -
Automate trading strategies
with Live Trading
Frequently Asked Questions
Using Moving Averages as the sole indicator in TQQQ trading has certain drawbacks. Firstly, relying solely on Moving Averages may lead to lagging signals, as they are based on past data. This can result in missed opportunities or delayed responses to market changes. Moreover, this approach fails to consider other essential factors such as volume, market sentiment, or fundamental analysis which could impact TQQQ's price movement. Lastly, Moving Averages are prone to produce false signals during volatile market conditions, leading to potential losses. Hence, utilizing additional indicators and strategies is crucial for a well-rounded and informed TQQQ trading approach.
Simple Moving Averages (SMA) and Exponential Moving Averages (EMA) are both popular technical indicators used in the analysis of financial markets. The key difference lies in the calculation methodology. SMAs give equal weightage to each data point over a specified period, while EMAs assign more weightage to recent data points. This makes EMAs more responsive to recent price changes, making them suitable for short-term analysis and faster reactions to market trends. SMAs, on the other hand, provide a smoother average over a longer period, making them better suited for long-term analysis and identifying overall trends.
The impact of macroeconomic indicators on the accuracy of Moving Averages in TQQQ trading can be significant. Macro indicators such as GDP growth, inflation, or interest rates can heavily influence the overall market sentiment and investor behavior. Moving averages rely on historical price data to identify trends, and these trends can be influenced by macroeconomic conditions. Changes in economic indicators may lead to shifts in market direction, affecting the accuracy of moving averages in predicting future price movements. Therefore, closely monitoring and considering macro indicators can enhance the effectiveness of moving averages in TQQQ trading.
The Golden Cross indicator on TQQQ charts is a bullish signal generated when the shorter-term moving average, such as the 50-day moving average, crosses above the longer-term moving average, typically the 200-day moving average. This suggests a potential uptrend in the TQQQ, a leveraged ETF for the Nasdaq 100 index. Traders often interpret this crossover as a sign to enter long positions, as it indicates strengthening momentum and a potential sustained rally. However, it's important to consider other factors and use additional technical analysis tools for accurate decision-making.
Conclusion
In conclusion, TQQQ moving averages trading strategies using EMAs and SMAs are essential tools for navigating the volatile market. By analyzing the TQQQ moving averages, investors can gain insights into stock performance and make well-informed investment choices. However, it is important to use moving averages in conjunction with other technical analysis tools, choose appropriate timeframes, adapt strategies to changing market conditions, and experiment with different MA types. Traders can also use moving averages to identify support and resistance levels and monitor indicators like the Death Cross to mitigate risks. Overall, moving averages can assist investors in timing entries and exits, providing valuable data for ETF trading strategies.

Successful traders rely on backtesting to be profitable.
Be like them with our
Free Backtesting Guide