-
 Create
account -
 Build trading strategies
with no code -
 Validate
& Backtest -
 Connect exchange
& start earning
Quantitative Strategies & Backtesting results for QQQ
Here are some QQQ trading strategies along with their past performance. You can validate these strategies (and many more) for free on Vestinda across thousands of assets and many years of historical data.
Quantitative Trading Strategy: ATR Breakout Strategy on QQQ
Based on the backtesting results for a trading strategy from November 20, 2016 to November 20, 2023, the statistics reveal some interesting findings. The profit factor stands at 1.25, indicating that the strategy generated 25% more profit than the total loss incurred. The annualized return on investment (ROI) is 1.7%, which suggests a modest but positive growth rate over the period. On average, positions were held for 9 weeks, implying a longer-term approach. With an average of 0.05 trades per week, the strategy appears to be relatively low frequency. The total number of closed trades was 19, with a winning trades percentage of 47.37% and a return on investment of 12.15%. Overall, the strategy demonstrates some potential, albeit with room for improvement.
Choose another period and try again.
Quantitative Trading Strategy: Keltner Channel and ZLEMA Trend-Following on QQQ
According to the backtesting results, the trading strategy implemented from November 2, 2016 to November 2, 2023, yielded promising statistics. The profit factor stands at 1.87, indicating a favorable return on investment. The annualized ROI amounted to 10.92%, showcasing a consistent and steady growth for the strategy over the evaluated period. On average, the holding time for trades was roughly two weeks and four days, indicating a relatively short-term investment approach. The strategy generated an average of 0.19 trades per week, emphasizing a cautious and selective approach. With a total of 72 closed trades, the return on investment reached an impressive 78.02%. Additionally, the strategy achieved a 50% winning trade percentage, signifying a balanced performance between profitable and losing trades.
Choose another period and try again.
QQQ Moving Averages Trading Strategies: Unlocking Consistent Gains
Introduction
The Invesco QQQ ETF (QQQ) is one of the most popular and actively traded ETFs, tracking the performance of the Nasdaq-100 Index. Given its liquidity and volatility, QQQ presents numerous trading opportunities for both short-term and long-term traders. One of the most effective ways to capitalize on these opportunities is through moving averages, which help traders identify trends and make informed decisions. In this article, we’ll explore various QQQ moving averages trading strategies, offering insights on how to use them to achieve consistent gains.
What Are Moving Averages?
Overview: Moving averages are technical indicators that smooth out price data to identify the direction of the trend. They are calculated by averaging the closing prices over a specific number of periods.
Types of Moving Averages:
- Simple Moving Average (SMA): The average of the closing prices over a specific period.
- Exponential Moving Average (EMA): Similar to the SMA but gives more weight to recent prices, making it more responsive to recent market activity.
Why Use Moving Averages for QQQ?
- Trend Identification: Moving averages help traders determine the direction of the trend, whether bullish, bearish, or neutral.
- Support and Resistance: Moving averages often act as dynamic support and resistance levels, providing key entry and exit points.
- Signal Confirmation: Moving averages can confirm signals from other technical indicators, improving the accuracy of trading decisions.
Key QQQ Moving Averages Trading Strategies
Golden Cross and Death Cross Strategy
Concept: The Golden Cross and Death Cross are powerful signals that indicate potential trend reversals.
How to Implement:
- Golden Cross: Occurs when the 50-day moving average crosses above the 200-day moving average, signaling a potential upward trend. Consider entering a long position when this cross occurs.
- Death Cross: Occurs when the 50-day moving average crosses below the 200-day moving average, signaling a potential downward trend. Consider entering a short position or exiting long positions when this cross occurs.
Application: This strategy is ideal for capturing long-term trends and can be used with either SMA or EMA.
Dual Moving Average Crossover Strategy
Concept: Utilize two moving averages with different periods to identify short-term and long-term trends.

How to Implement:
- Short-Term MA: Use a 10-day EMA to represent the short-term trend.
- Long-Term MA: Use a 50-day EMA to represent the long-term trend.
- Buy Signal: When the short-term MA crosses above the long-term MA, it signals a bullish trend, indicating a potential buy opportunity.
- Sell Signal: When the short-term MA crosses below the long-term MA, it signals a bearish trend, indicating a potential sell opportunity.
Application: This strategy is effective for swing trading and can help traders capture intermediate-term trends.
Moving Average Bounce Strategy
Concept: Trade based on price bounces off a key moving average, which often acts as a dynamic support or resistance level.
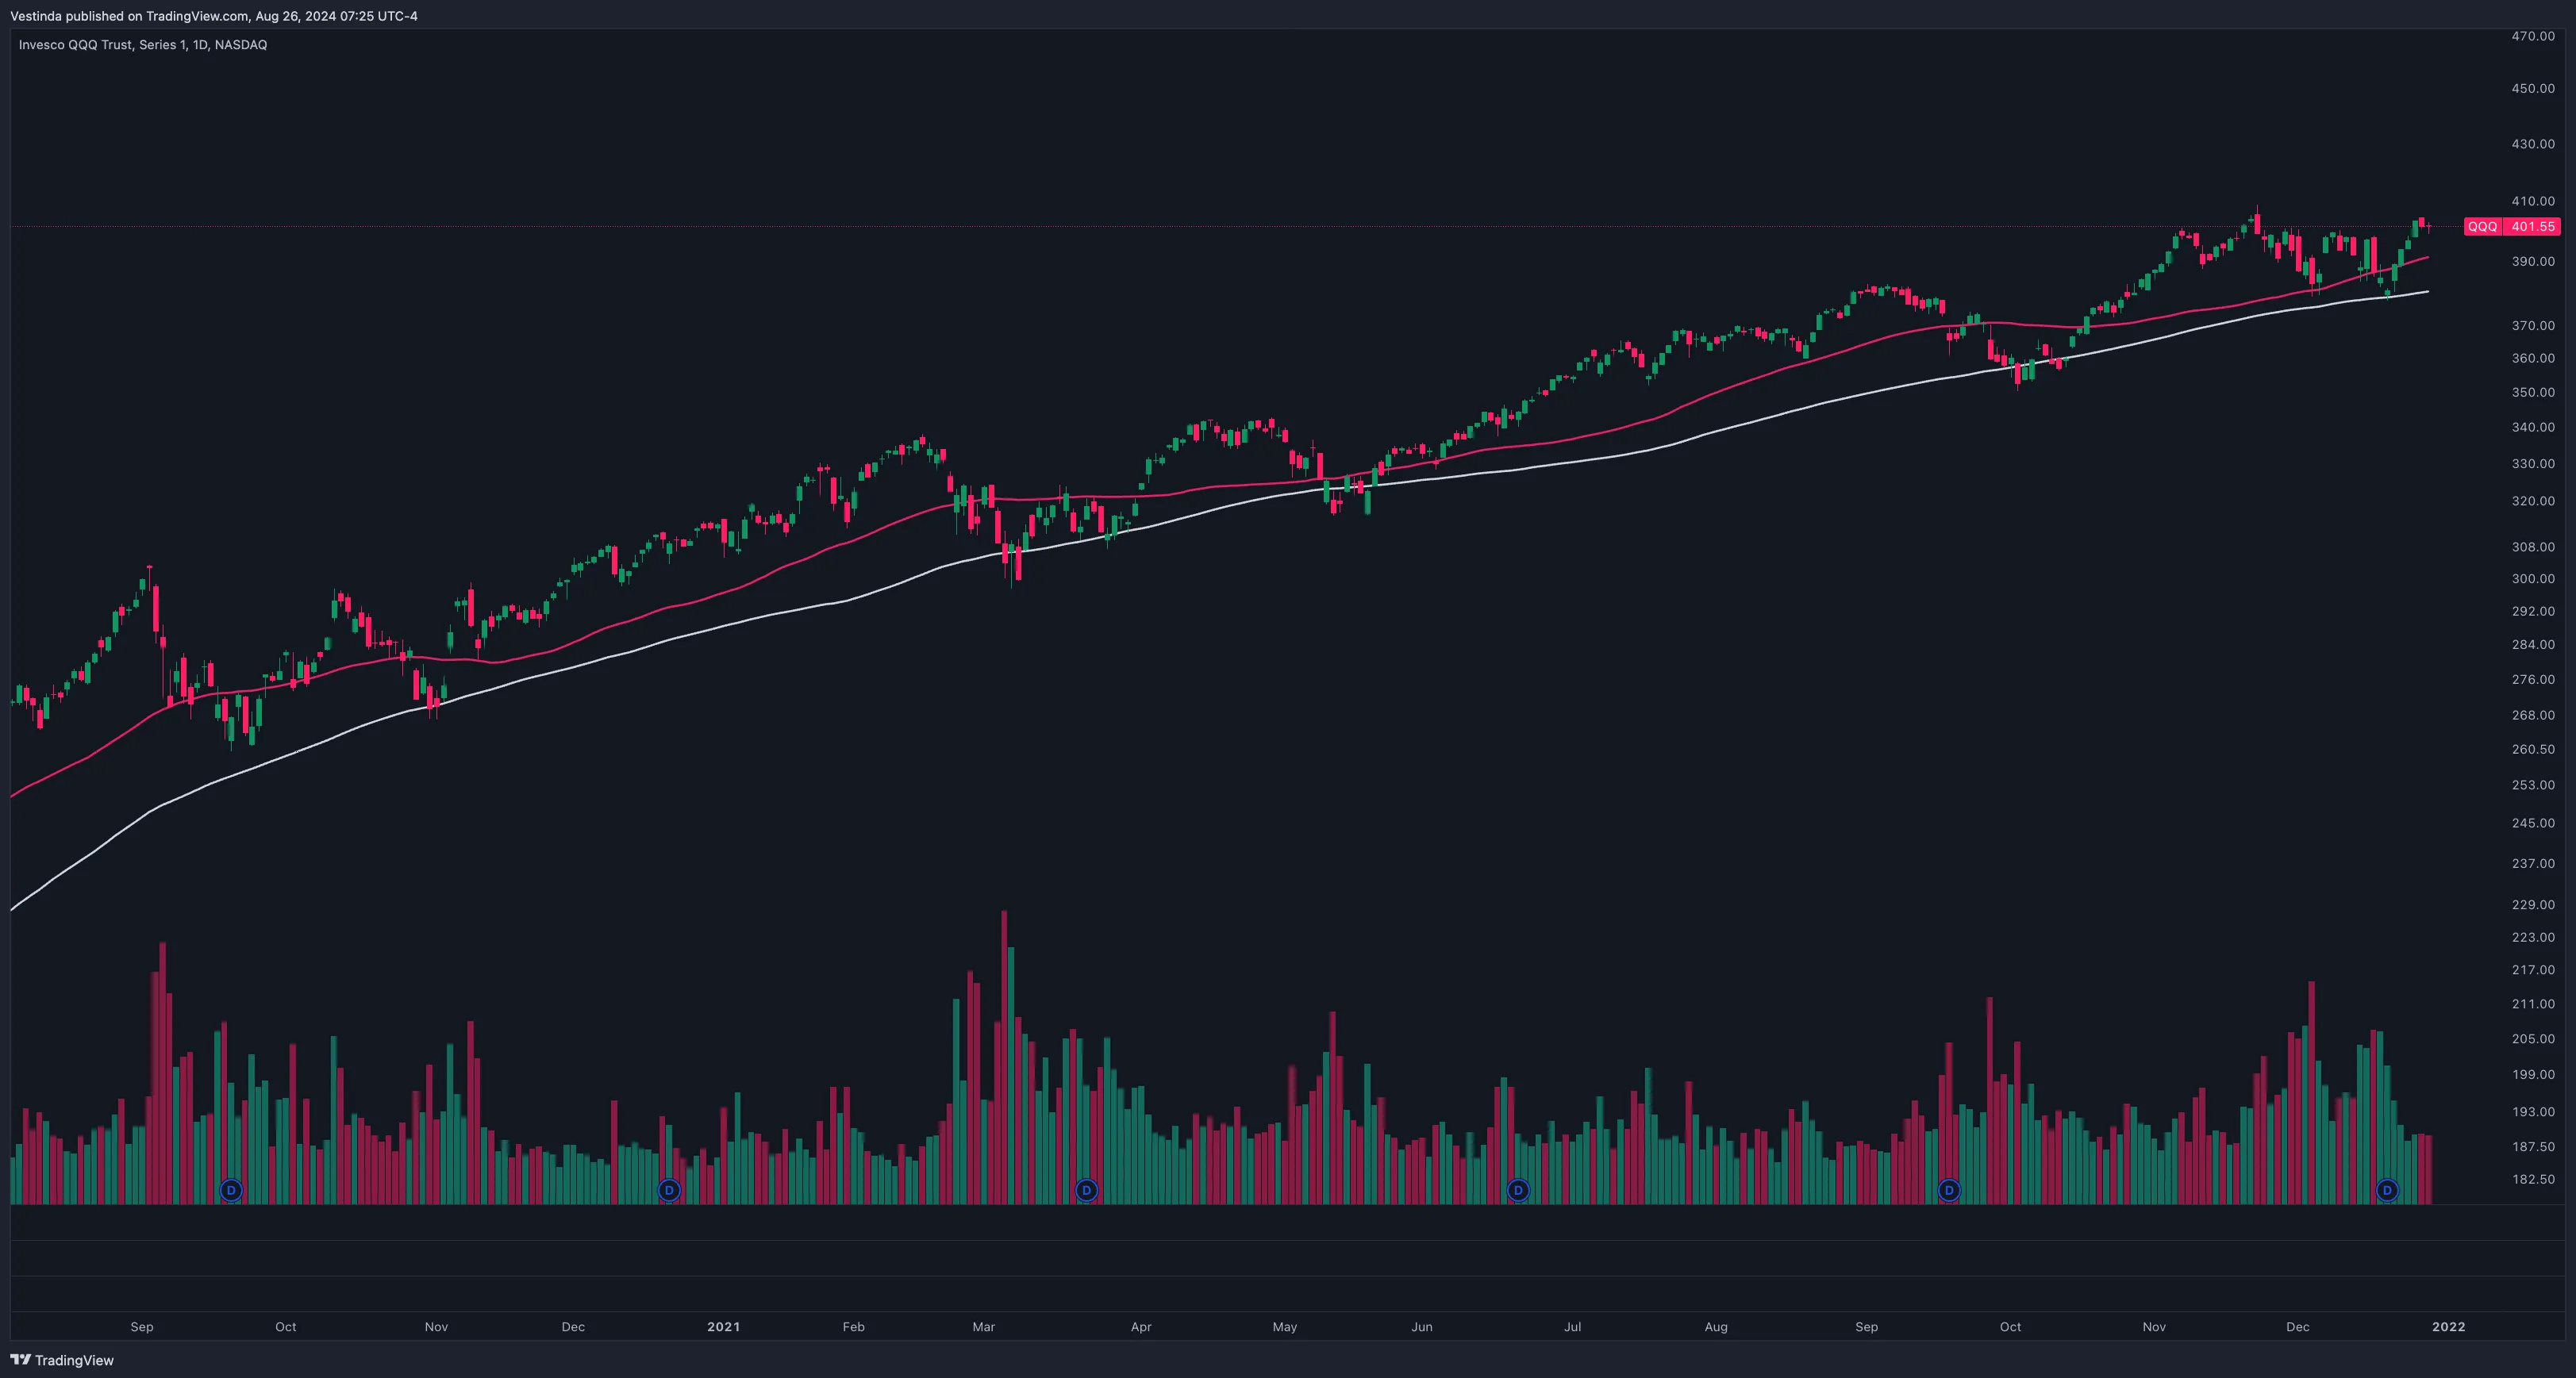
How to Implement:
- Indicators: Use a 50-day or 100-day SMA as a support or resistance level.
- Buy Signal: Enter a long position when the price pulls back to the moving average and then bounces upward, confirming the moving average as support.
- Sell Signal: Enter a short position when the price rallies to the moving average and then reverses downward, confirming the moving average as resistance.
Application: This strategy works well in trending markets where the moving average serves as a reliable level of support or resistance.
Moving Average Ribbon Strategy
Concept: Use multiple moving averages of different periods to create a "ribbon" that visualizes the strength and direction of the trend.
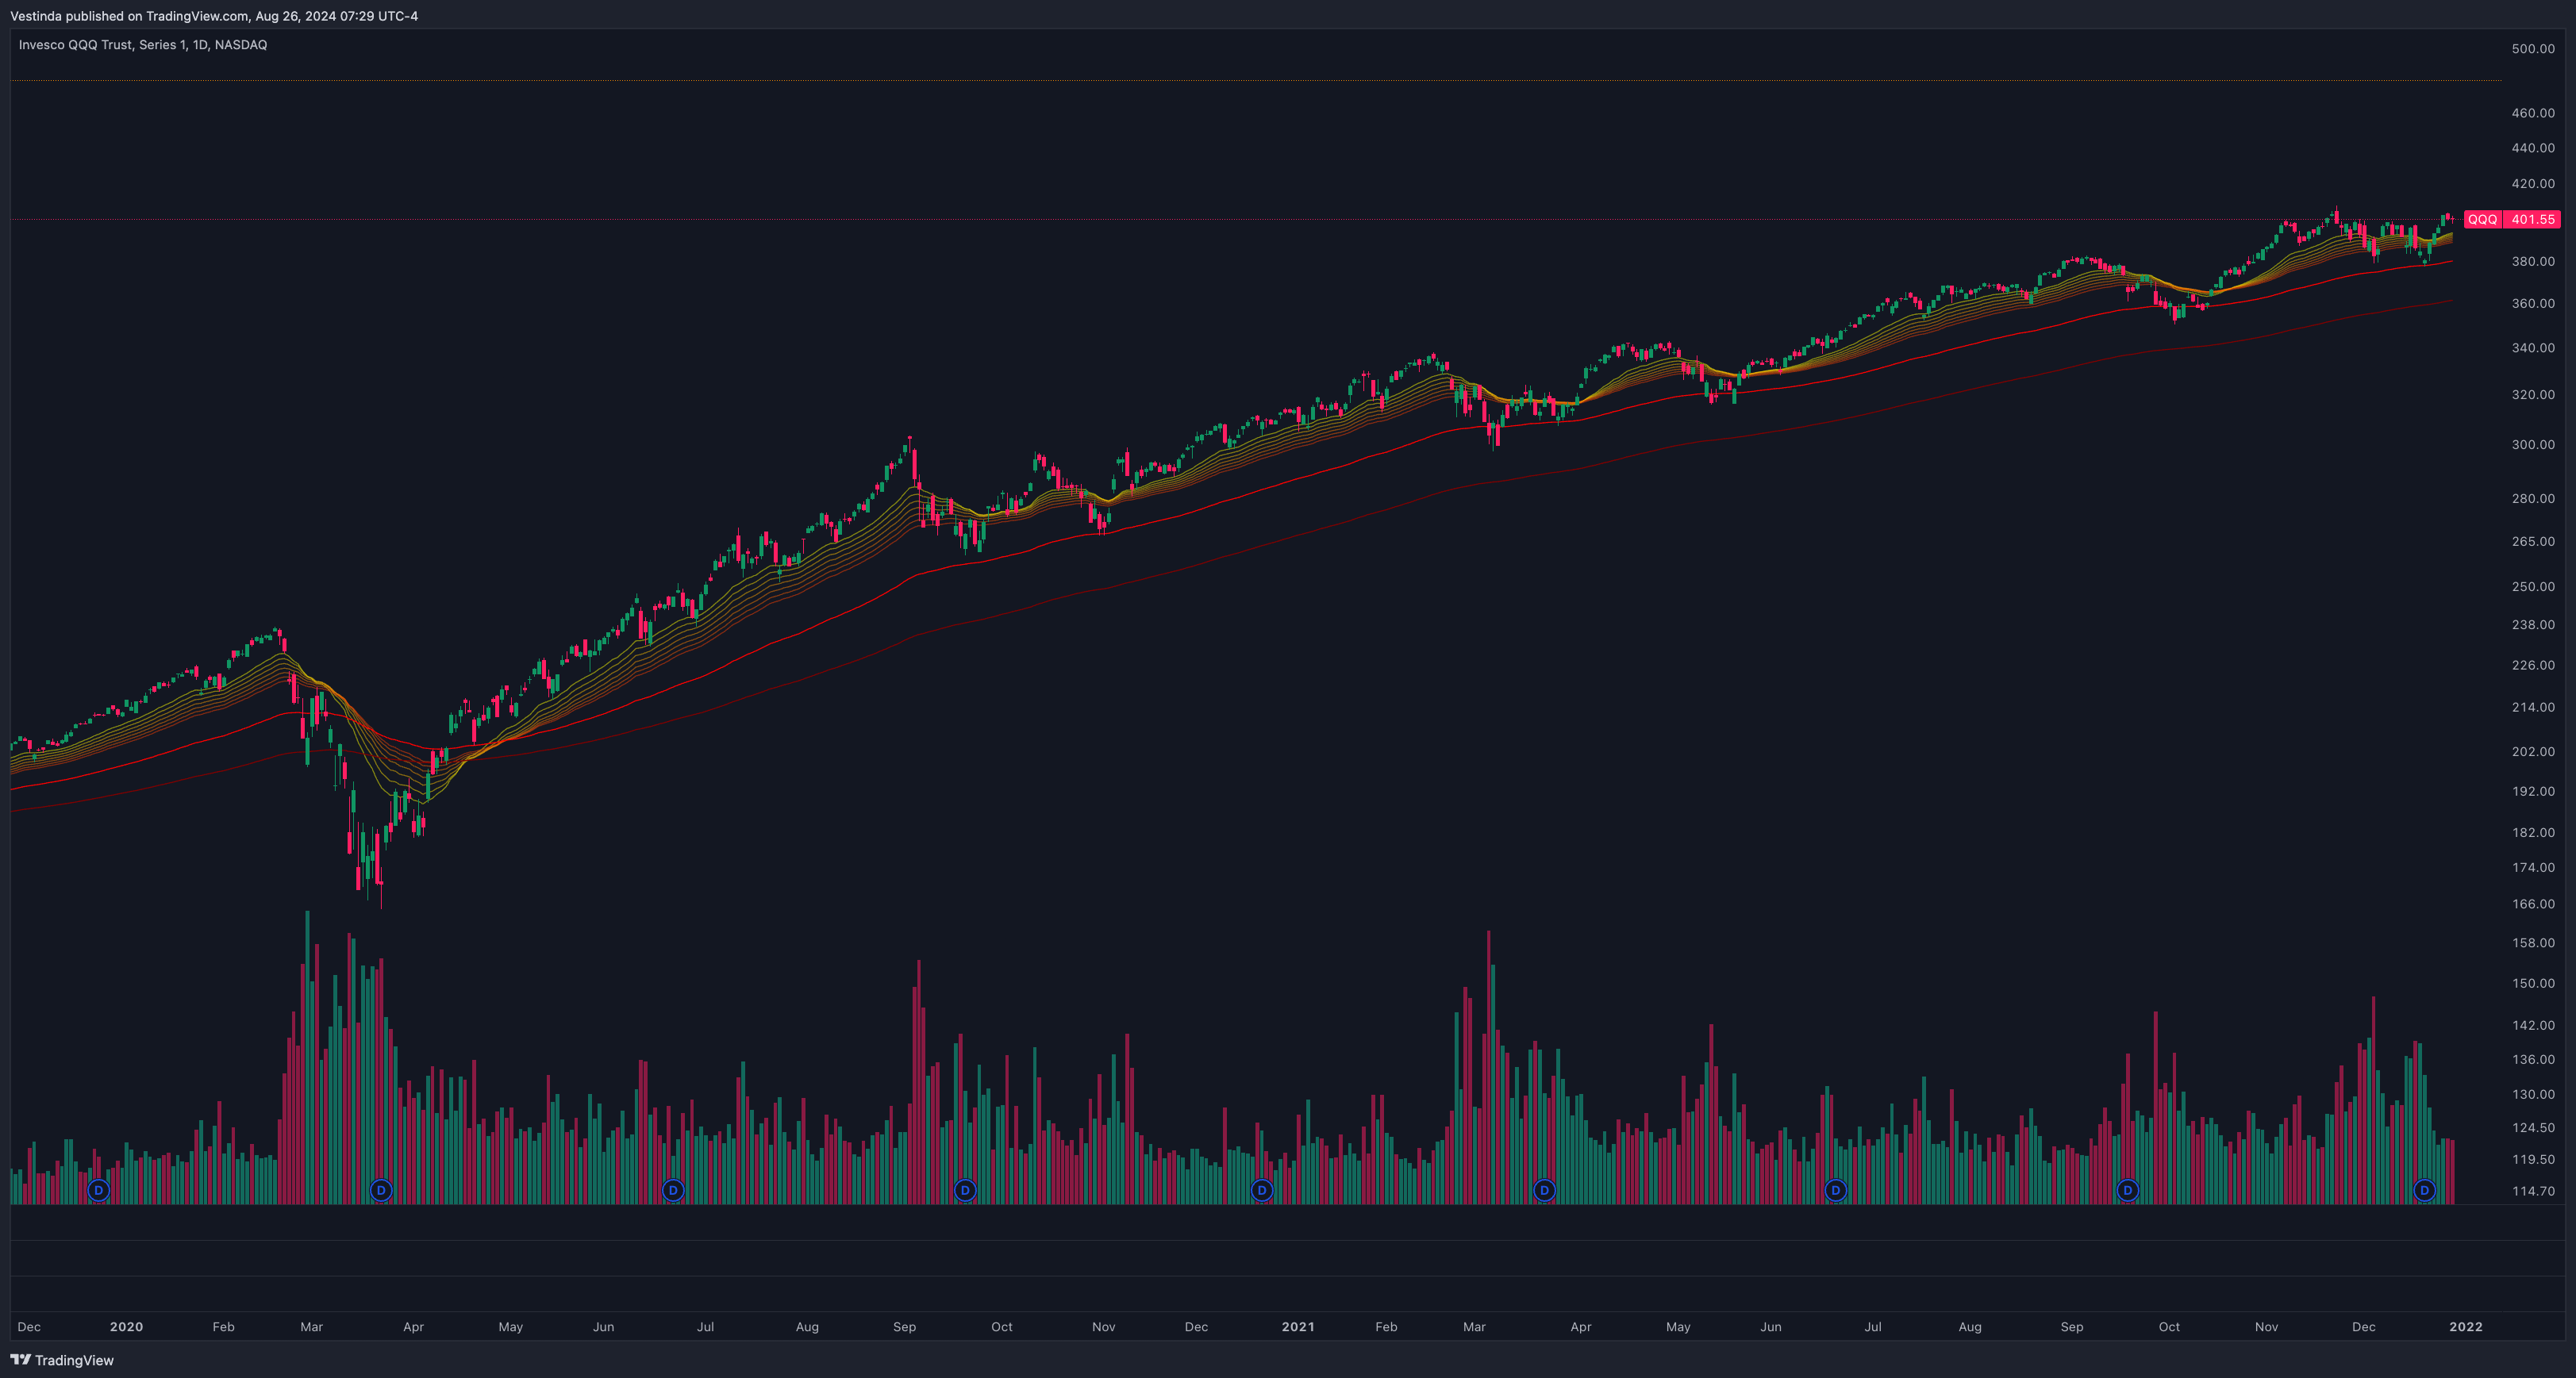
How to Implement:
- Indicators: Use a combination of 20, 25, 30, 35, 40, 45, 50, 100, and 200-day EMAs.
- Buy Signal: When all moving averages align in an upward direction (shorter periods above longer periods), it indicates a strong bullish trend. Consider entering a long position.
- Sell Signal: When all moving averages align in a downward direction (longer periods above shorter periods), it indicates a strong bearish trend. Consider entering a short position.
Application: The Moving Average Ribbon is ideal for visualizing trend strength and can help traders stay in profitable trades longer.
Using Moving Averages in Different Market Conditions
- Trending Markets: Moving averages are most effective in trending markets, where they can help traders identify the direction and strength of the trend.
- Ranging Markets: In ranging markets, moving averages can be less effective. Consider using them in combination with other indicators, such as RSI or Bollinger Bands, to filter out false signals.
Benefits of Using Moving Averages for QQQ Trading
- Clarity in Decision-Making: Moving averages simplify the analysis by smoothing out price data, making it easier to identify trends.
- Versatility: Moving averages can be used across different timeframes, making them suitable for day trading, swing trading, and long-term investing.
- Signal Confirmation: By combining moving averages with other indicators, traders can improve the accuracy of their trading signals.
Optimal Timeframe Selection for QQQ Moving Averages
Choosing the right timeframes for moving averages is crucial for effective technical analysis. Shorter timeframes, such as 5 or 10 days, are more responsive to price changes, providing traders with timely buy or sell signals. These short-term moving averages are suitable for active traders who seek quick profits. On the other hand, longer timeframes, like 50 or 200 days, are slower to react, offering a broader perspective and identifying long-term trends. These moving averages are commonly used by long-term investors as they filter out short-term noise in the market. Combining different timeframes can provide a more comprehensive analysis, where short-term signals are validated by long-term trends. For example, in the case of QQQ, a trader might use a 10-day and 50-day moving average to confirm buy or sell signals, respectively. Ultimately, the choice of timeframe depends on trading or investment goals, risk tolerance, and personal trading style.
Dynamic MA Strategies for QQQ Market Conditions
Adapting moving average strategies to market conditions is crucial for successful trading. Short-term moving averages can help capture quick momentum shifts, while longer-term moving averages provide a broader view of the market. By adjusting the timeframe and length of moving averages, traders can identify trends and potential reversals. For example, in a volatile market, a shorter-term moving average may be more effective, as it responds quicker to price changes. On the other hand, during periods of consolidation, a longer-term moving average may provide more reliable signals. It is important to consider the specific market being traded, as different securities may require different moving average settings. For instance, the QQQ, an exchange-traded fund tracking the performance of the Nasdaq 100, often responds well to shorter-term moving averages due to its technology-heavy composition. Overall, adapting moving average strategies to market conditions enhances trading effectiveness and increases the probability of successful trades.
Quantifying Risks: Moving Averages and QQQ
One risk management technique with moving averages involves using them as support and resistance levels. Short sentences. For example, if the price of QQQ is above its 50-day moving average, it may act as a support level. Longer sentence. Traders can set a stop-loss order just below the moving average to limit their potential losses if the price drops below this level. Short sentence. Another technique is to use moving average crossovers to identify trend reversals. Short sentence. When the shorter-term moving average crosses above the longer-term moving average, it could indicate the start of an uptrend. Short sentence. Conversely, when the shorter-term moving average crosses below the longer-term moving average, it could signal a downtrend. Short sentence. By using moving averages as risk management tools, traders can better assess and manage their exposure to potential market risks. Longer sentence.
-
100,000 available assets New
-
years of historical data
-
practice without risking money

Frequently Asked Questions
To use Moving Averages (MAs) to identify support and resistance levels in QQQ charts, start by plotting a short-term MA (e.g., 50-day) and a long-term MA (e.g., 200-day) on the chart. When the price fluctuates above the moving averages, they act as support levels. Conversely, when the price moves below the moving averages, they become resistance levels. Additionally, look for crossovers between the MAs; when the short-term MA crosses above the long-term MA, it suggests a bullish trend and potential support level, whereas a bearish crossover indicates a resistance level. Regularly analyzing these indicators can help assess key support and resistance levels in QQQ charts.
Using Moving Averages as the sole indicator in QQQ trading has a few drawbacks. Firstly, they often lag behind the market, causing delayed signals and potential missed opportunities. Additionally, they are susceptible to false signals during periods of market volatility. Moving Averages also struggle to capture rapid price reversals or trend changes accurately. Furthermore, they do not consider other vital factors such as volume or market sentiment. Relying solely on Moving Averages may lead to a limited and incomplete analysis of the QQQ trading environment, potentially resulting in suboptimal decision-making.
Fundamental factors can significantly impact the interpretation of Moving Averages in QQQ analysis. The Moving Average is a technical indicator that smooths out price data over a specific period. However, fundamental factors like earnings reports, economic data, or geopolitical events can influence the price movement of the QQQ ETF. Consequently, these factors can cause the Moving Average to deviate from its usual trend or exhibit false signals. Therefore, it is crucial to consider both technical indicators like Moving Averages and fundamental factors when interpreting the QQQ analysis for a comprehensive understanding of the market conditions.
Institutional traders use Moving Averages (MAs) in QQQ markets to analyze price trends and determine potential support or resistance levels. They often focus on the 50-day and 200-day MAs, which act as key indicators of market sentiment. When the price is above the MA, it signals a bullish trend, while a price below the MA indicates a bearish trend. Traders use the crossovers between these MAs to identify potential entry or exit points. Additionally, MAs help institutional traders in identifying price reversals, confirming trend strength, and setting stop-loss levels to manage risk.
Moving Average signals can coincide with major news events affecting the QQQ (Nasdaq 100 ETF). For instance, when a significant news event impacts the market sentiment, it can lead to a crossover between short-term and long-term moving averages. Such crossovers may indicate a change in trend or momentum, providing a signal for traders to take potential positions. However, it is essential to combine technical analysis with fundamental analysis to determine the true impact of news events on the QQQ, ensuring a comprehensive understanding of the market dynamics.
Conclusion
In conclusion, QQQ Moving Averages Trading Strategies provide traders with valuable insights into the performance and trends of QQQ (Invesco Qqq Trust). By utilizing the exponential moving average (EMA) and simple moving average (SMA) indicators, traders can analyze historical data and identify patterns to predict future price movements. Choosing the right timeframes for moving averages is crucial, as shorter timeframes offer timely signals for active traders, while longer timeframes provide a broader perspective for long-term investors. Adapting moving average strategies to market conditions and using them as support and resistance levels enable traders to manage risks effectively. Overall, these strategies enhance trading effectiveness and increase the probability of successful trades.

Successful traders rely on backtesting to be profitable.
Be like them with our
Free Backtesting Guide