
-
Track your
Crypto Portfolio -
Copy Crypto trading
strategies -
Build trading strategies
with no code
-
Backtest trading strategies
on Crypto, Forex, Stocks, etc. -
Demo Trading
Risk-free Paper Trading -
Automate trading strategies
with Live Trading
Quant Strategies & Backtesting results for SPX
Here are some SPX trading strategies along with their past performance. You can validate these strategies (and many more) for free on Vestinda across thousands of assets and many years of historical data.
Quant Trading Strategy: Downtrend Scalping with Keltner Channel and True Range on SPX
The backtesting results for a trading strategy conducted from November 20, 2022, to November 20, 2023, reveal key statistical figures. The profit factor for this period stands at 0.98, indicating that the strategy's profit closely matched its losses. The annualized return on investment amounted to -0.61%, suggesting a slight negative performance. On average, positions were held for approximately 4 days and 17 hours, and there was an average of 1.26 trades per week. The strategy generated 66 closed trades during the specified timeframe. Moreover, the winning trades percentage was 36.36%, indicating that just over a third of trades resulted in profits.
 SPX
SPX

Choose another period and try again.
Quant Trading Strategy: ATR Breakout Strategy on SPX
The backtesting results of the trading strategy from November 20, 2016, to November 20, 2023, reveal some key statistics. The profit factor stands at 1.24, indicating that for every dollar risked, the strategy generated a profit of $1.24. The annualized return on investment (ROI) is 1.38%, which means that on average, the strategy yielded a 1.38% return per year. The average holding time for trades is 9 weeks and 4 days, suggesting that positions were held for a relatively long duration. With an average of 0.05 trades per week, the strategy is relatively inactive. A total of 21 trades were closed during the period, resulting in a return on investment of 9.89%. The percentage of winning trades is 52.38%, indicating a moderate success rate.
SPX
Choose another period and try again.
SPX (S&P 500) Moving Averages: Effective Trading Strategies
Introduction to Moving Averages
Moving averages are essential tools in technical analysis that help traders smooth out price data and identify trends. For the S&P 500 (SPX), moving averages can provide valuable insights into market direction, support, and resistance levels.
Key Moving Averages for SPX
1. 50-Day Moving Average (50-MA)

- Usage: Medium-term indicator.
- Strategy: Indicates bullish signals when the price is above the 50-MA and bearish signals when below.
- Support/Resistance: Acts as a dynamic support or resistance level.
2. 200-Day Moving Average (200-MA)

- Usage: Long-term trend indicator.
- Strategy: Confirms long-term trends. A move above suggests a potential bull market, while a move below indicates a bear market.
- Golden Cross/Death Cross: The intersection of the 50-MA and 200-MA can generate significant trading signals. A Golden Cross occurs when the 50-MA crosses above the 200-MA, signaling a potential bull market. Conversely, a Death Cross happens when the 50-MA crosses below the 200-MA, indicating a potential bear market.
3. 20-Day Moving Average (20-MA)

- Usage: Short-term trend indicator.
- Strategy: Helps identify short-term price momentum.
- Support/Resistance: Often serves as a short-term support or resistance level.
4. 100-Day Moving Average (100-MA)
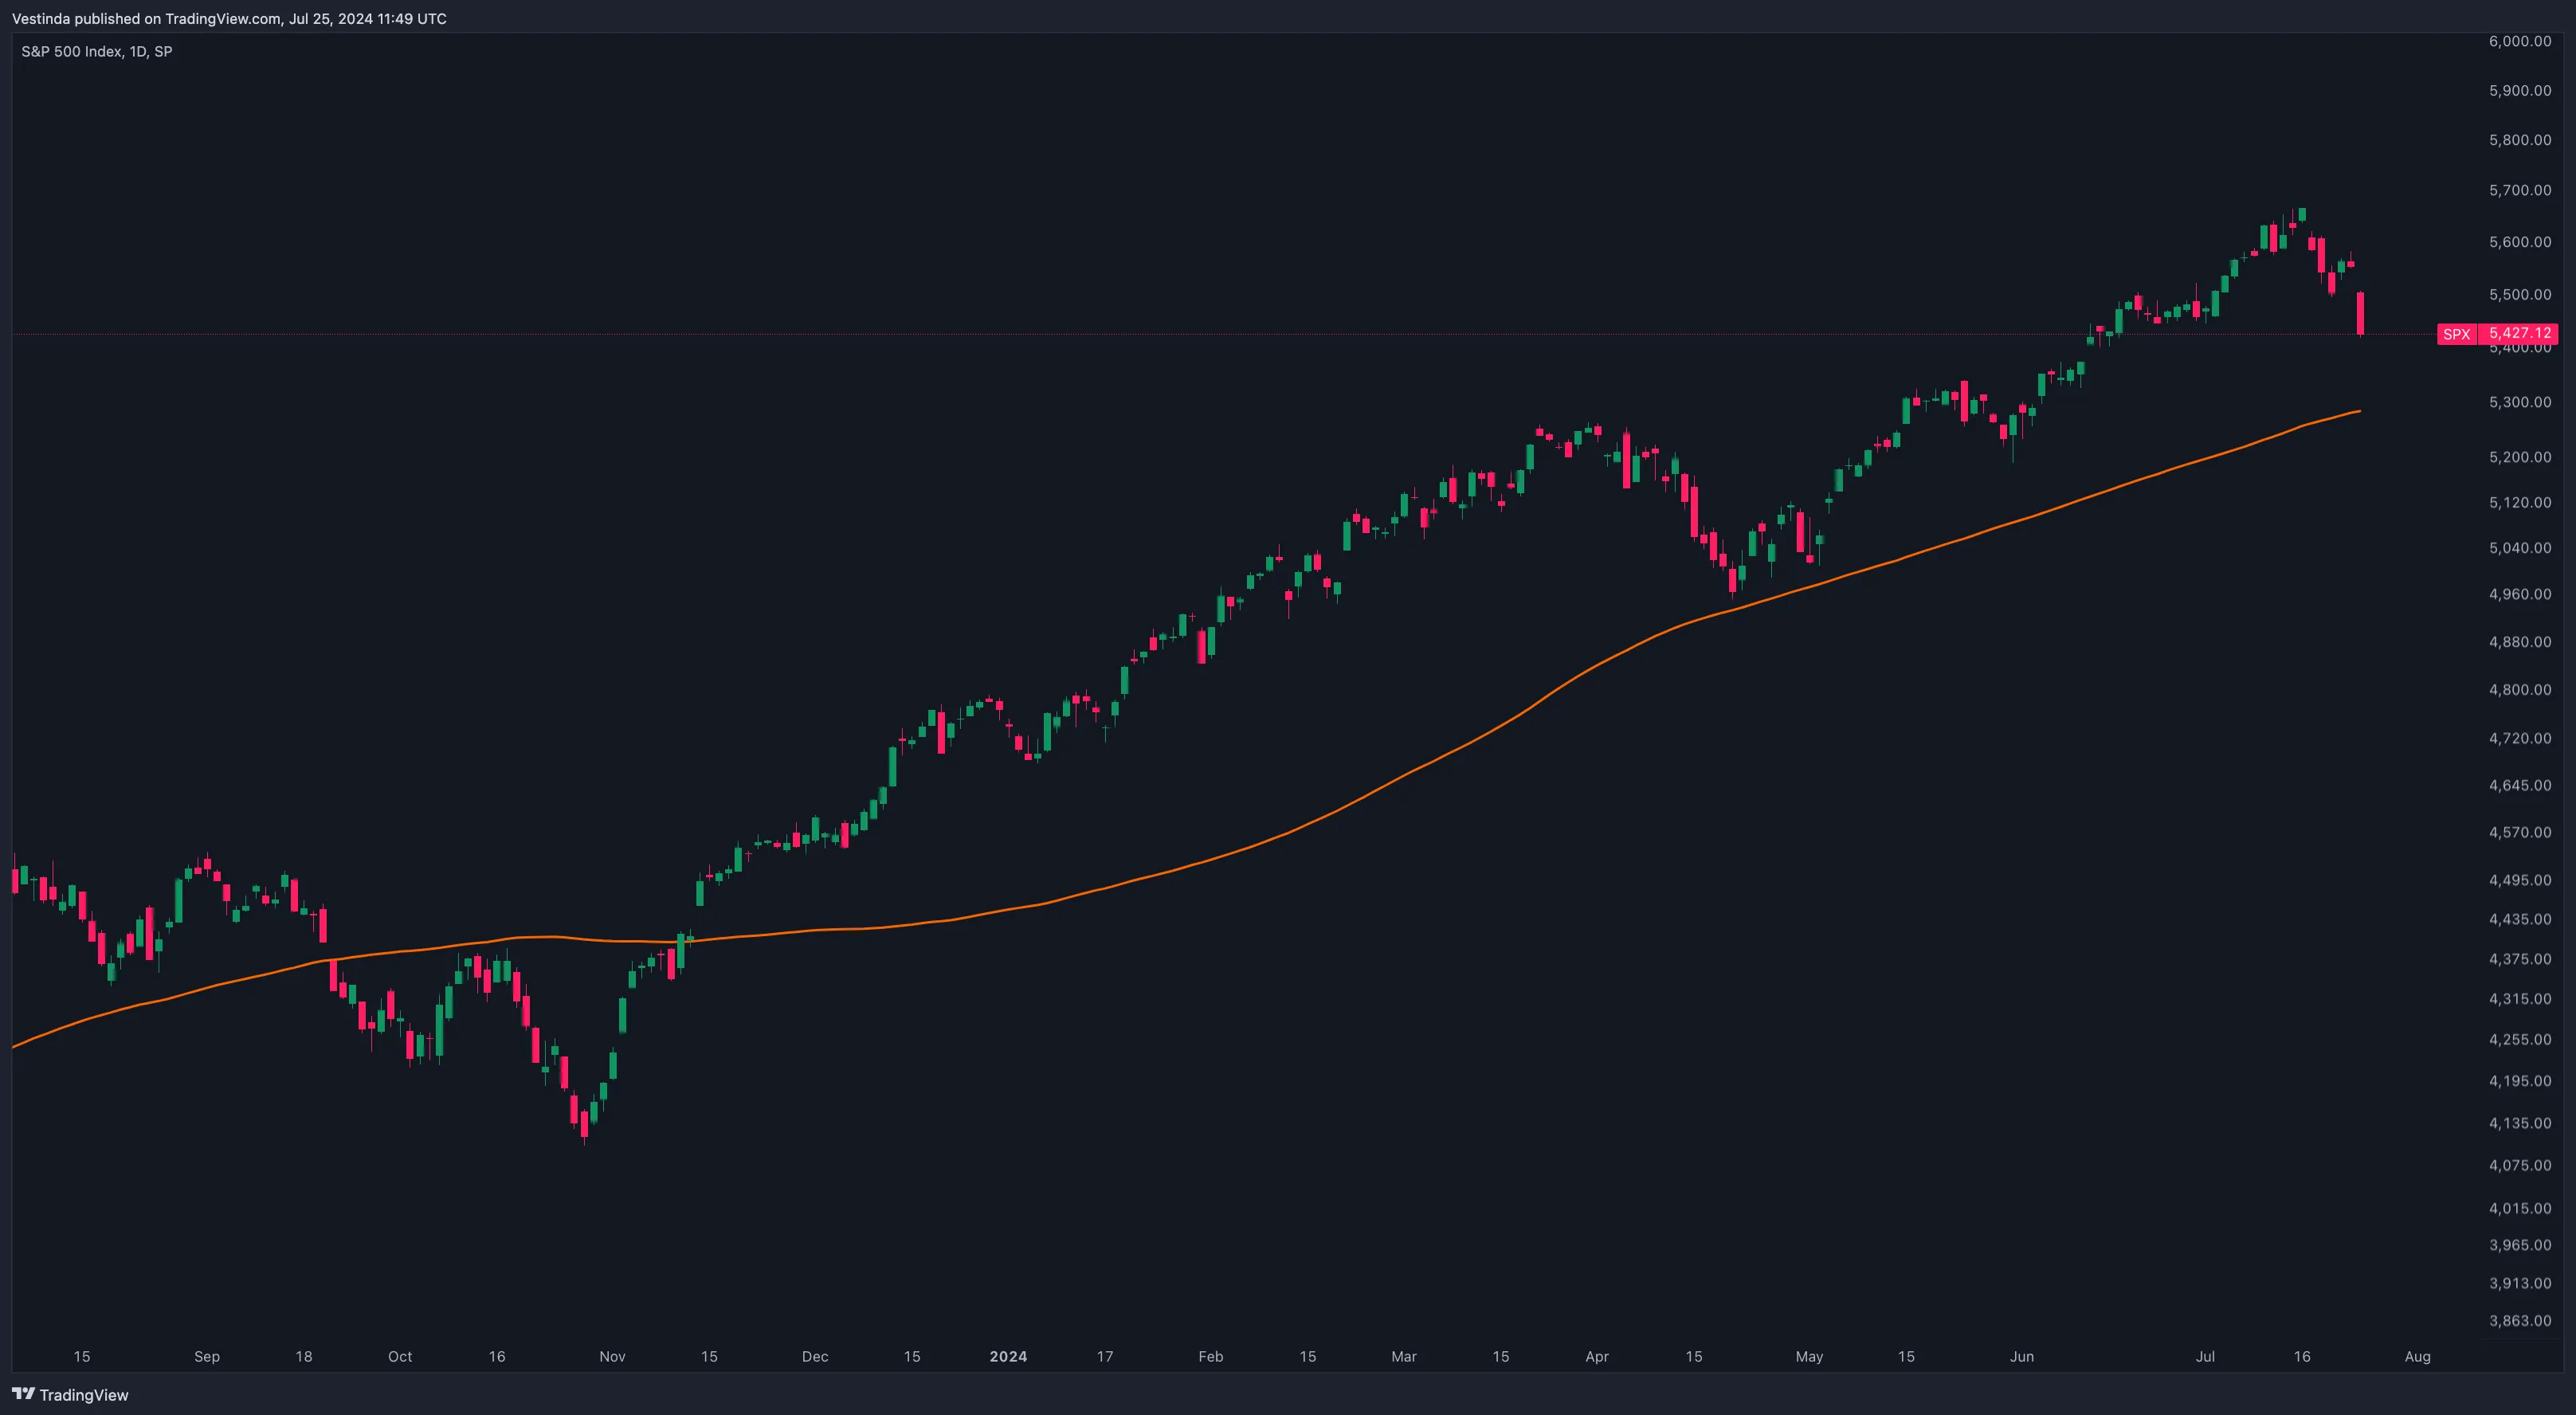
- Usage: Medium to long-term indicator.
- Strategy: Provides a balance between the short-term and long-term moving averages. Traders use it to gauge the intermediate trend of the SPX.
Effective Strategies Using Moving Averages
1. Moving Average Crossover Strategy

- Short-term crossover: Using a shorter MA (e.g., 20-day MA) crossing above a longer MA (e.g., 50-day MA) to generate buy signals, and crossing below to generate sell signals.
- Golden Cross/Death Cross: Using the 50-day and 200-day MAs for these signals can be particularly effective for identifying major trend shifts.

2. Moving Average Ribbon
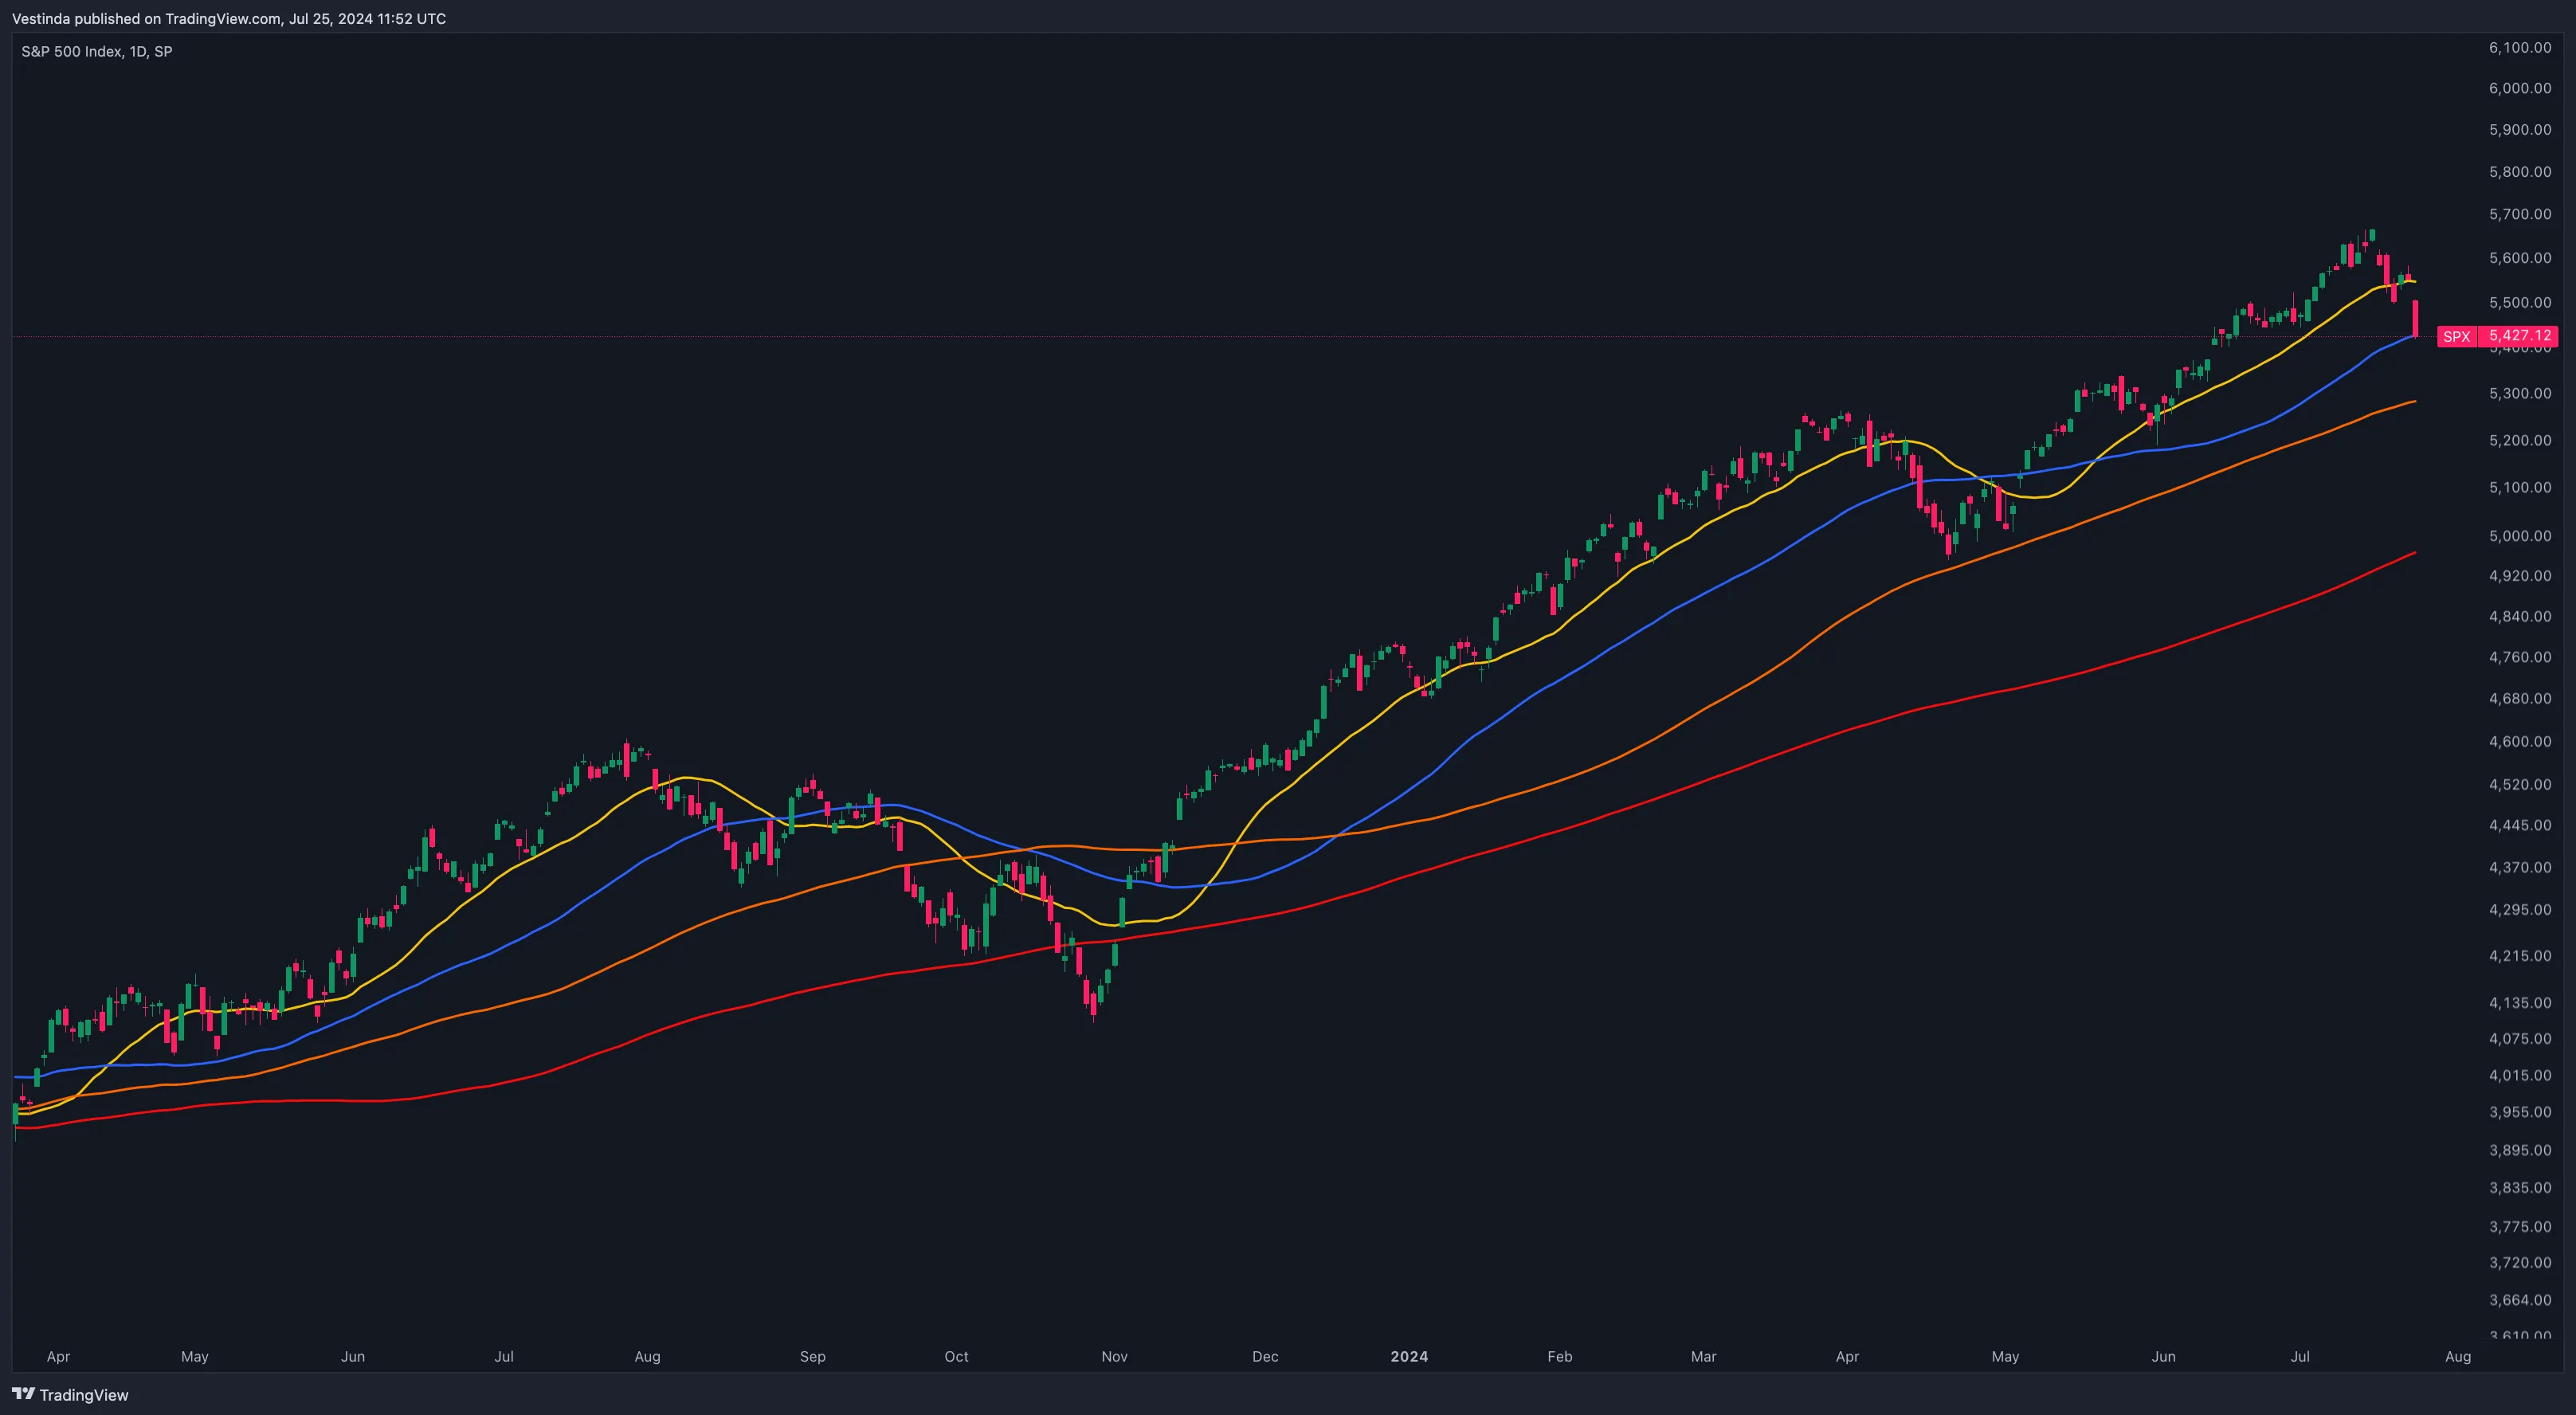
- Usage: Involves plotting multiple moving averages of different lengths on the same chart.
- Strategy: When all the moving averages are aligned (i.e., shortest on top, longest at the bottom), it indicates a strong trend. The opposite alignment indicates a strong downtrend.
Combining Moving Averages with Other Indicators
Enhancing moving average strategies with additional indicators can improve their effectiveness:

- RSI: Combines with moving averages to identify overbought or oversold conditions.
- MACD: Helps confirm moving average signals with momentum analysis.
- Bollinger Bands: Uses volatility bands to identify potential price reversals.
Historical Performance and Practical Examples
Historically, moving averages have shown effectiveness in identifying trends and significant support/resistance levels on the S&P 500. For instance, the 200-day moving average has often been respected as a long-term support level during bull markets and a resistance level during bear markets.
Example:
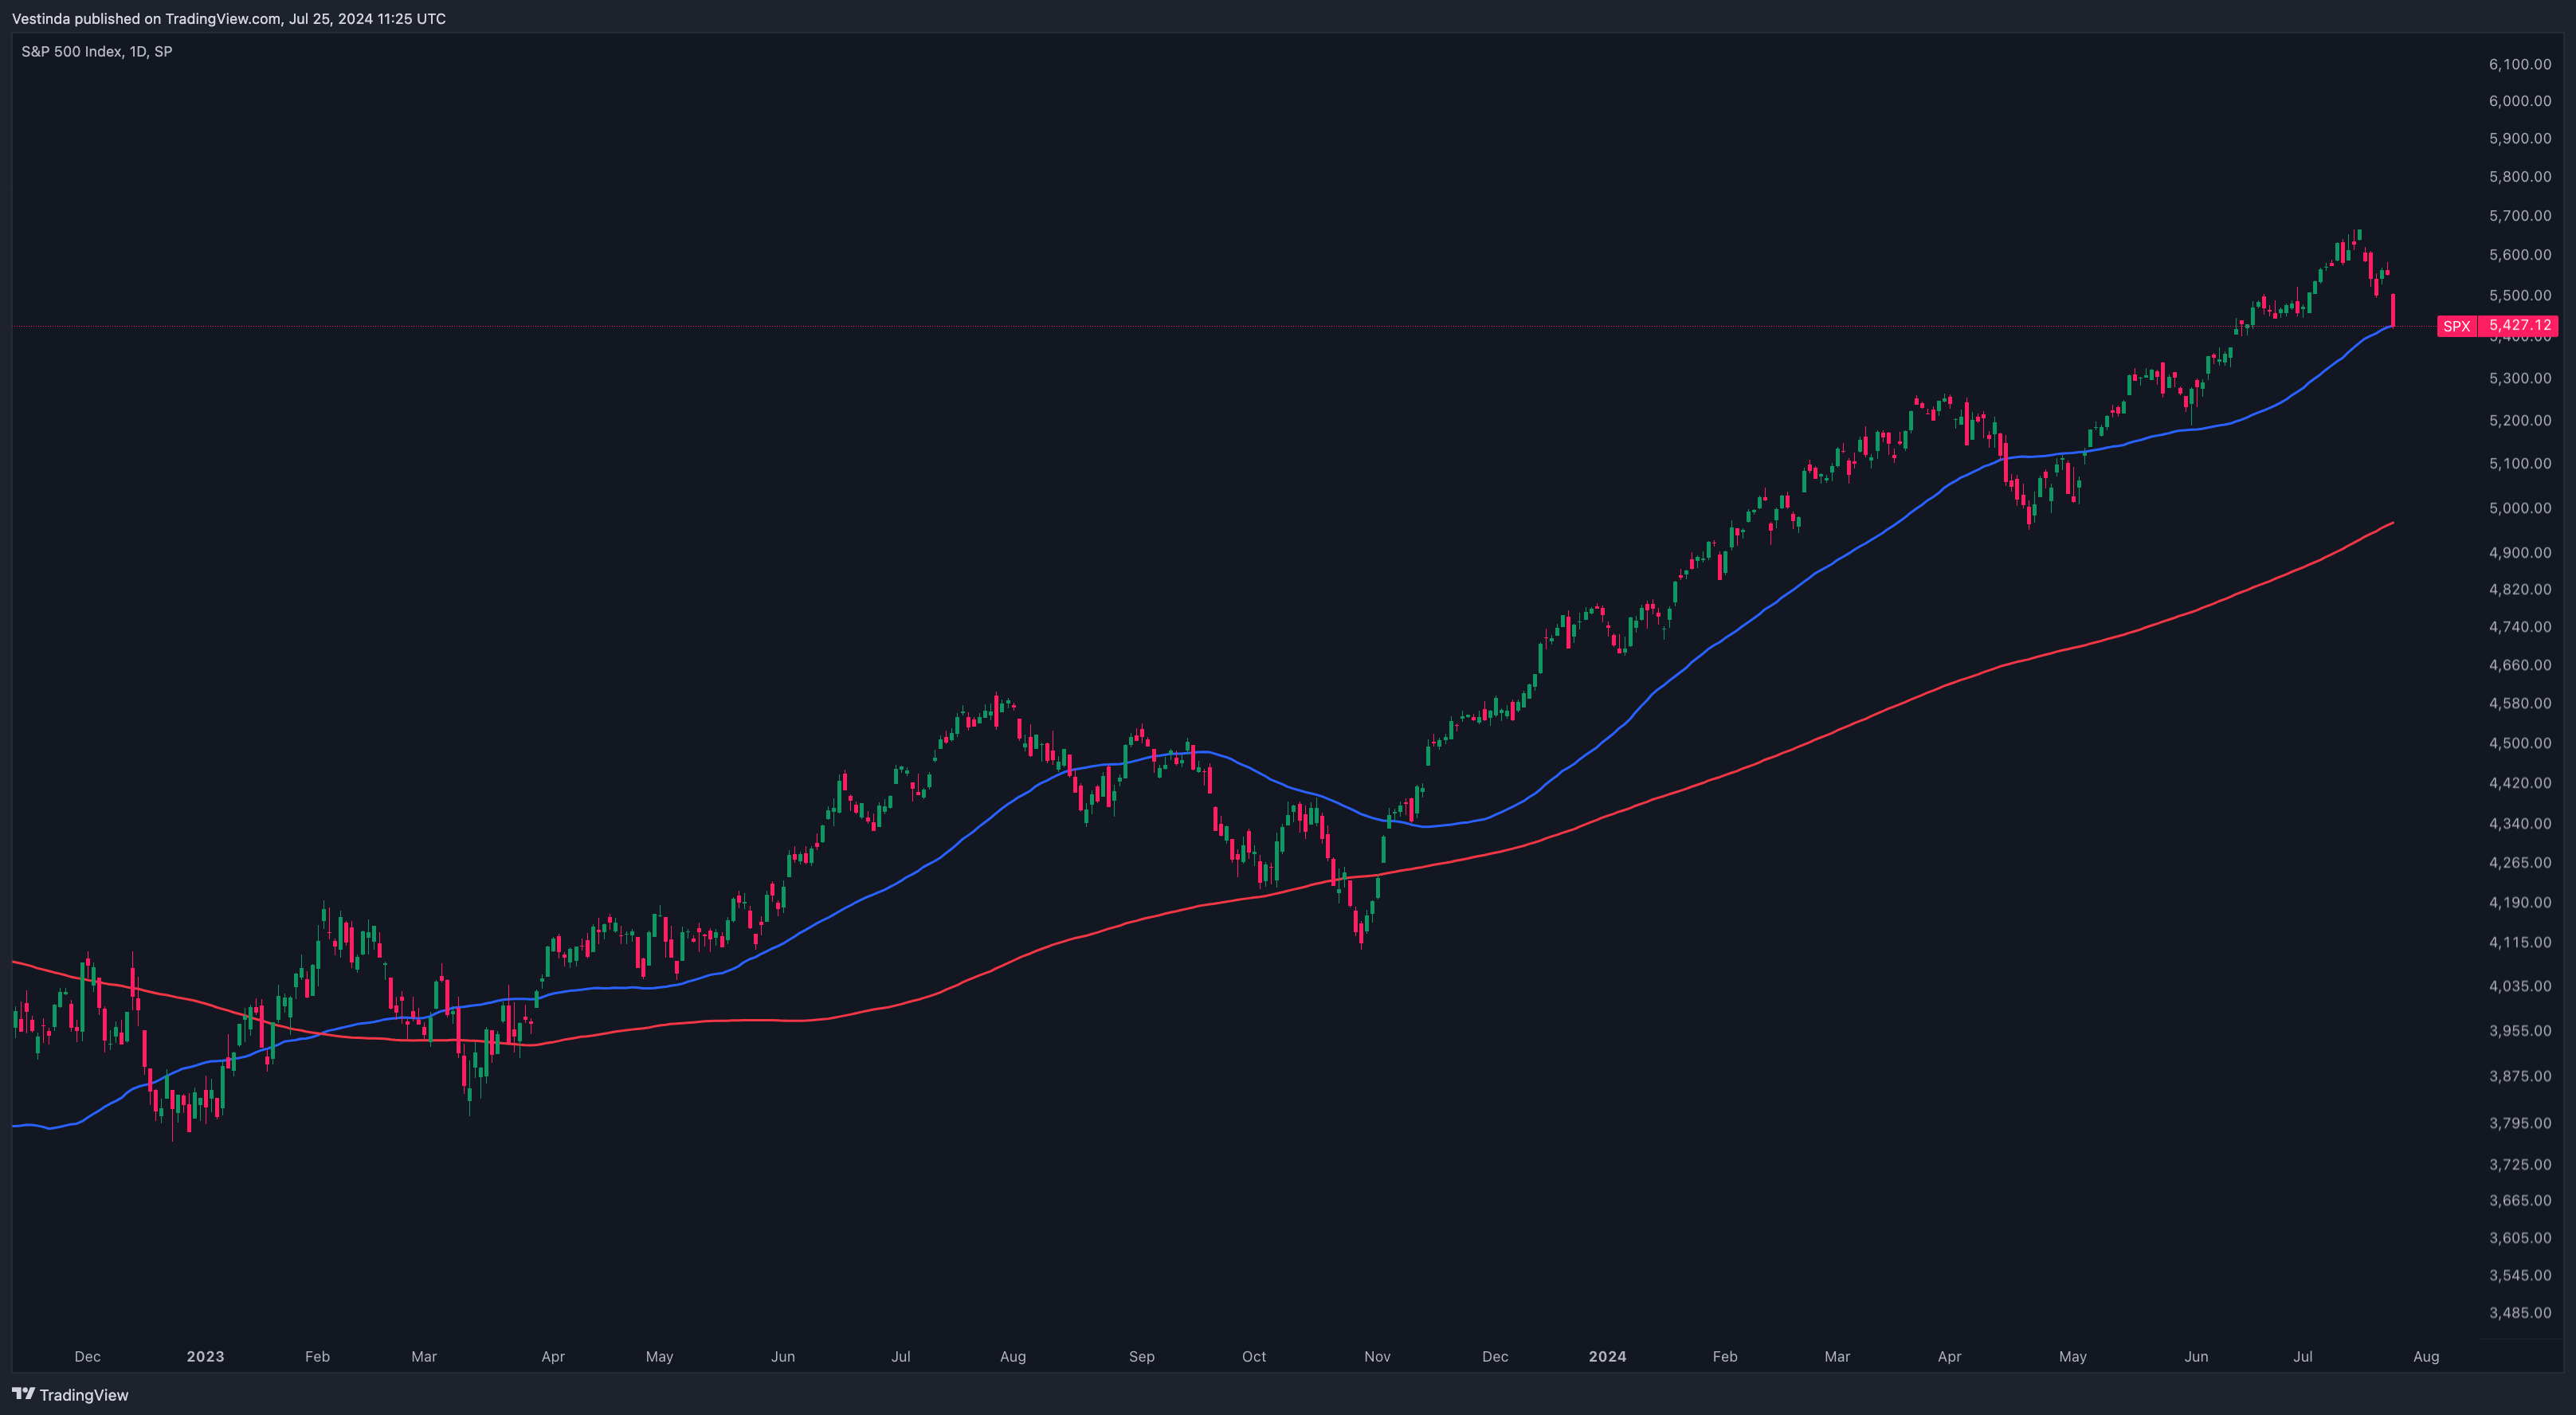
Golden Cross Example: If the 50-day MA crosses above the 200-day MA, it typically signals a strong bullish trend. For instance, a Golden Cross in 2023 preceded a significant rally in the SPX.
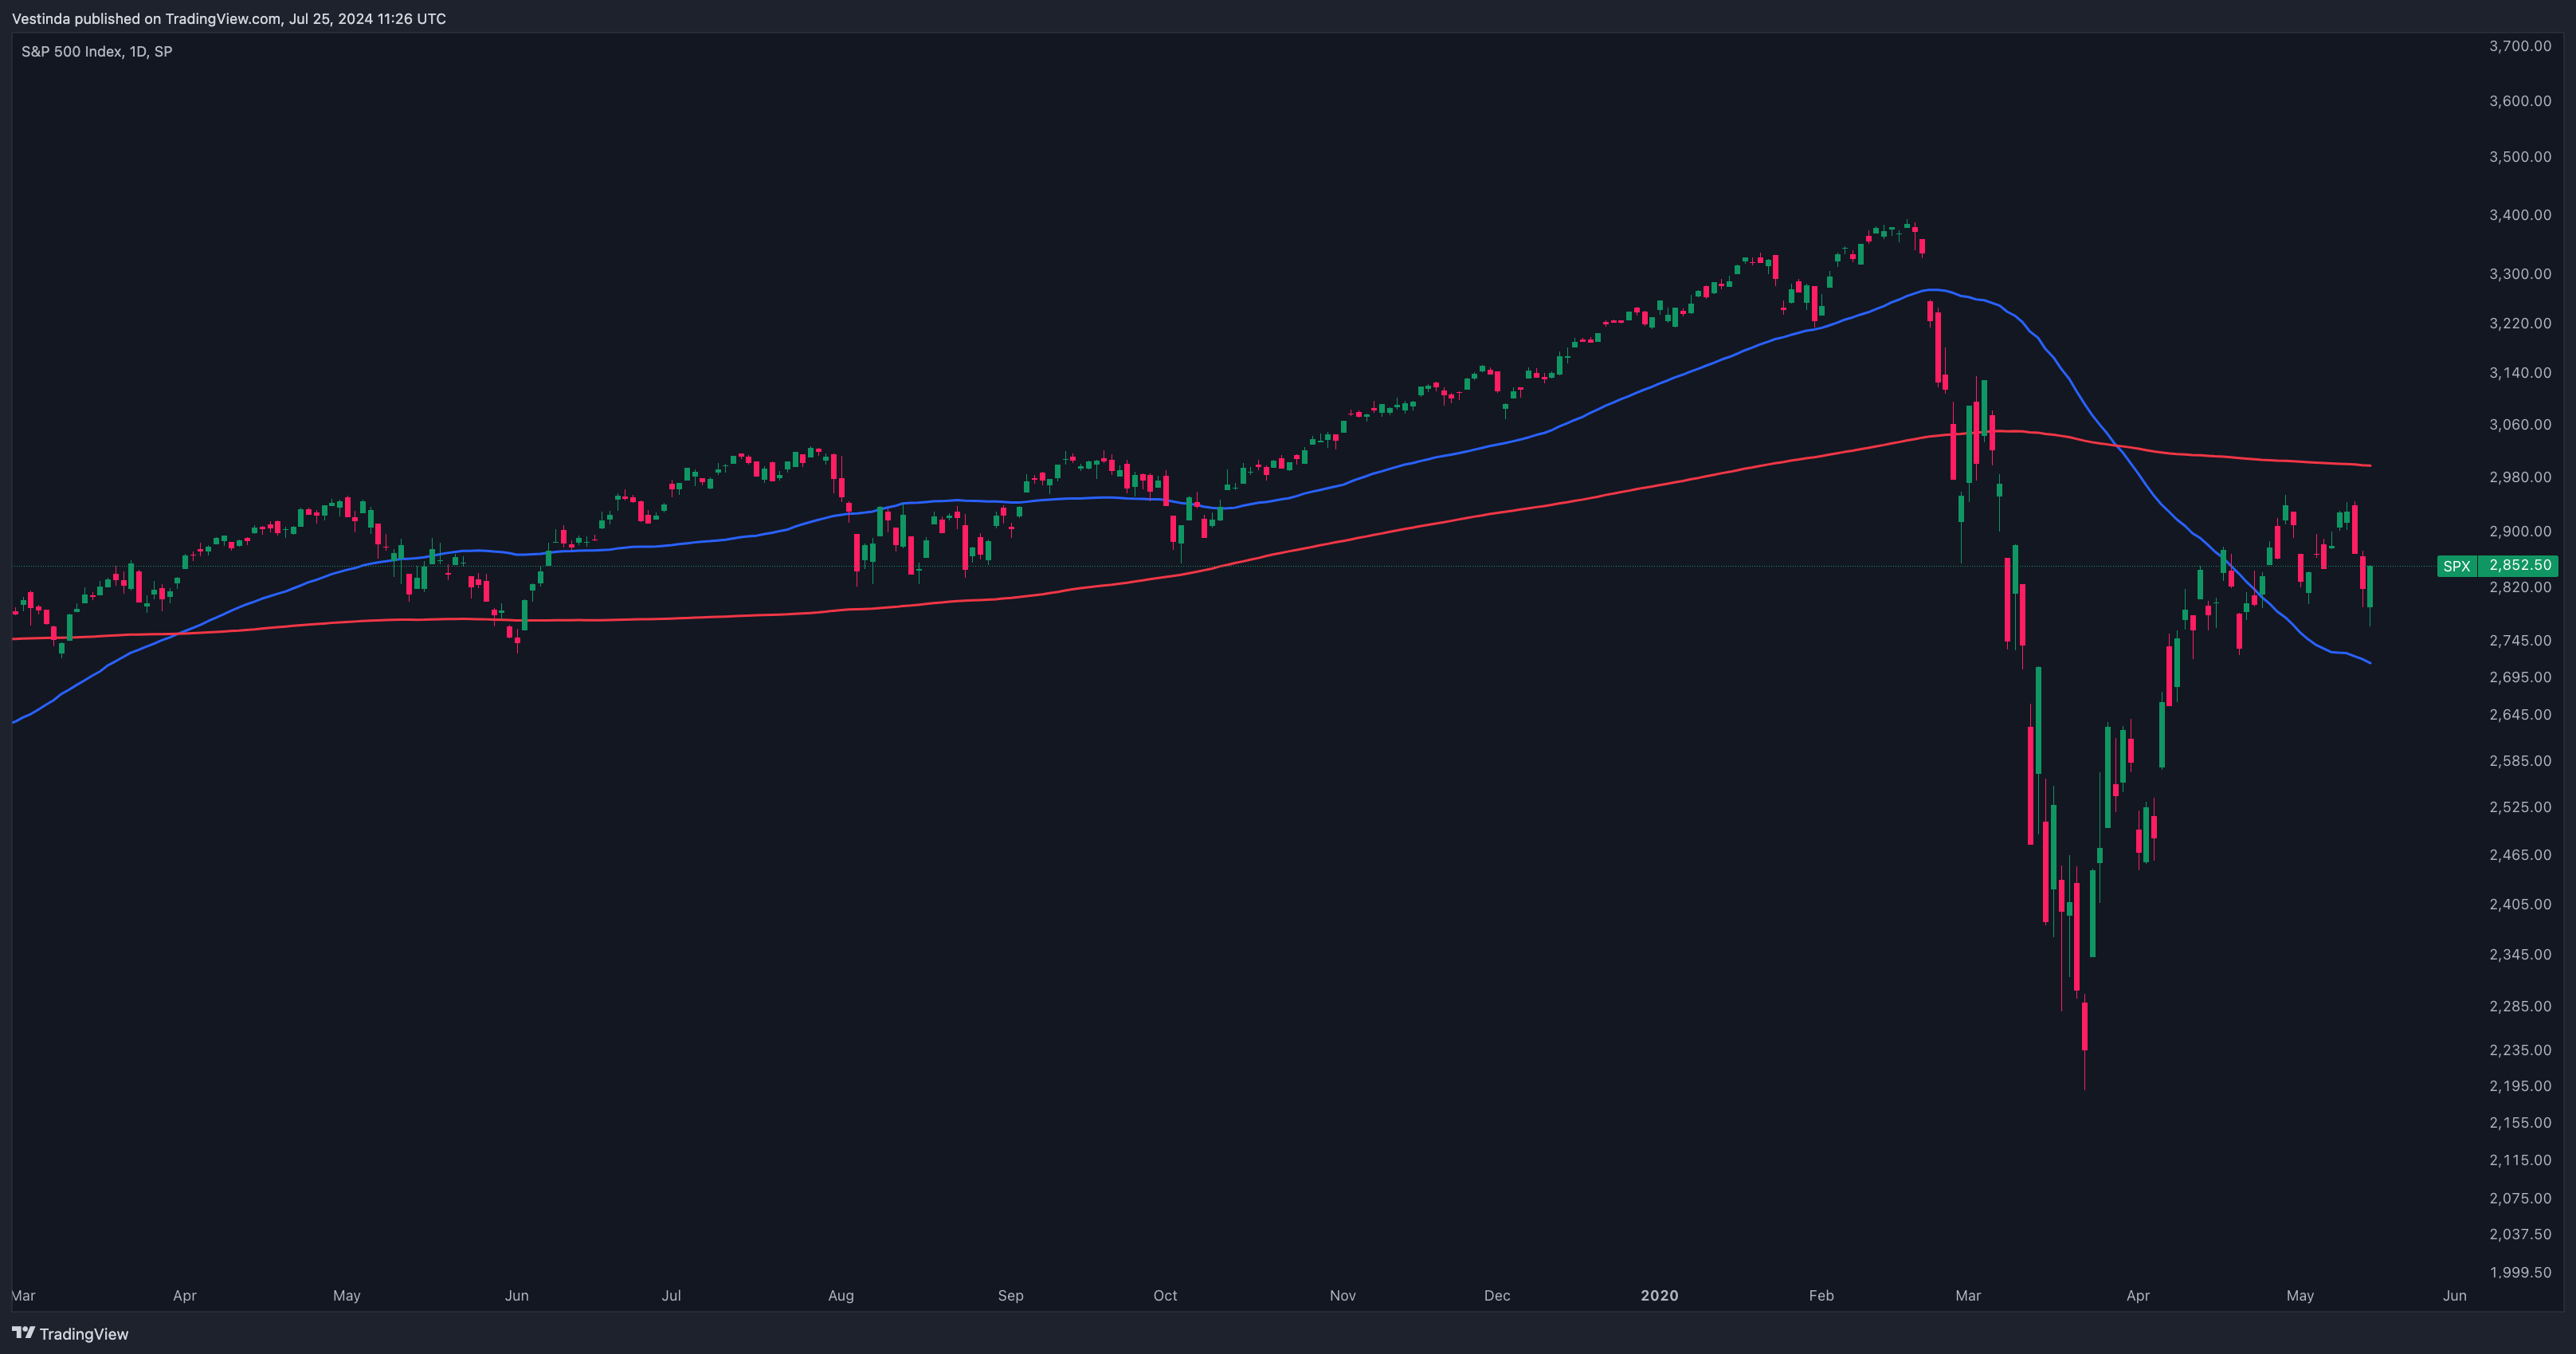
Death Cross Example: Conversely, a Death Cross in early 2020 coincided with the market downturn due to the COVID-19 pandemic.
Risk Management with Moving Averages
Setting stop-losses and take-profits based on moving averages is crucial for risk management. Position sizing and optimizing moving average periods can enhance performance and mitigate risks.
How to Add Moving Average Indicator on TradingView Chart: A Small Guide
1. Open TradingView and Select SPX Chart:
- Go to TradingView.
- In the search bar at the top of the page, type "SPX" or "S&P 500" and select the appropriate symbol from the dropdown list to open the SPX chart.
2. Navigate to the Indicators Menu:

At the top of the chart, click on the "Indicators" button (represented by a chart icon).
3. Search for Moving Average:

- In the Indicators search bar, type "Moving Average."
- Select "Moving Average" from the list of results. This will add the default moving average (usually a 9-period MA) to your chart.
4. Customize the Moving Average:

- On the chart, find the Moving Average line you just added. Click on the gear icon next to "MA" in the chart legend to open the settings.
- In the settings window, you can customize the "Length" to your desired period (e.g., 20, 50, 100, 200).
- You can also change the "Style" (color, thickness) to differentiate between multiple moving averages.
- Click "OK" to apply the changes.
5. Repeat for Additional Moving Averages:
If you want to add more moving averages (e.g., 50-MA, 200-MA), repeat steps 2-4 for each additional moving average.
Ensure each moving average has a different "Length" and optionally a different "Style" for clear visualization.
Decoding the Impact of Moving Averages on SPX
Moving averages are commonly used in technical analysis to understand market trends. A moving average is an indicator that shows the average price of a stock or index over a specific time period. Traders and investors use moving averages to identify support and resistance levels, as well as potential entry and exit points. Short-term moving averages, such as the 20-day moving average, provide a snapshot of recent price action. Longer-term moving averages, like the 200-day moving average, help identify the overall trend of a stock or index. For example, when the SPX crosses above its 200-day moving average, it may indicate a bullish signal. Conversely, when the SPX falls below its 200-day moving average, it may signal a bearish sentiment. Understanding the significance of moving averages can help traders make more informed decisions based on market trends.
Enhancing Performance: Utilizing Moving Averages with INDICES
Moving averages are a useful tool for analyzing indices such as the SPX. They help identify trends and provide insight into potential price movements. To use moving averages effectively, first choose a timeframe, like 50 or 200 days. Short-term traders may prefer the 50-day average, while long-term investors may focus on the 200-day average. Watch for crossovers between the index and its moving average, as these can signal trend reversals. For example, if the SPX crosses above its 50-day moving average, it may indicate a bullish trend. Longer sentences can also explain that moving averages smooth out short-term price fluctuations, enabling investors to see the underlying trend. By understanding how to use moving averages, investors can make more informed decisions when trading indices like the SPX.
Tailoring MA Strategies to SPX Market Conditions
Adapting Moving Average Strategies to Market Conditions is crucial for navigating the ever-changing landscape of the financial markets. The moving average strategy, a popular technical analysis tool, is based on the average price of a security over a specific period of time. Traders often use moving averages to identify trends and generate buy or sell signals. However, blindly applying a moving average strategy may not be effective in all market conditions. To adapt, traders should consider using different time frames or types of moving averages depending on the volatility and directionality of the market. For instance, during periods of high volatility, shorter-term moving averages may provide more responsive signals, while during trending markets, longer-term moving averages may be more reliable. It is also important to regularly review and adjust the strategy as market conditions evolve. By adapting moving average strategies to market conditions, traders can improve their trading decisions and stay ahead in the game.
Common Errors in SPX Moving Average Analysis
Moving average analysis is a widely used tool in technical analysis, but it is not immune to mistakes. One common mistake is using the wrong time frame. Traders often forget to match the time frame of the moving average with their trading strategy. Another mistake is relying too heavily on one moving average. It is important to consider multiple moving averages to get a more accurate picture of the trend. Additionally, using a moving average as a standalone indicator can lead to false signals. It is crucial to combine it with other technical indicators for confirmation. Lastly, using moving averages on volatile assets like SPX can be challenging, as they may not provide accurate results. Taking these common mistakes into consideration will help improve the accuracy of moving average analysis.
-
 Create
account -
 Build trading strategies
with no code -
 Validate
& Backtest -
 Connect exchange
& start earning
Frequently Asked Questions
Moving averages in SPX trading refer to a commonly used technical analysis tool that helps identify trends and potential reversals in the S&P 500 Index (SPX). They calculate the average price of the SPX over a specified period, smoothing out fluctuations to provide a clearer picture of market direction. The two most popular moving averages are the simple moving average (SMA) and the exponential moving average (EMA). Traders often use these indicators to determine support and resistance levels and make informed trading decisions based on the observed moving average crossovers.
To avoid false signals when using Moving Averages for SPX analysis, it is essential to carefully select the appropriate time frame and moving average length. Shorter time frames like 10 or 20 days are useful for short-term analysis, while longer time frames like 50 or 200 days are more reliable for long-term trends. It is also crucial to confirm signals with other technical indicators or chart patterns to increase the accuracy of the analysis. Additionally, considering the overall market conditions, such as volume and volatility, can help filter out false signals and improve the effectiveness of Moving Averages for SPX analysis.
Moving averages can be used for short-term trading on the SPX (S&P 500 Index), but they may have limitations. Short-term traders often rely on more responsive indicators. While moving averages provide trend direction and potential support/resistance levels, they may be slower to react to rapid market changes. Hence, combining moving averages with other short-term indicators like oscillators or volume analysis can enhance their effectiveness. Traders should also consider the timeframe they are trading on, as shorter timeframes may require faster indicators. In conclusion, moving averages can be useful for short-term trading on SPX, but should be used in conjunction with other indicators for better results.
The 50-day Moving Average (MA) in SPX (S&P 500 Index) trading holds considerable significance. It is a widely used technical indicator that helps traders assess the overall trend and potential support/resistance levels. The 50-day MA represents the average price of the SPX over the past 50 trading days, smoothing out short-term fluctuations. Traders often observe the crossover of the SPX price with this MA as it can indicate a change in market sentiment. It is also used as a tool for determining potential buying or selling opportunities, with prices above the 50-day MA suggesting bullish trends and vice versa.
Conclusion
In conclusion, SPX (S&P 500) Moving Averages Trading Strategies are valuable tools for investors to analyze and predict market trends. By carefully analyzing the fluctuations in SPX moving averages, investors can make informed decisions about when to buy or sell stocks. Moving averages, such as the EMA and SMA, provide valuable insights into market direction and help investors navigate the complex landscape of SPX trading. However, it is important to consider market conditions and avoid common mistakes, such as using the wrong time frame or relying too heavily on a single moving average. By adapting and avoiding these mistakes, investors can improve the accuracy of their moving average analysis.

Successful traders rely on backtesting to be profitable.
Be like them with our
Free Backtesting Guide