
-
Track your
Crypto Portfolio -
Copy Crypto trading
strategies -
Build trading strategies
with no code
-
Backtest trading strategies
on Crypto, Forex, Stocks, etc. -
Demo Trading
Risk-free Paper Trading -
Automate trading strategies
with Live Trading
Algorithmic Strategies & Backtesting results for SOL
Here are some SOL trading strategies along with their past performance. You can validate these strategies (and many more) for free on Vestinda across thousands of assets and many years of historical data.
Algorithmic Trading Strategy: Lock and keep profits on SOL
The backtesting results for the trading strategy from November 18, 2020, to November 12, 2023, reveal promising statistics. The strategy displays a profit factor of 1.98, indicating a favorable risk-reward ratio. The annualized ROI stands at an impressive 1155.14%, highlighting the strategy's potential for high returns. On average, trades were held for approximately 6 weeks and 6 days, suggesting a moderately long-term approach. With an average of 0.05 trades per week, the strategy demonstrates a conservative trading frequency. Despite a relatively small number of closed trades (9), the return on investment reaches an impressive 3397.49%. The strategy achieved a winning trades percentage of 44.44%, demonstrating its ability to generate profitable trades. Moreover, the strategy outperformed the buy-and-hold strategy, generating excess returns of 30.69%. Overall, these backtesting results indicate a successful trading strategy during the specified period.

 SOLUSDT

Choose another period and try again.
Algorithmic Trading Strategy: Lock and keep profits on SOL
Based on the backtesting results statistics for a trading strategy from February 26, 2021, to October 15, 2023, the performance appears promising. The strategy yielded a profit factor of 1.9, indicating that for every dollar risked, $1.90 was gained. The annualized return on investment (ROI) stood at an impressive 287.56%. The average holding time for trades was approximately 6 weeks and 5 days, while the average number of trades per week was 0.05. With 8 closed trades, the strategy achieved a winning trades percentage of 50%. Comparatively, it outperformed the buy and hold approach, generating excess returns of 415.37%. Overall, these results suggest a successful trading strategy during the given period.
SOLUSDT
Choose another period and try again.
SOL (Solana) Trading Bot: Creating Signals with Automated Strategy
Introduction
As one of the fastest-growing blockchain platforms, Solana (SOL) attracts traders with its high-speed transactions and active market. To capitalize on Solana’s dynamic price movements, using a trading bot can streamline your strategies and enhance profitability. This guide explains how automated trading bots can optimize SOL trading, offering key strategies, tools, and tips to manage risks effectively.
Why Use a Trading Bot for SOL?
- Speed and Efficiency: Bots execute trades instantly, faster than any human trader, especially in Solana’s fast-moving market.
- Emotion-Free Decisions: Automation ensures consistency, removing emotional biases from trading.
- 24/7 Market Monitoring: Bots can operate around the clock, capturing opportunities even when you’re offline.
- Customizable Strategies: Trading bots allow for personalized setups tailored to specific market conditions and goals.
Key Automated Trading Strategies for SOL
1. Trend-Following with EMA Crossovers
Concept: Use exponential moving averages (EMAs) to identify and follow market trends.
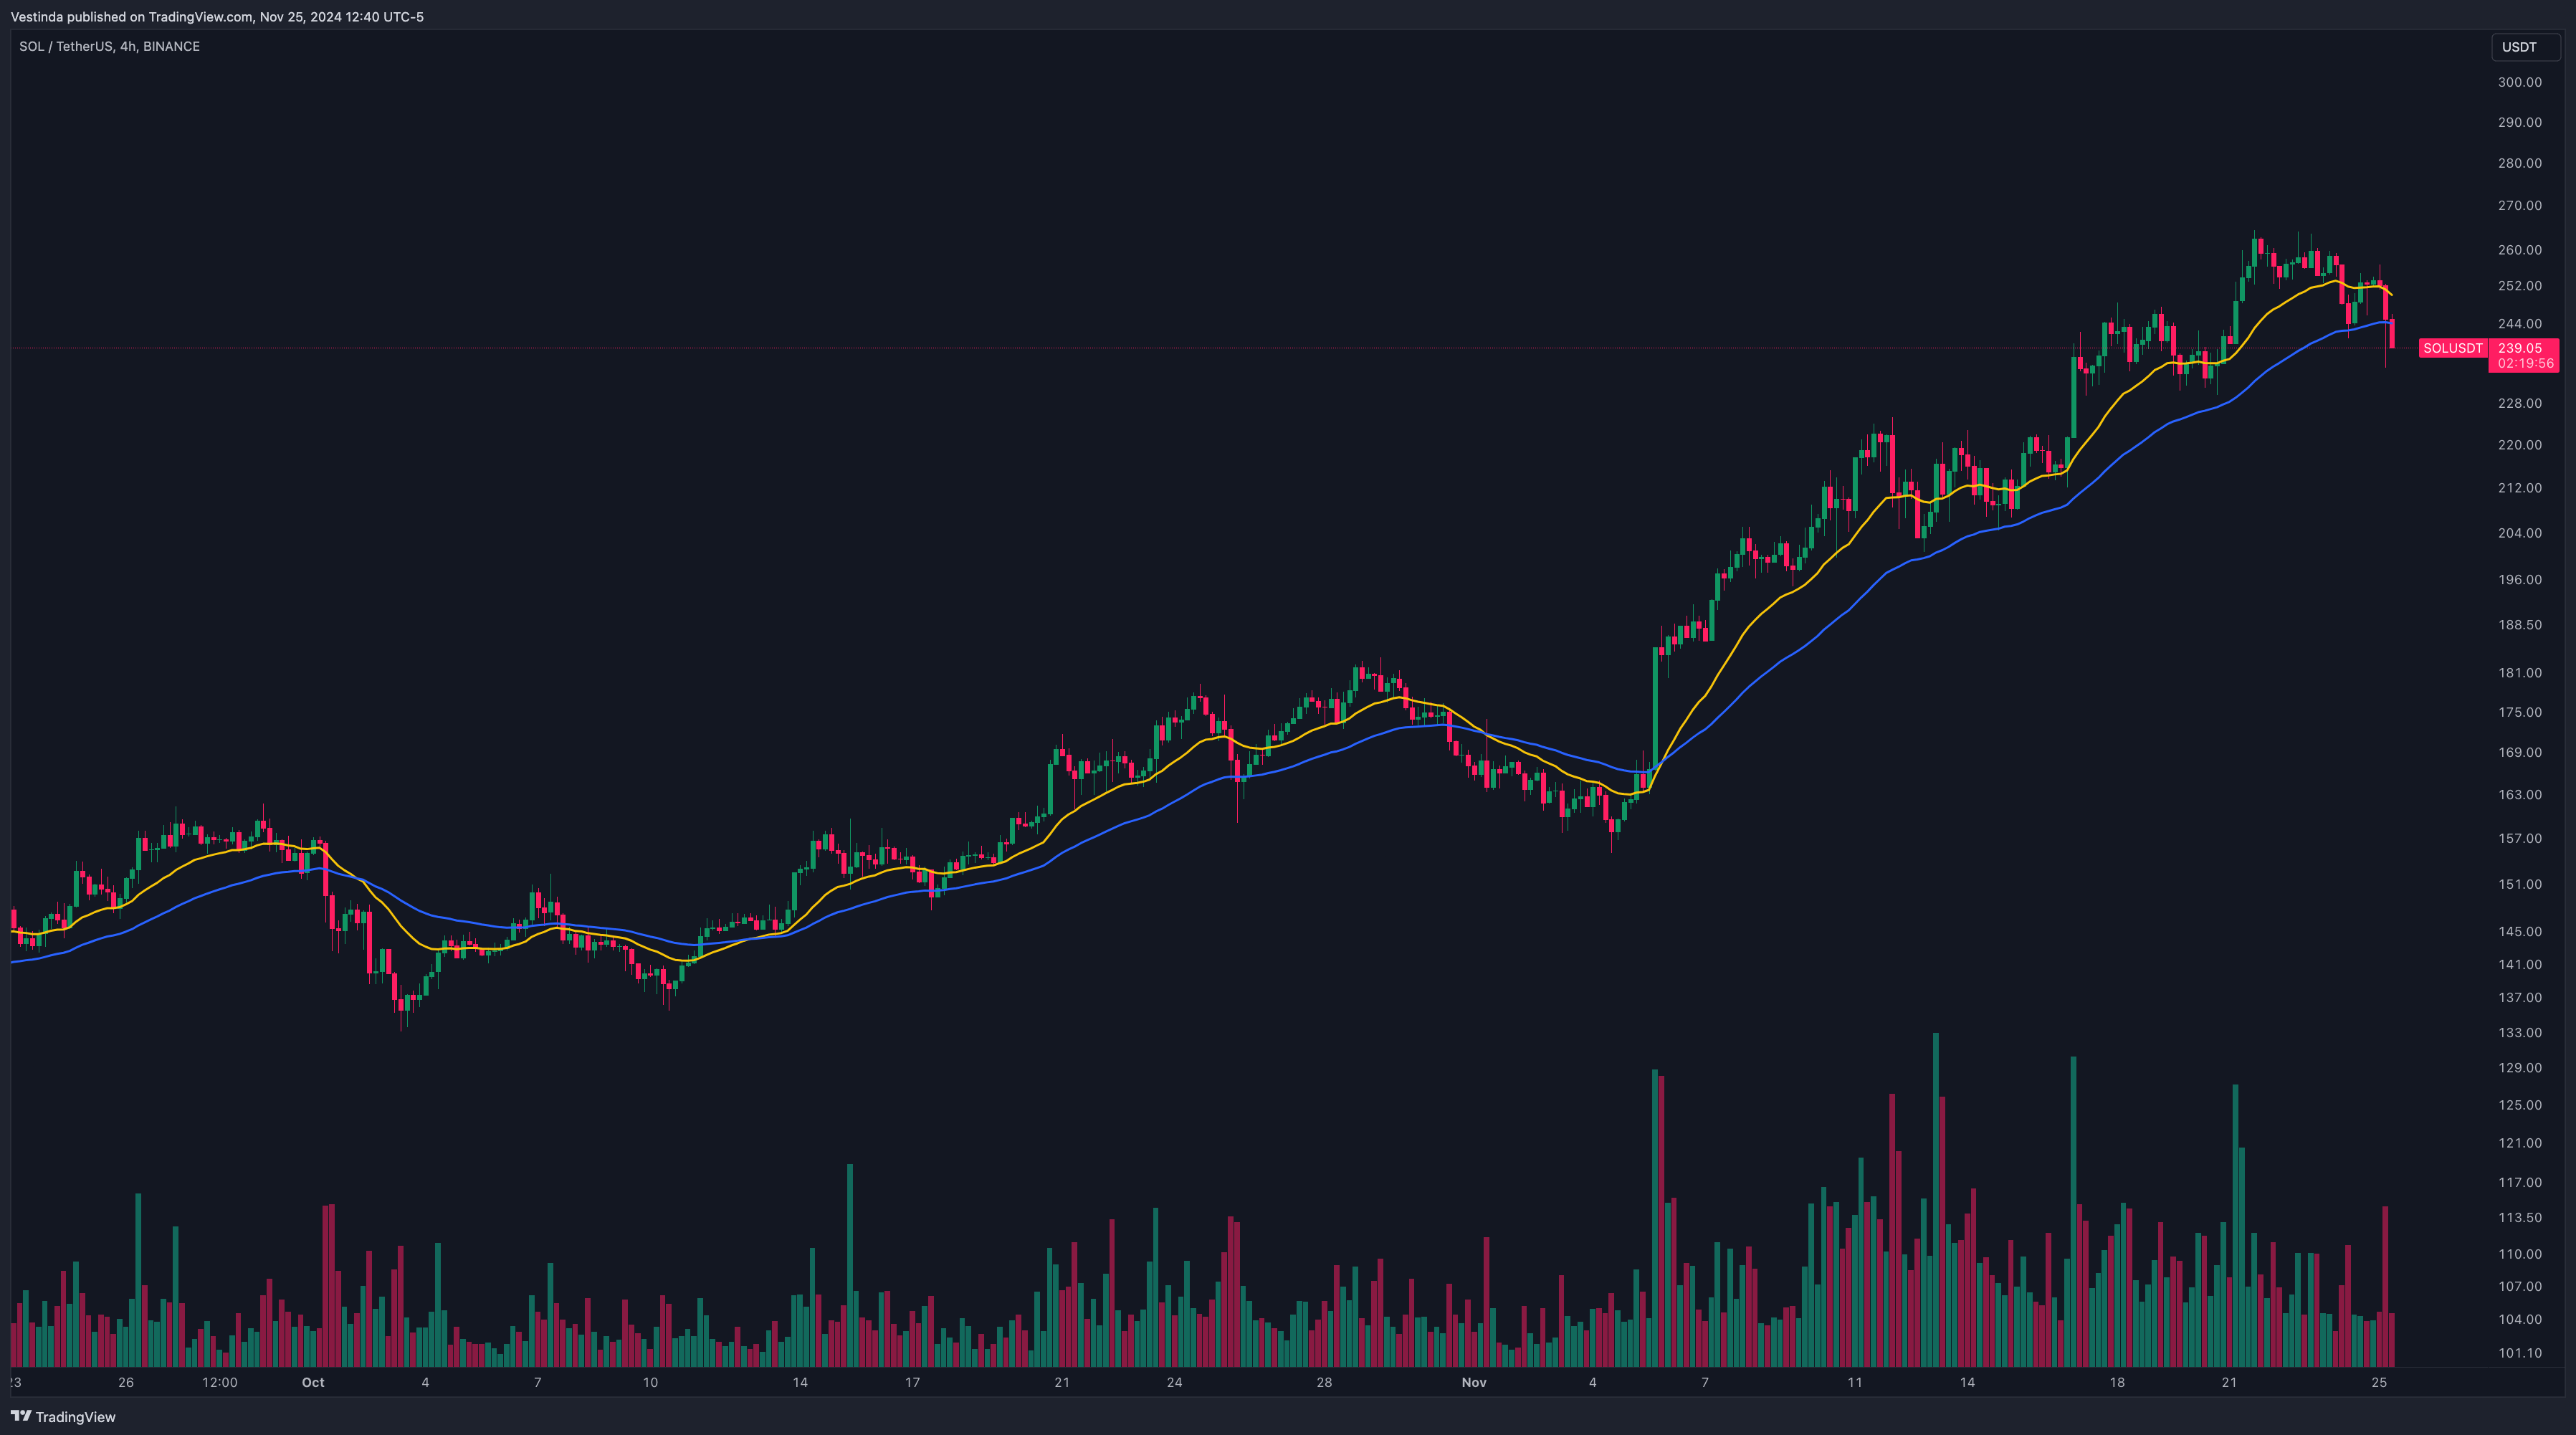
Setup: Apply a 20-period EMA (short-term) and a 50-period EMA (long-term).
Entry/Exit Rules:
- Enter long when the 20 EMA crosses above the 50 EMA.
- Exit or short when the 20 EMA crosses below the 50 EMA.
Optimization Tip: Adjust EMA periods to suit Solana’s current volatility.
2. Breakout Trading with Bollinger Bands
Concept: Automate trades based on SOL price breaking out of Bollinger Bands.
Setup: Use a 20-period SMA with two standard deviations for the bands.
Entry/Exit Rules:
- Buy when SOL closes above the upper band; sell when it closes below the lower band.
Optimization Tip: Combine Bollinger Band signals with volume indicators for confirmation.
3. Mean Reversion with RSI
Concept: Detect overbought and oversold conditions using the Relative Strength Index (RSI).
Setup: Apply RSI with a 14-period setting.
Entry/Exit Rules:
- Enter long when RSI drops below 30 and starts rising; short when RSI exceeds 70 and begins falling.
Optimization Tip: Pair RSI with support/resistance levels for more accurate entries.
4. Momentum Strategy with MACD
Concept: Use MACD to capture momentum shifts in Solana’s price.
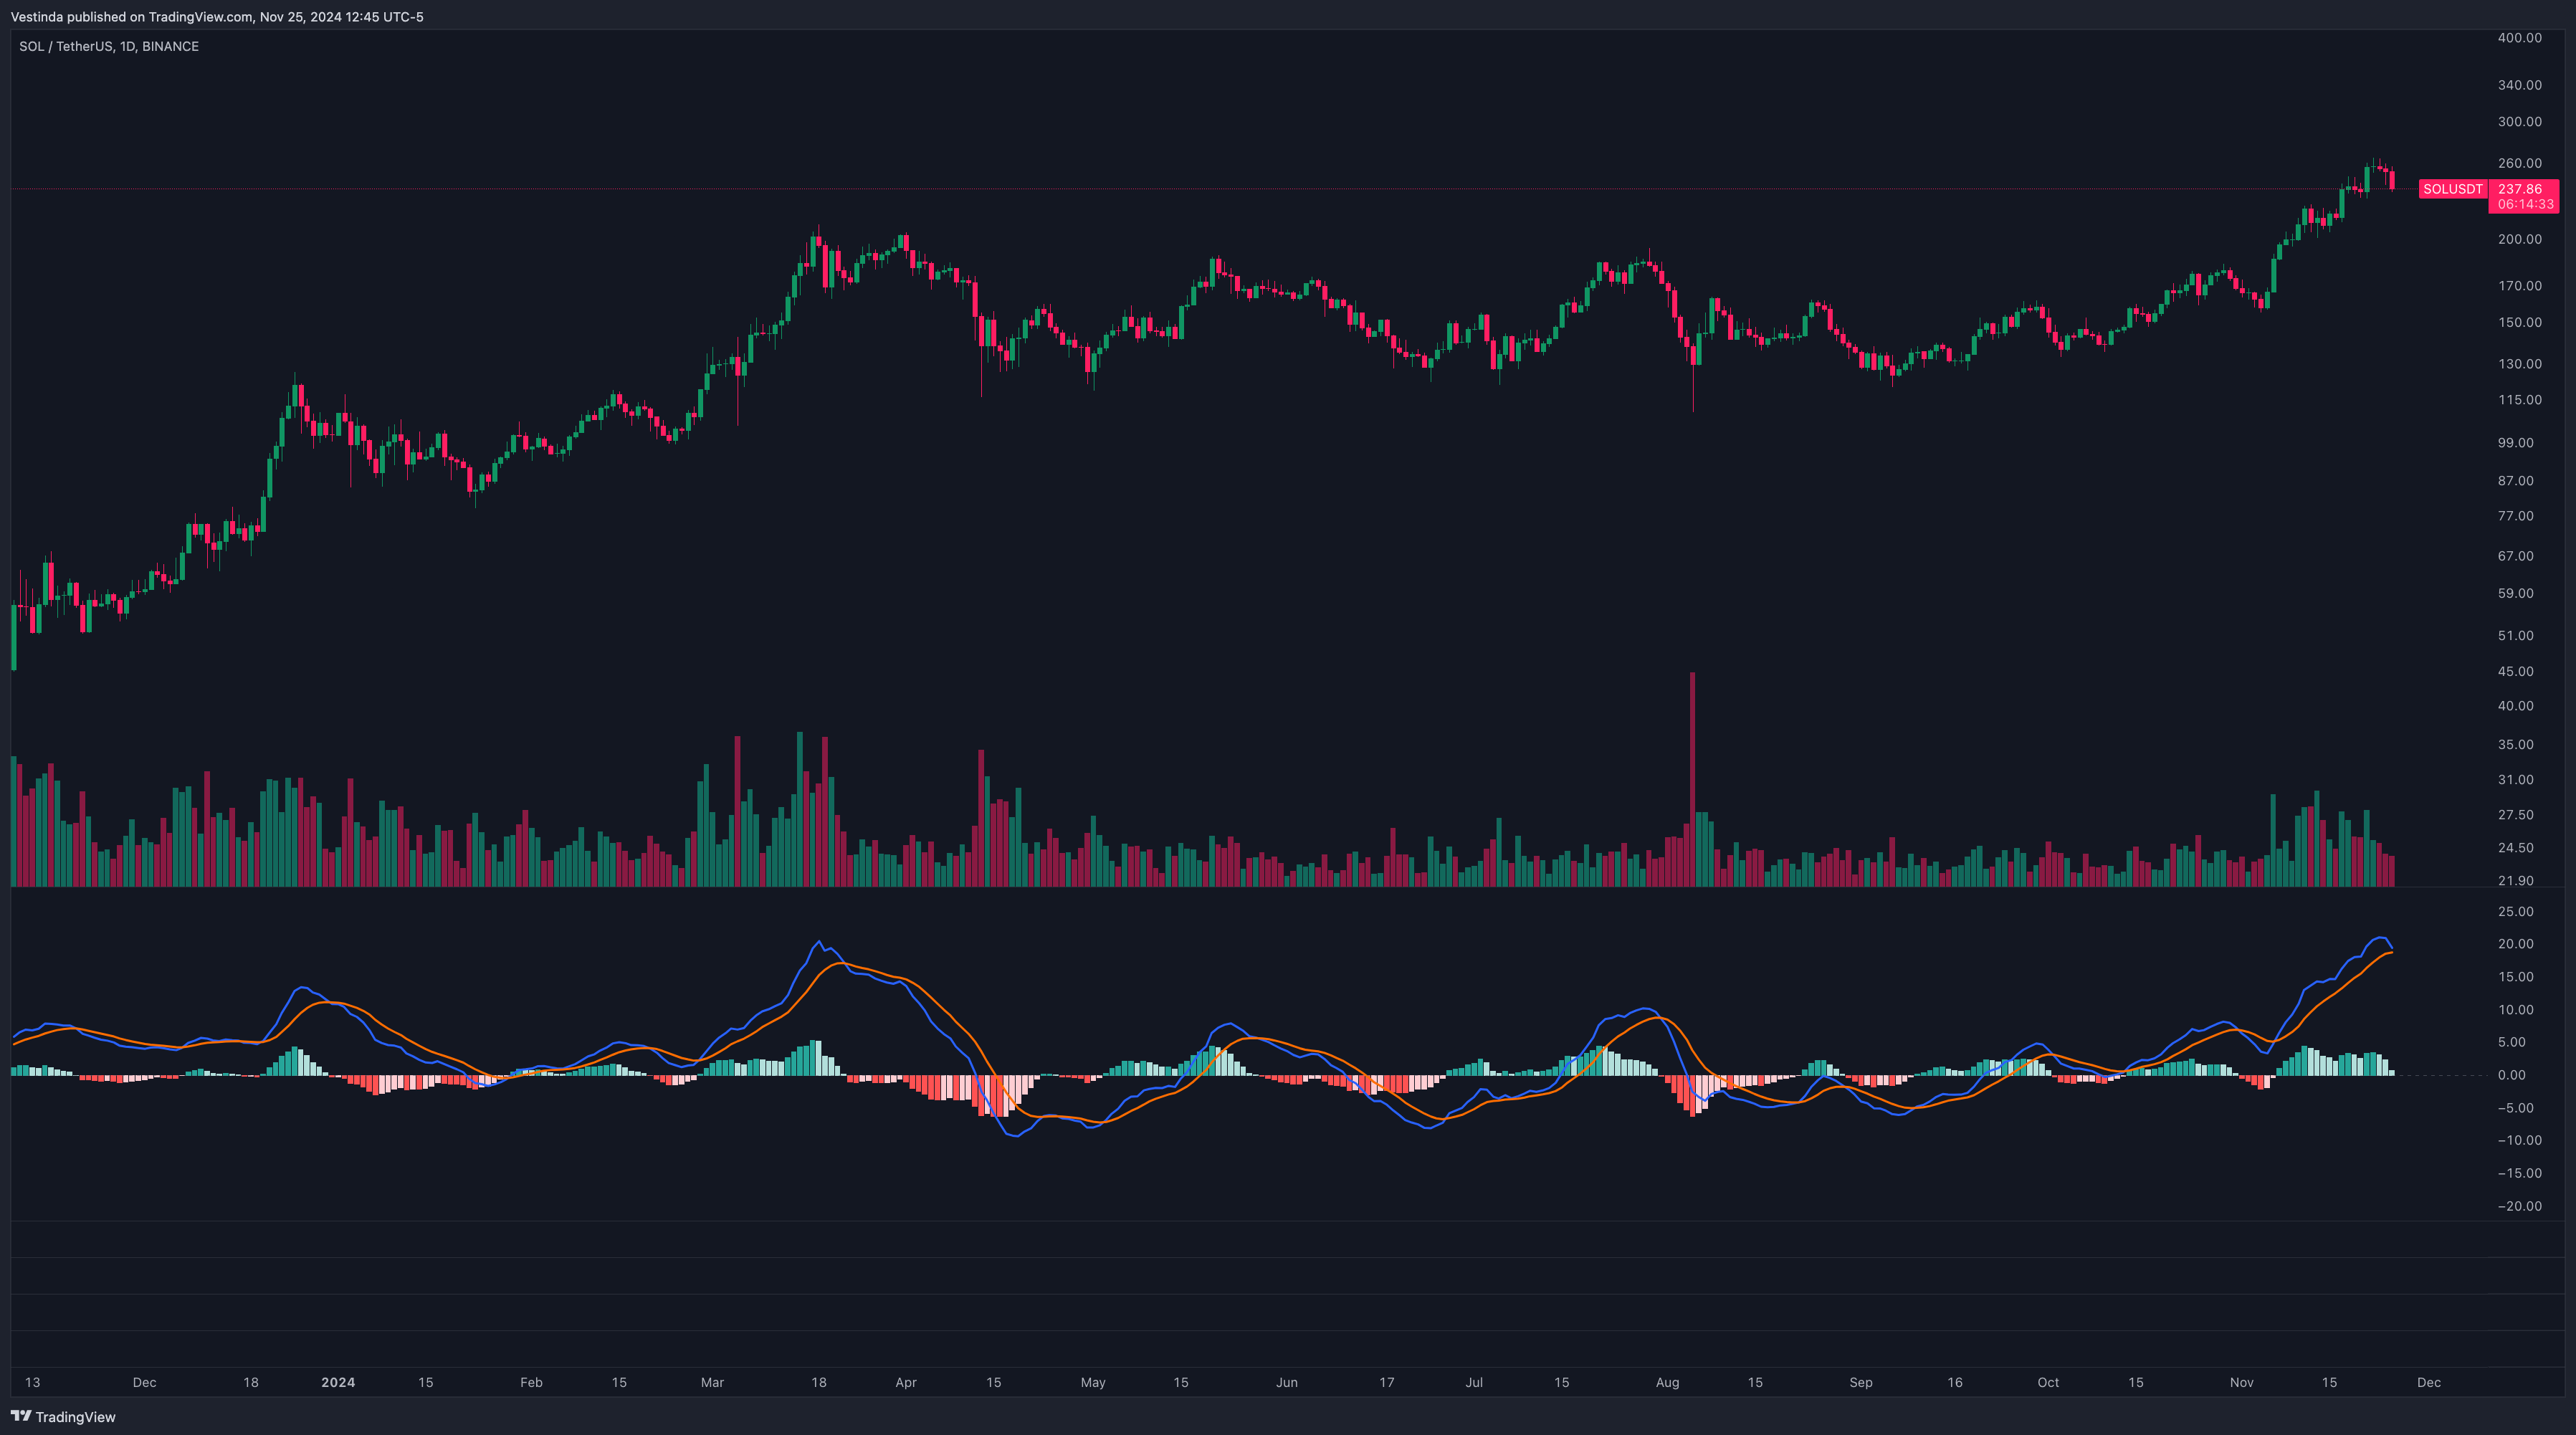
Setup: Apply MACD (12, 26, 9) to detect bullish or bearish momentum.
Entry/Exit Rules:
- Enter long on a bullish MACD crossover; exit or short on a bearish crossover.
Optimization Tip: Adjust MACD settings for faster responses during high volatility.
Building an Automated Trading Bot for SOL
1. Define Your Logic
Use clear conditions for entries and exits:
- IF price crosses above the upper Bollinger Band THEN enter long.
- IF RSI exceeds 70 THEN exit or short.
2. Choose the Right Platform
Platforms like Vestinda, MetaTrader, TradingView with Pine Script, or Python libraries (e.g., Backtrader) allow for custom bot setups.
3. Backtesting and Optimization
Test strategies on historical SOL data to refine parameters.
- Metrics to Monitor: Win rate, maximum drawdown, and profit factor.
Risk Management with SOL Trading Bots
1. Position Sizing
Limit trades to a fixed percentage of your total portfolio (e.g., 1-2%) to mitigate risk.
2. Stop-Loss and Take-Profit Automation
Automate stop-losses and take-profits at predefined levels to protect capital and secure gains.
3. Dynamic Adjustments
Use indicators like ATR (Average True Range) to adjust stop-loss distances based on volatility.
Conclusion
An automated trading bot tailored for SOL (Solana) can help traders capitalize on its price movements with precision and efficiency. By implementing strategies like trend-following, breakout trading, and momentum-based approaches, and combining them with robust risk management, traders can achieve consistent profitability in Solana’s fast-paced market.
Trading Signals: Mastering SOL with Precision
- Sign up with a reputable trading platform that provides trading signals for SOL.
- Choose a trading signal provider that has a proven track record of accuracy.
- Subscribe to the trading signal service and follow their instructions.
- When a trading signal is received, analyze it and consider market conditions.
- Place a trade based on the trading signal, following proper risk management strategies.
- Monitor the trade and adjust your position as needed, based on new signals or market developments.
SOL Signal Services: Maximizing Solana Investment Opportunities
SOL Signal Providers are platforms that offer trading signals specifically for the Solana ecosystem. These providers analyze market data and trends to generate accurate predictions for buying and selling SOL tokens. By subscribing to their services, users gain access to real-time alerts and recommendations, enabling them to make informed trading decisions. Reliable SOL Signal Providers use advanced algorithms and technical analysis tools to identify potential price movements and profitable opportunities within the Solana market. These platforms often provide additional features like portfolio management tools and risk management strategies to help users optimize their trading activities. With the growing popularity of Solana, SOL Signal Providers play a crucial role in helping investors navigate the market and take advantage of the booming DeFi ecosystem on the Solana blockchain.
SOL Trading Signals: Illuminating Candlestick Patterns
Candlestick patterns are a popular tool for analyzing SOL trading signals. These patterns provide visual representations of price action that can help traders identify potential reversals or continuations in the market.
Some common candlestick patterns include the doji, hammer, and engulfing pattern. Each pattern has its own unique characteristics and can indicate different market conditions and potential price movements.
For example, a doji pattern occurs when the opening and closing prices are very close together, suggesting indecision in the market. This could signal a potential trend reversal or a period of consolidation.
On the other hand, a hammer pattern occurs when the price initially declines but then recovers to close near its high. This pattern often indicates a potential bullish reversal.
By keeping an eye on these candlestick patterns, traders can gain insights into SOL trading signals and make more informed decisions when entering or exiting positions.
SOL: Harnessing Support and Resistance for Trading
Support and resistance levels are powerful indicators in technical analysis for making trading decisions. These levels provide valuable information about the psychological dynamics of the market. For short-term traders, support and resistance levels can act as signals to enter or exit trades. When the price of SOL approaches a support level, it suggests that buyers are likely to enter the market, creating upward pressure on the price. Conversely, when the price approaches a resistance level, it indicates that sellers may step in, causing downward pressure on the price. Traders can use these levels to set their stop-loss orders or take-profit targets, improving their risk management and profitability. It is important to note that support and resistance levels are not foolproof, and other factors should be considered to ensure accurate trading decisions.
-
100,000 available assets New
-
years of historical data
-
practice without risking money

Frequently Asked Questions
Creating trading signals involves analyzing market data and using technical indicators to identify potential buying or selling opportunities. Traders can consider factors like price movements, trend lines, moving averages, and volume to generate signals. Additionally, traders can use strategies like breakouts, moving average crossovers, or Fibonacci retracements to determine entry and exit points. It's important to thoroughly backtest and validate any signals before applying them to live trading. Combining technical analysis with fundamental analysis can further enhance trading signals, allowing traders to make more informed decisions based on market conditions and economic factors.
Trading signals are indicators that suggest optimal entry and exit points for buying or selling financial assets. They are derived from technical analysis tools and algorithms that analyze market data and patterns. Trading signals provide valuable insights and help traders make informed decisions based on predicted market trends. These signals can indicate potential changes in asset prices, market volatility, or other relevant factors. Traders can use these signals to determine when to enter or exit trades, managing risk and maximizing potential profits. Overall, trading signals serve as a useful tool for traders aiming to enhance their decision-making process.
Yes, trading signals for options spreads are available through various sources like online platforms, trading software, and financial advisors. These signals provide insights on potential trade setups and market conditions, helping traders make informed decisions for their options spread strategies. Utilizing trading signals can enhance trading efficiency and increase the probability of successful spread trades. However, it is important to thoroughly analyze and verify the signals before executing any trades to ensure suitability and alignment with personal risk tolerance and investment goals.
Managing risk when following multiple trading signals requires careful consideration and a systematic approach. Firstly, diversify your investments across different asset classes and markets. Additionally, assess the risk-reward ratio of each signal and allocate appropriate capital accordingly. Set stop-loss levels for each trade to limit potential losses. Maintaining a disciplined approach is crucial – avoid emotional decision-making and stick to predetermined risk management parameters. Regularly monitor the signals and their performance to make necessary adjustments. Finally, always remember to manage your overall portfolio risk by periodically rebalancing and adjusting position sizes.
Yes, there are trading signals available for intraday trading. Trading signals are indicators or patterns that guide traders on when to enter or exit a trade. These signals are generated by various technical analysis tools, such as moving averages, oscillators, or chart patterns. Traders use these signals to identify potential profitable opportunities within the same trading day. By following these signals, intraday traders can make informed decisions and enhance their chances of success in the fast-paced world of intraday trading.
Yes, you can get trading signals for specific commodity futures contracts. Many financial institutions, brokerage firms, and online platforms offer trading signals based on technical analysis and market trends. These signals provide insights and recommendations on when to buy or sell specific commodity futures contracts. Subscribing to such services can help you make informed trading decisions and potentially improve your chances of profiting from commodity futures trading.
Conclusion
In conclusion, SOL trading signals play a crucial role in helping traders make informed decisions in the Solana market. By subscribing to reputable signal providers, traders can access accurate and real-time alerts, enabling them to maximize profits. Candlestick patterns and support and resistance levels are valuable tools for analyzing SOL trading signals and can provide insights into potential price movements. However, it is important to consider other factors and employ proper risk management strategies to ensure accurate trading decisions. Don't miss out on the opportunity to enhance your trading strategies and navigate the booming Solana ecosystem with SOL trading signals!

Successful traders rely on backtesting to be profitable.
Be like them with our
Free Backtesting Guide