
-
 Create
account -
 Discover profitable
strategies -
 Connect exchange
& start earning
Automated Strategies & Backtesting results for SHIB
Here are some SHIB trading strategies along with their past performance. You can validate these strategies (and many more) for free on Vestinda across thousands of assets and many years of historical data.
Automated Trading Strategy: VWAP and KAMA Confirmation on SHIB
Based on the backtesting results for the trading strategy conducted from May 10, 2021, to October 20, 2023, several key statistics emerge. The strategy showcases a profit factor of 1.62, indicating that for every unit of risk undertaken, 1.62 units of profit were generated. The annualized return on investment stands impressively at 113.35%. On average, each trade was held for approximately 6 days and 1 hour, while only 0.33 trades were executed per week, indicating a conservative approach. With a total of 43 closed trades, the winning trades percentage came in at 20.93%. Notably, this strategy outperformed the buy-and-hold approach, generating excess returns of 1557.46%.

 SHIBUSDT

Choose another period and try again.
Automated Trading Strategy: Keltner Channel and TEMA Trend-Following on SHIB
According to the backtesting results, the trading strategy implemented from May 10, 2021, to October 20, 2023, has shown promising statistics. The strategy has achieved a profit factor of 5.34, indicating its effectiveness in generating profits compared to the risk taken. The annualized return on investment (ROI) stands at an impressive 316.91%, showcasing significant growth over the tested period. On average, the strategy holds positions for approximately 2 days and 6 hours, which reflects a relatively short-term trading approach. With an average of 0.22 trades per week, the strategy maintains a moderately active trading frequency. The number of closed trades during this period amounts to 29, demonstrating the strategy's versatility. The return on investment is an exceptional 772.94%, emphasizing the strategy's ability to generate high returns. While winning trades account for 44.83% of the total, the strategy outperforms the buy-and-hold approach, surpassing it by a remarkable 3743.79% in terms of generating excess returns. These statistics showcase the strategy's potential for generating substantial profits and outperforming passive investment strategies.
SHIBUSDT
Choose another period and try again.
SHIB (Shiba Inu) Moving Averages: Best Trading Strategies
Introduction
Moving averages are fundamental tools in technical analysis, offering traders a clear picture of price trends and potential entry or exit points. For Shiba Inu (SHIB), moving averages provide a structured approach to navigating its volatile market. This guide highlights the best moving average strategies tailored for trading SHIB.
Why Use Moving Averages in SHIB Trading?
- Trend Identification: Helps determine whether SHIB is in an uptrend, downtrend, or consolidating phase.
- Signal Generation: Provides actionable buy and sell signals.
- Simplicity and Versatility: Easy to apply and adapt across different timeframes.
Types of Moving Averages:
- Simple Moving Average (SMA): Average of SHIB’s price over a specified number of periods. Best for identifying long-term trends.
- Exponential Moving Average (EMA): Gives more weight to recent prices, making it responsive to short-term movements. Ideal for fast-paced markets like SHIB.
Top Moving Average Strategies for SHIB:
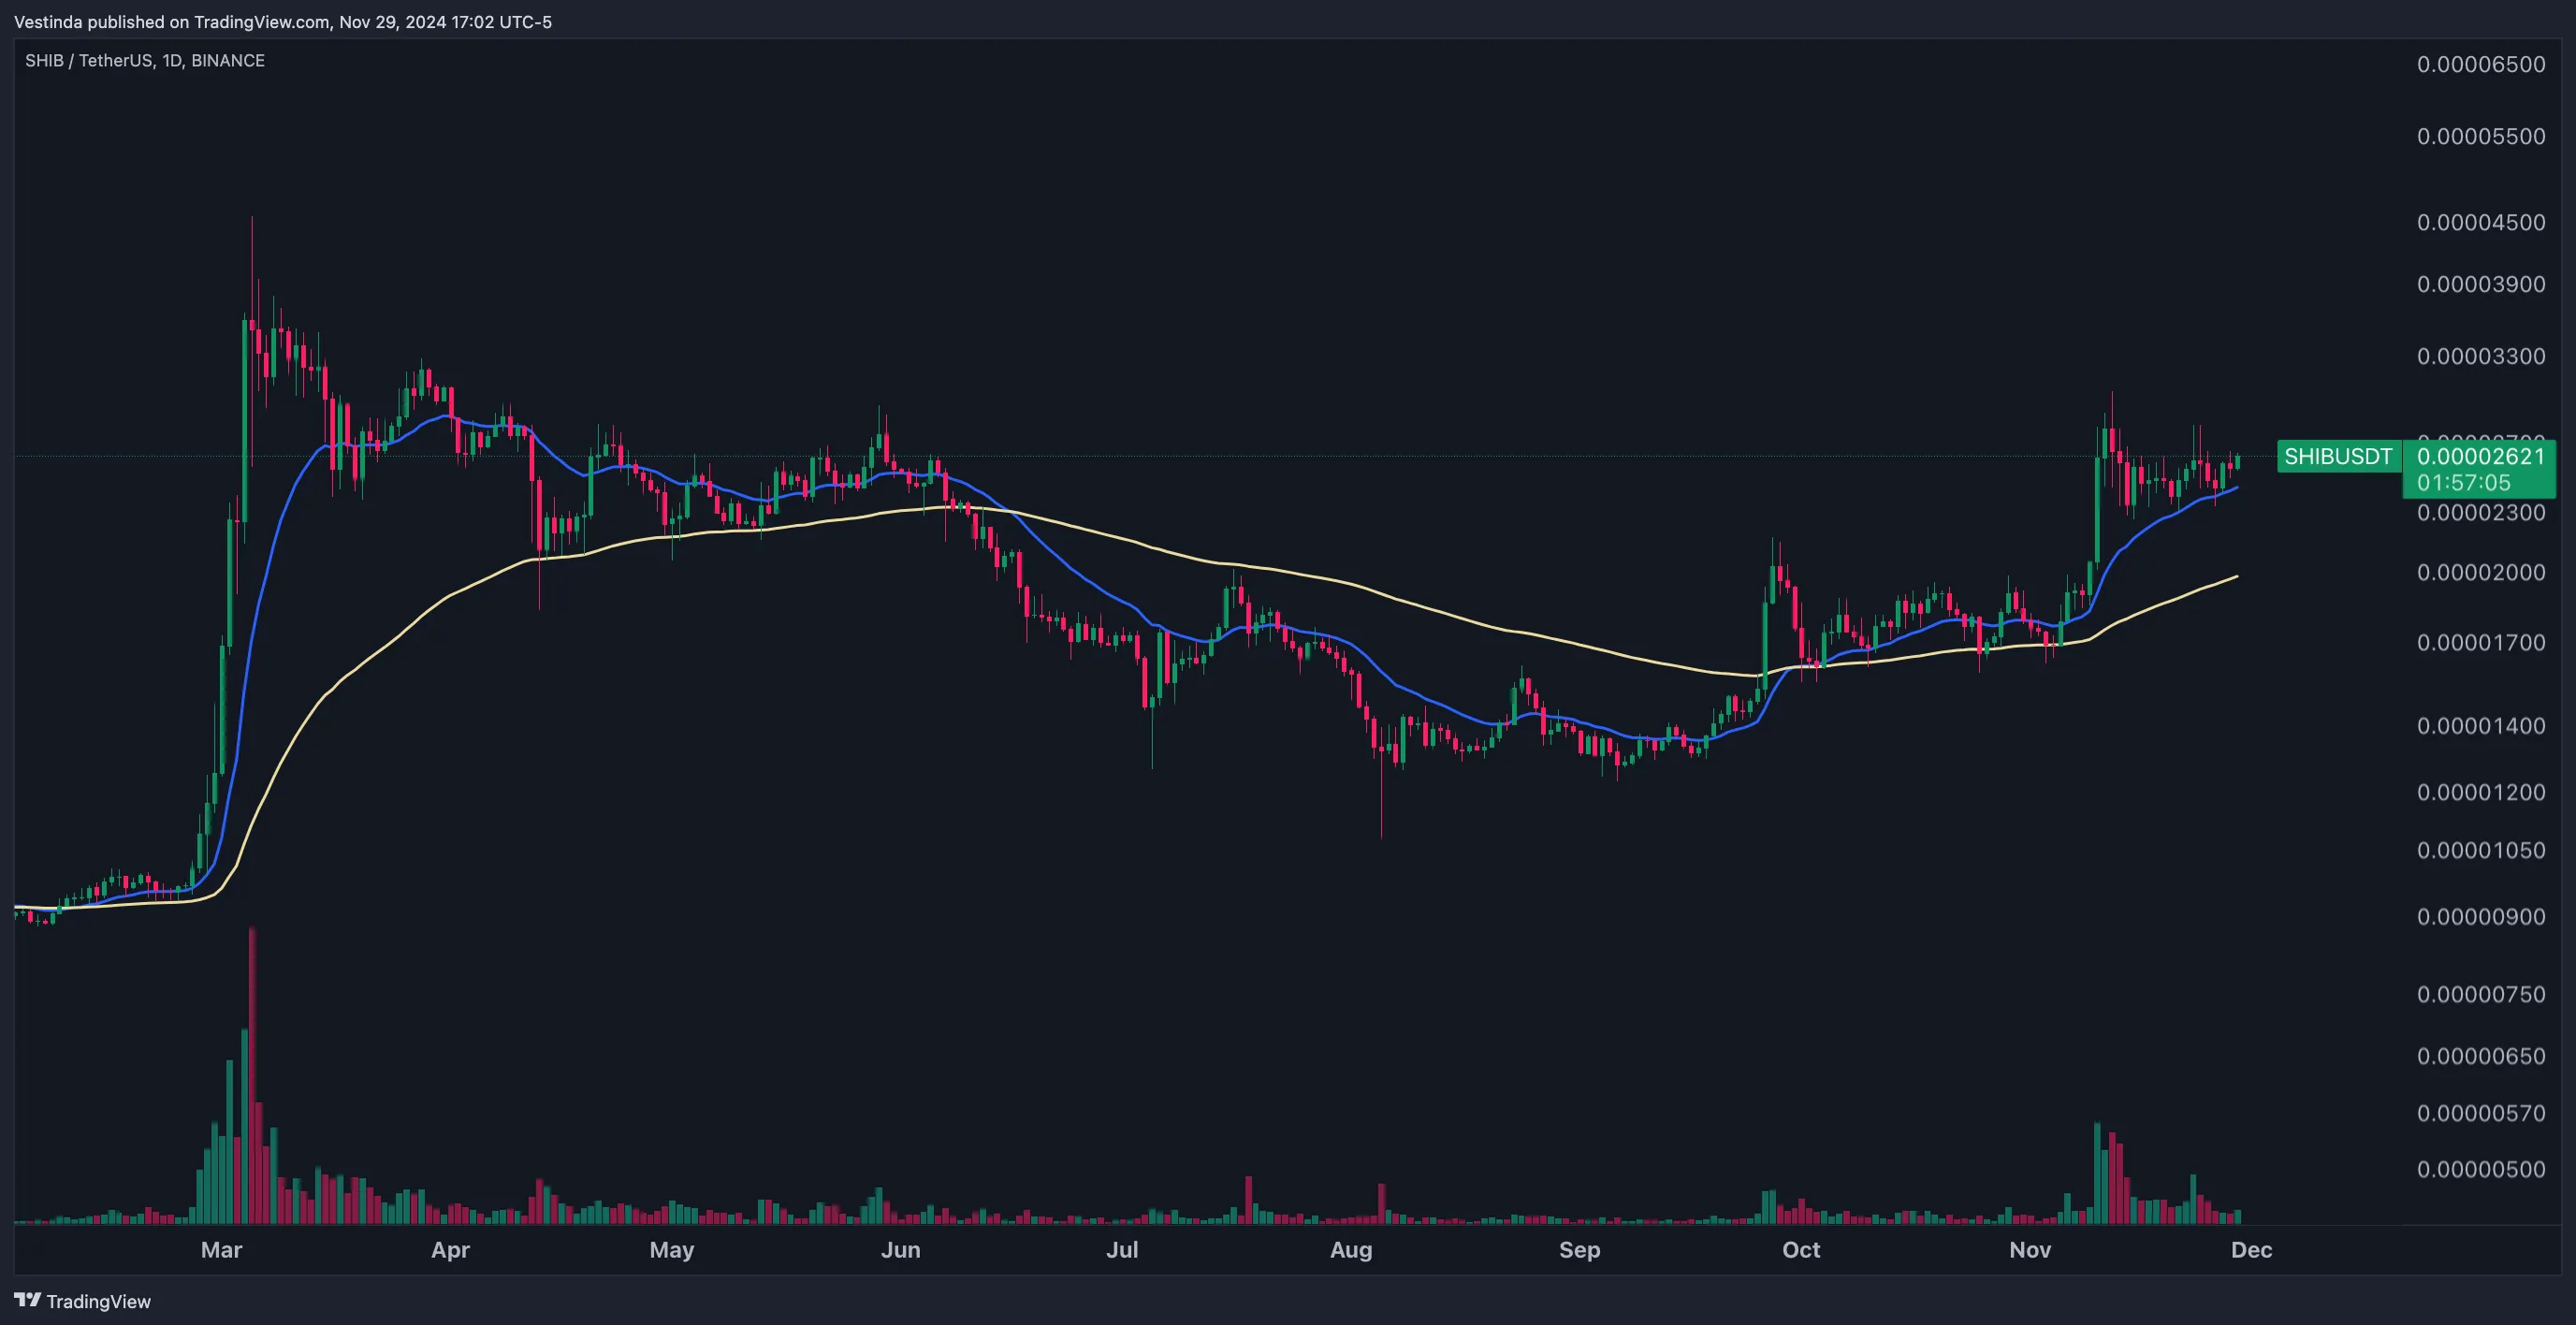
1. Golden Cross and Death Cross Strategy:
Concept: Use the crossover of two EMAs to identify trend reversals.
- Setup: Apply a 20-period EMA (short-term) and a 100-period EMA (long-term).
- Execution Rules:
- Golden Cross (Bullish Signal): Enter long when the 20 EMA crosses above the 100 EMA.
- Death Cross (Bearish Signal): Exit or go short when the 20 EMA crosses below the 100 EMA.
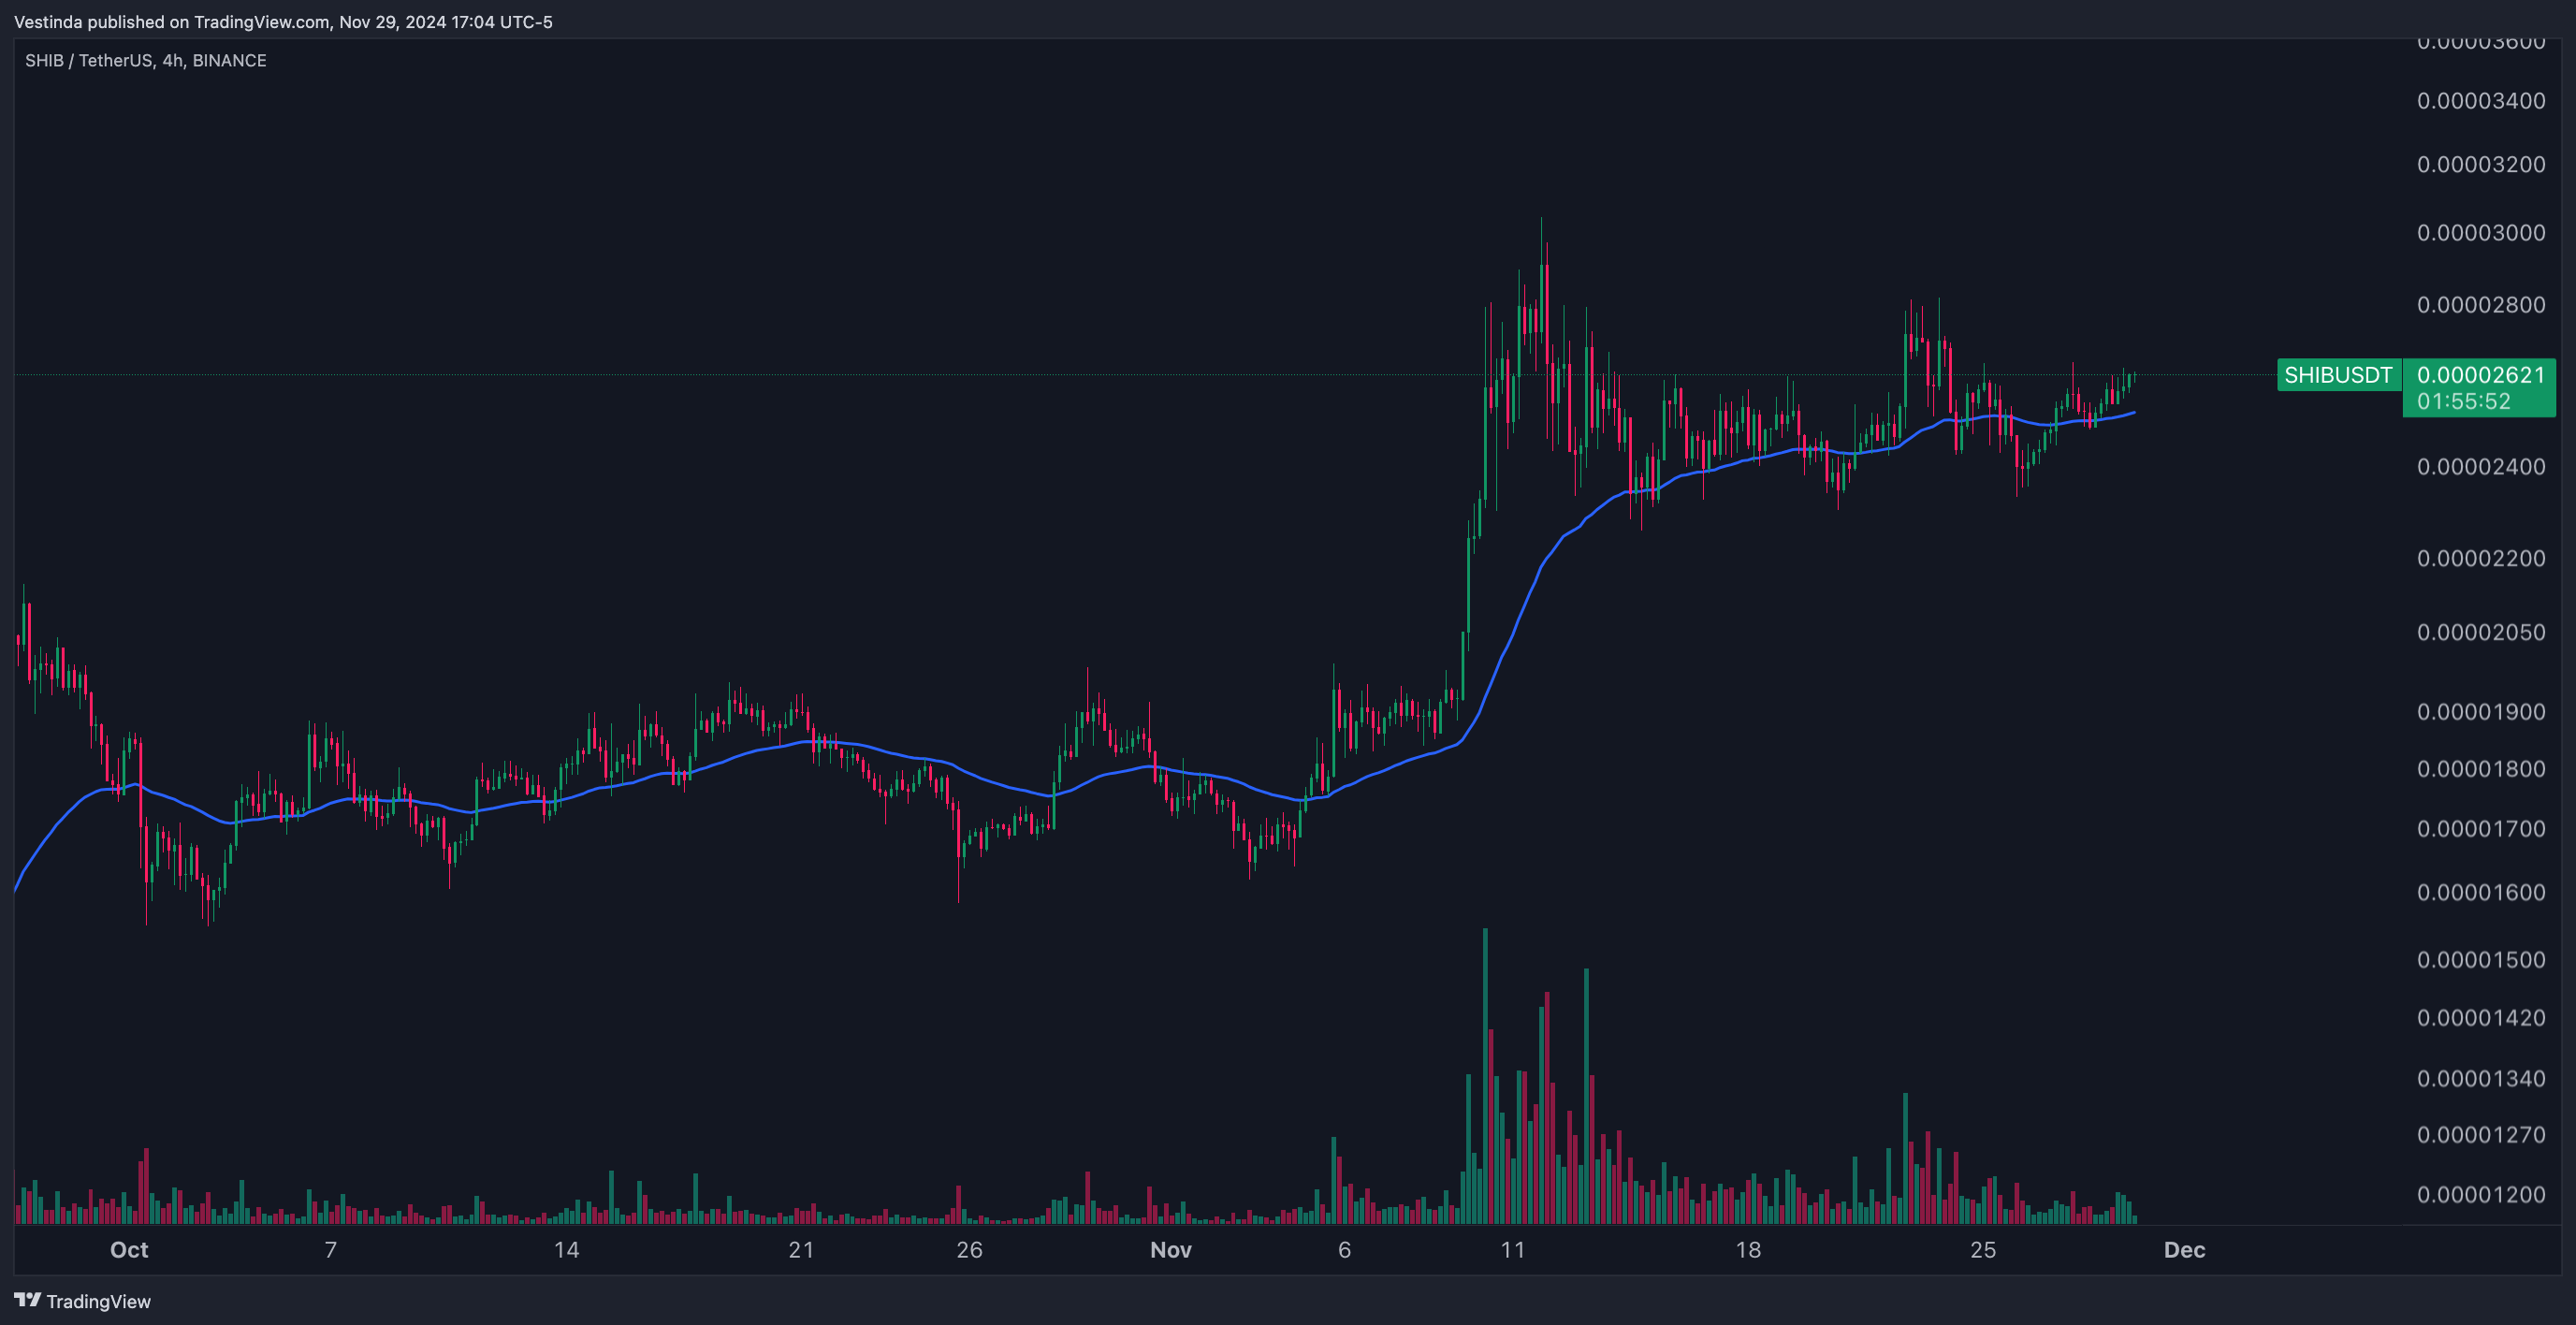
2. Moving Average Bounce Strategy:
Concept: Trade bounces off moving averages during trending markets.
- Setup: Use a 50-period EMA as dynamic support or resistance.
- Execution Rules:
- Buy Signal: Enter long when SHIB bounces off the 50 EMA during an uptrend.
- Sell Signal: Exit when price breaks below the 50 EMA.
- Enhancement: Combine with RSI to confirm oversold conditions during the bounce.
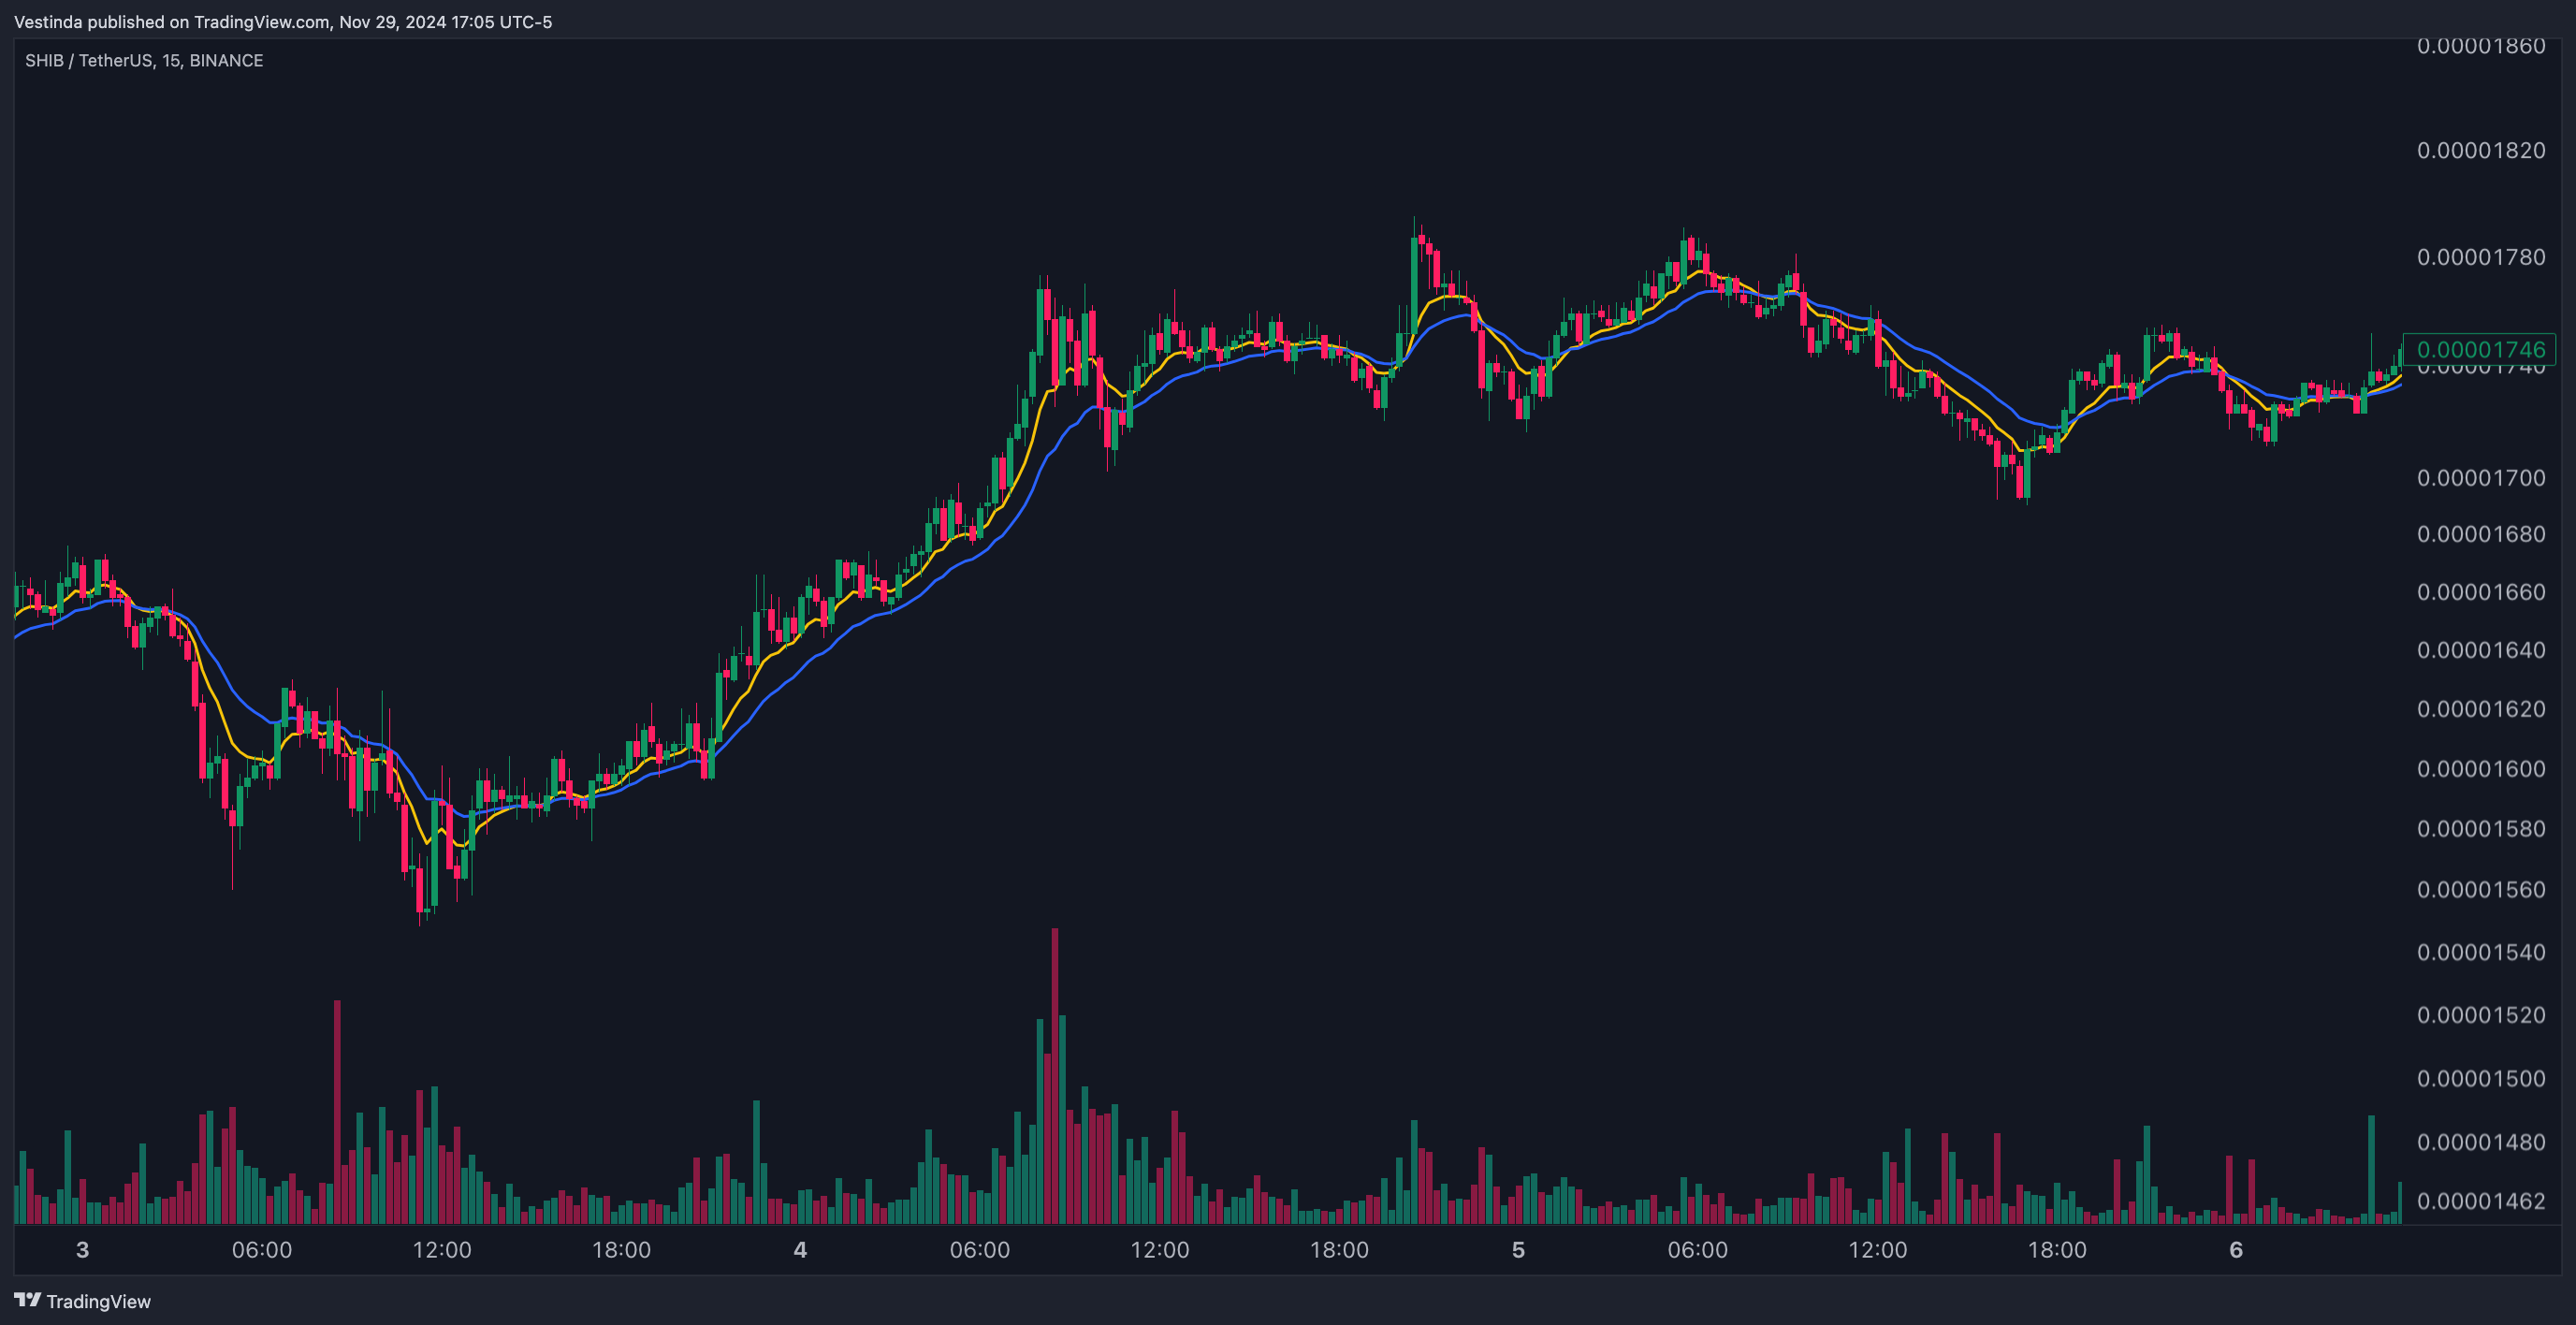
3. Dual Moving Average Crossover Strategy:
Concept: Use two moving averages to generate entry and exit signals.
- Setup: Apply a 10-period EMA (fast) and a 20-period EMA (slow).
- Execution Rules:
- Buy Signal: Enter long when the fast EMA crosses above the slow EMA.
- Sell Signal: Exit when the fast EMA crosses below the slow EMA.
- Best For: Intraday and short-term trading.
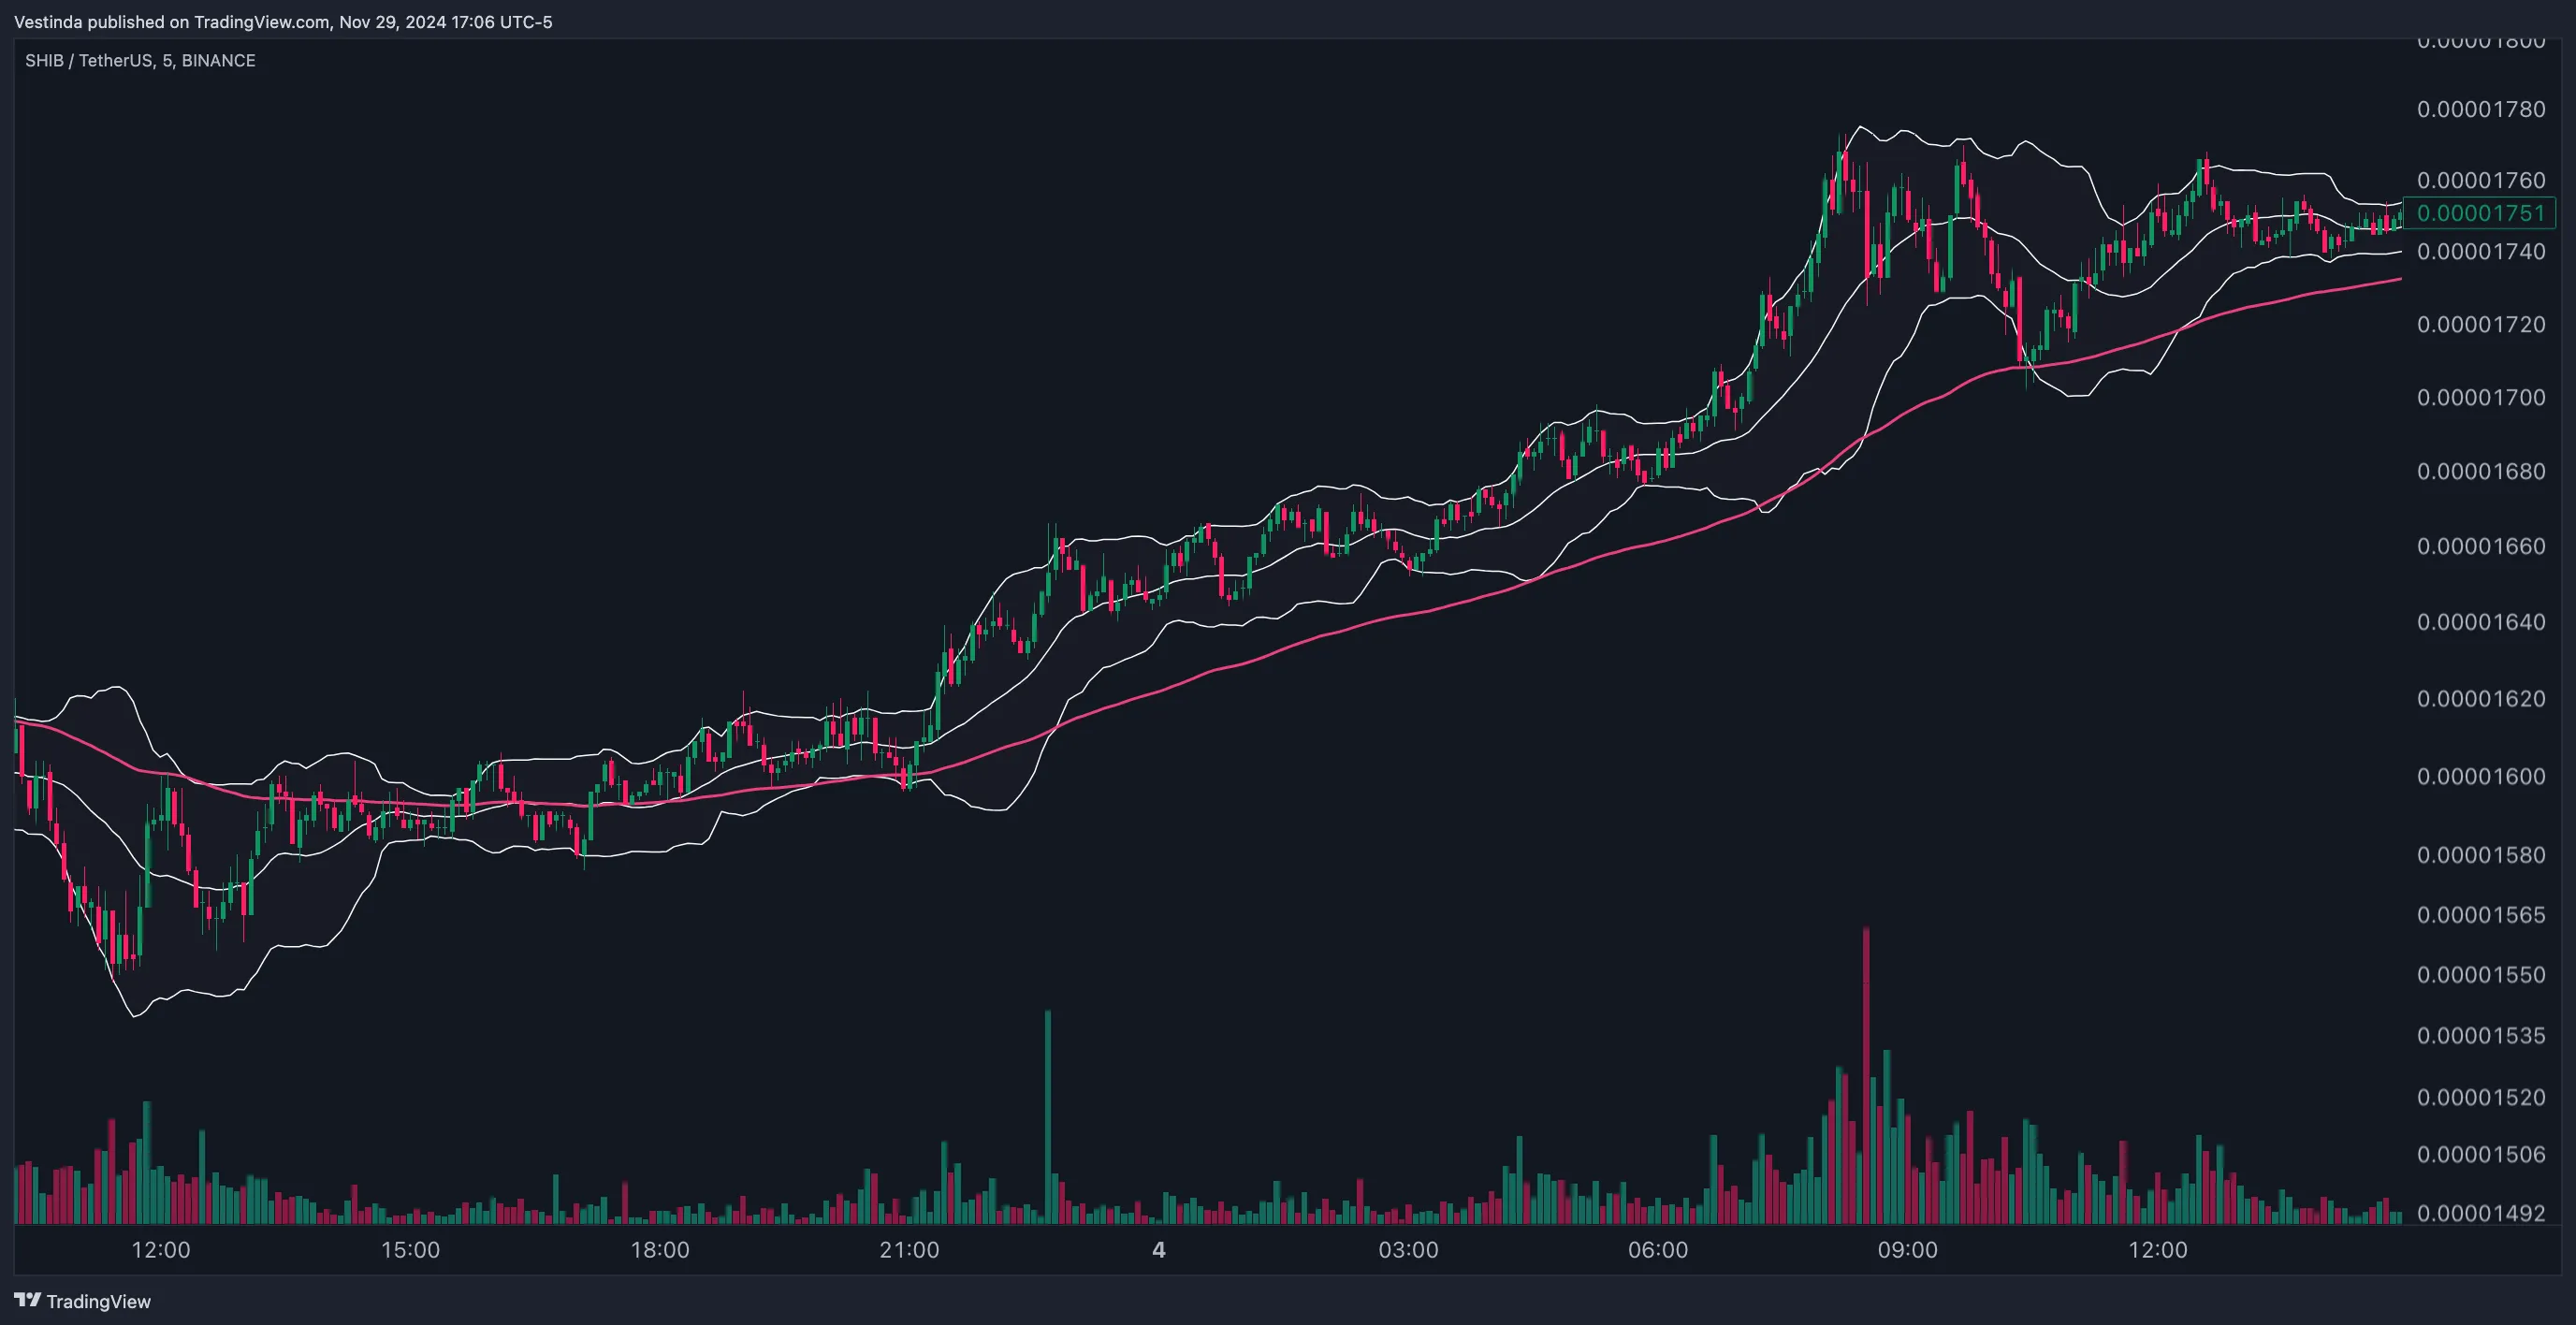
4. Moving Averages with Bollinger Bands:
Concept: Use moving averages in conjunction with Bollinger Bands to capture breakouts.
- Setup: Add a 100-period EMA as the base for Bollinger Bands.
- Execution Rules:
- Buy Signal: Enter long when SHIB price breaks above the upper band, confirmed by price staying above the moving average.
- Sell Signal: Exit when price falls back within the bands or below the moving average.
- Best For: Volatile market conditions.
How to Apply Moving Averages Effectively:
- Choose the Right Timeframe: Use shorter timeframes (e.g., 5-minute, 15-minute) for scalping. Use longer timeframes (e.g., 4-hour, daily) for swing or position trading.
- Combine with Other Indicators: Use MACD, RSI, or volume indicators to confirm moving average signals.
- Example: Confirm a Golden Cross with MACD showing a bullish crossover.
- Identify Key Levels: Use moving averages to spot dynamic support and resistance zones.
- Backtest Your Strategy: Test moving average setups on historical SHIB data to evaluate performance.
Risk Management Tips:
- Set Stop-Loss Orders: Place stop-losses below the moving average or recent swing lows.
- Define Profit Targets: Use prior resistance levels or Fibonacci extensions for take-profit levels.
- Position Sizing: Risk only 1-2% of your capital per trade.
Common Mistakes to Avoid:
- Ignoring Confirmation: Always combine moving average signals with other technical indicators.
- Overtrading: Focus on high-probability setups rather than chasing every signal.
- Neglecting Volatility: Adjust moving average settings to account for SHIB’s market volatility.
Conclusion:
Moving averages are versatile and reliable tools for trading Shiba Inu, helping traders identify trends, time entries, and manage exits. By employing strategies like the Golden Cross, moving average bounces, and dual crossovers, traders can capitalize on SHIB’s dynamic market conditions. Combine disciplined execution, risk management, and continuous refinement for sustained trading success.
Mastering SHIB: Unleashing Moving Averages' Potential
- Choose the time frame and period for calculating moving averages.
- Plot the closing prices of SHIB on a line chart.
- Calculate the simple moving average (SMA) by adding the closing prices and dividing by the number of periods.
- Plot the SMA as a line on the chart to identify the overall trend.
- Calculate the exponential moving average (EMA) by giving more weight to recent prices.
- Plot the EMA as a line on the chart to analyze short-term price movements.
- Identify bullish signals when the price crosses above the moving average lines.
- Spot bearish signals when the price crosses below the moving average lines.
- Use moving averages as support and resistance levels for price predictions and trade decisions.
Enhancing Moving Averages with Additional Indicators
When using moving averages, it can be beneficial to combine them with other technical indicators. This can help provide a more comprehensive view of the market trends and potential opportunities. For example, combining moving averages with oscillators such as the Relative Strength Index (RSI) can help identify overbought or oversold conditions, indicating possible reversals. By using multiple indicators, traders can confirm signals and reduce false alarms. Additionally, combining moving averages with Fibonacci retracement levels can help identify key support and resistance levels, adding further confirmation to trading decisions. It's important to note that no single indicator is foolproof, and traders should consider the overall market context and risk management strategies before making any trading decisions. As always, conducting thorough research and staying updated on market news is crucial, especially in volatile markets like SHIB.
Bearish Omen: SHIB and the Death Cross
The Death Cross is a bearish trading signal that occurs when the 50-day moving average crosses below the 200-day moving average. This pattern suggests a potential downturn in the market. In the context of cryptocurrencies, such as SHIB, the Death Cross can be a cause for concern among investors. It is often seen as a sign of impending price declines and can lead to increased selling pressure. Traders and investors often use this signal as an indication to exit positions or take short positions in an attempt to capitalize on the downward trend. However, it is important to note that technical analysis signals should not be solely relied upon for trading decisions, as market conditions can change rapidly. Therefore, it is essential to consider other factors and conduct thorough research before making any investment choices.
SHIB Chart: Configuring Moving Averages Efficiently
Setting up moving averages on SHIB charts is a useful tool for traders. It helps to filter out noise and identify trends in the price movement. First, select the desired time frame for the moving averages. Then, choose the type of moving average, such as simple or exponential. Calculate the average by adding up the closing prices over the specified period and dividing by that period's length. Plot the moving average on the SHIB chart to visualize the trend. Traders can use various moving averages, like the 50-day or 200-day, to gain insights into the stock's future direction. Moving averages serve as both support and resistance levels, guiding traders in their decision-making process. Overall, incorporating moving averages on SHIB charts is a valuable technique for traders looking to enhance their analysis and make informed trading decisions.






Frequently Asked Questions
The 50-day Moving Average is a widely used technical indicator in SHIB trading. It helps traders to assess the overall trend and potential price reversals. When the price is consistently above the 50-day Moving Average, it suggests a bullish trend, indicating a good time to buy or hold SHIB. Conversely, if the price consistently falls below the Moving Average, it signals a bearish trend, suggesting a potential selling opportunity. Traders often rely on this indicator to make informed decisions and identify potential entry or exit points in SHIB trading.
Moving averages can be utilized in retirement accounts for SHIB investment strategies, but investors should exercise caution. Since SHIB is a highly volatile and speculative cryptocurrency, relying solely on moving averages may not be sufficient. While moving averages can offer insights into price trends, other factors like market sentiment, news, and fundamental analysis should also be considered. Diversification and risk management are crucial in retirement accounts, so it is advisable to consult with a financial advisor who can provide personalized guidance based on individual risk tolerance and investment objectives.
To adjust Moving Average parameters for better performance in SHIB trading, there are a few key factors to consider. First, ensure the time period used for the Moving Average aligns with the market trend you aim to capture. A shorter period may generate more signals but also more false positives. Additionally, adjusting the Moving Average type (simple, exponential, weighted) can impact sensitivity. Experimentation with different parameters is crucial to find the best fit for your SHIB trading strategy. Lastly, consider combining Moving Averages with other technical indicators for a more comprehensive analysis. Remember, sound risk management practices are essential when using Moving Averages or any other trading tool.
The Moving Average strategy can be less effective during SHIB price manipulation events due to sudden and unpredictable price fluctuations. These events often involve rapid and significant price movements, causing short-term distortions in the Moving Average indicator. As a result, the strategy may generate false signals or lag behind the market action during such events. Traders relying solely on moving averages may face challenges in accurately identifying and reacting to the manipulated price movements, making it essential to incorporate additional indicators or strategies to mitigate potential risks.
The impact of macroeconomic indicators on the accuracy of Moving Averages (MAs) in SHIB trading can be significant. Macroeconomic indicators, such as interest rates, GDP growth, and inflation, influence market sentiment and investor behavior. As a result, they can affect the price movements of cryptocurrencies like SHIB. MAs, which calculate the average price over a specified period, are sensitive to these price movements. Therefore, changes in macroeconomic indicators can result in shifts in SHIB's price dynamics, potentially impacting the accuracy of MAs as a technical analysis tool for trading the cryptocurrency. It is crucial for traders to monitor and consider these indicators alongside MAs for a more informed decision-making process.
Conclusion
In conclusion, SHIB moving averages trading strategies provide valuable insights into the price movements of Shiba Inu's digital currency. By using indicators such as Exponential Moving Average (EMA) and Simple Moving Average (SMA), traders can identify trends, support, and resistance levels. Combining moving averages with other technical indicators can help confirm signals and reduce false alarms. The Death Cross, a bearish trading signal, can be a cause for concern among investors but should not be solely relied upon for trading decisions. Setting up moving averages on SHIB charts is a useful tool for filtering out noise and identifying trends. Overall, incorporating moving averages on SHIB charts is a valuable technique for traders to make more informed trading decisions.

Successful traders rely on backtesting to be profitable.
Be like them with our
Free Backtesting Guide