-
Track your
Crypto Portfolio -
Copy Crypto trading
strategies -
Build trading strategies
with no code
-
Backtest trading strategies
on Crypto, Forex, Stocks, etc. -
Demo Trading
Risk-free Paper Trading -
Automate trading strategies
with Live Trading
Quantitative Strategies & Backtesting results using Parabolic Sar
Discover below a selection of trading strategies based on the Parabolic Sar indicator and how they have performed in backtesting. You can test all these strategies (and many more) for free on thousands of assets, using their complete historical data.
Quantitative Trading Strategy: RAVI Reversals with PSAR and Shadows on 0FUT
Based on the backtesting results statistics for the trading strategy conducted from October 31, 2022 to October 31, 2023, the strategy exhibited promising performance. With a profit factor of 3.65, the strategy generated significant returns relative to the risk taken. The annualized return on investment (ROI) stood at an impressive 73.83%, indicating the strategy's ability to outperform standard investment benchmarks. On average, positions were held for a week, with an average of 0.21 trades executed per week. The strategy resulted in 11 closed trades, with a winning trades percentage of 45.45%. Notably, the strategy fared better than buy and hold, delivering excess returns of 1.08%. These results signal the potential viability and profitability of the trading strategy.
 0FUT
0FUT

Choose another period and try again.
Quantitative Trading Strategy: MACD and PSAR Reversals on XMC.U
The backtesting results for the trading strategy from October 22, 2019, to October 27, 2023, show promising statistics. The strategy has a profit factor of 2.23, indicating that for every dollar invested, it generated a profit of $2.23. The annualized return on investment (ROI) stands at 7.28%, suggesting a consistent growth rate over time. The average holding time for trades is approximately 2 weeks 4 days, indicating a medium-term trading approach. With an average of 0.11 trades per week, the strategy demonstrates low-frequency trading. There were a total of 25 closed trades, out of which 48% were winning trades. Interestingly, this strategy outperforms the buy-and-hold approach, generating excess returns of 6.39%. Overall, these results indicate a successful trading strategy with consistent profitability.
 XMC.U
XMC.U
Choose another period and try again.
Parabolic SAR Backtesting Strategies: The Ultimate Guide
Introduction
The Parabolic SAR (Stop and Reverse) indicator is a popular tool for identifying trends and setting stop levels in trading. Known for its effectiveness in trending markets, the Parabolic SAR helps traders pinpoint entry and exit points by tracking momentum and direction changes. This guide will explain how to implement Parabolic SAR strategies and use backtesting to validate and optimize your approach, improving accuracy and performance in live trading.
What is the Parabolic SAR?
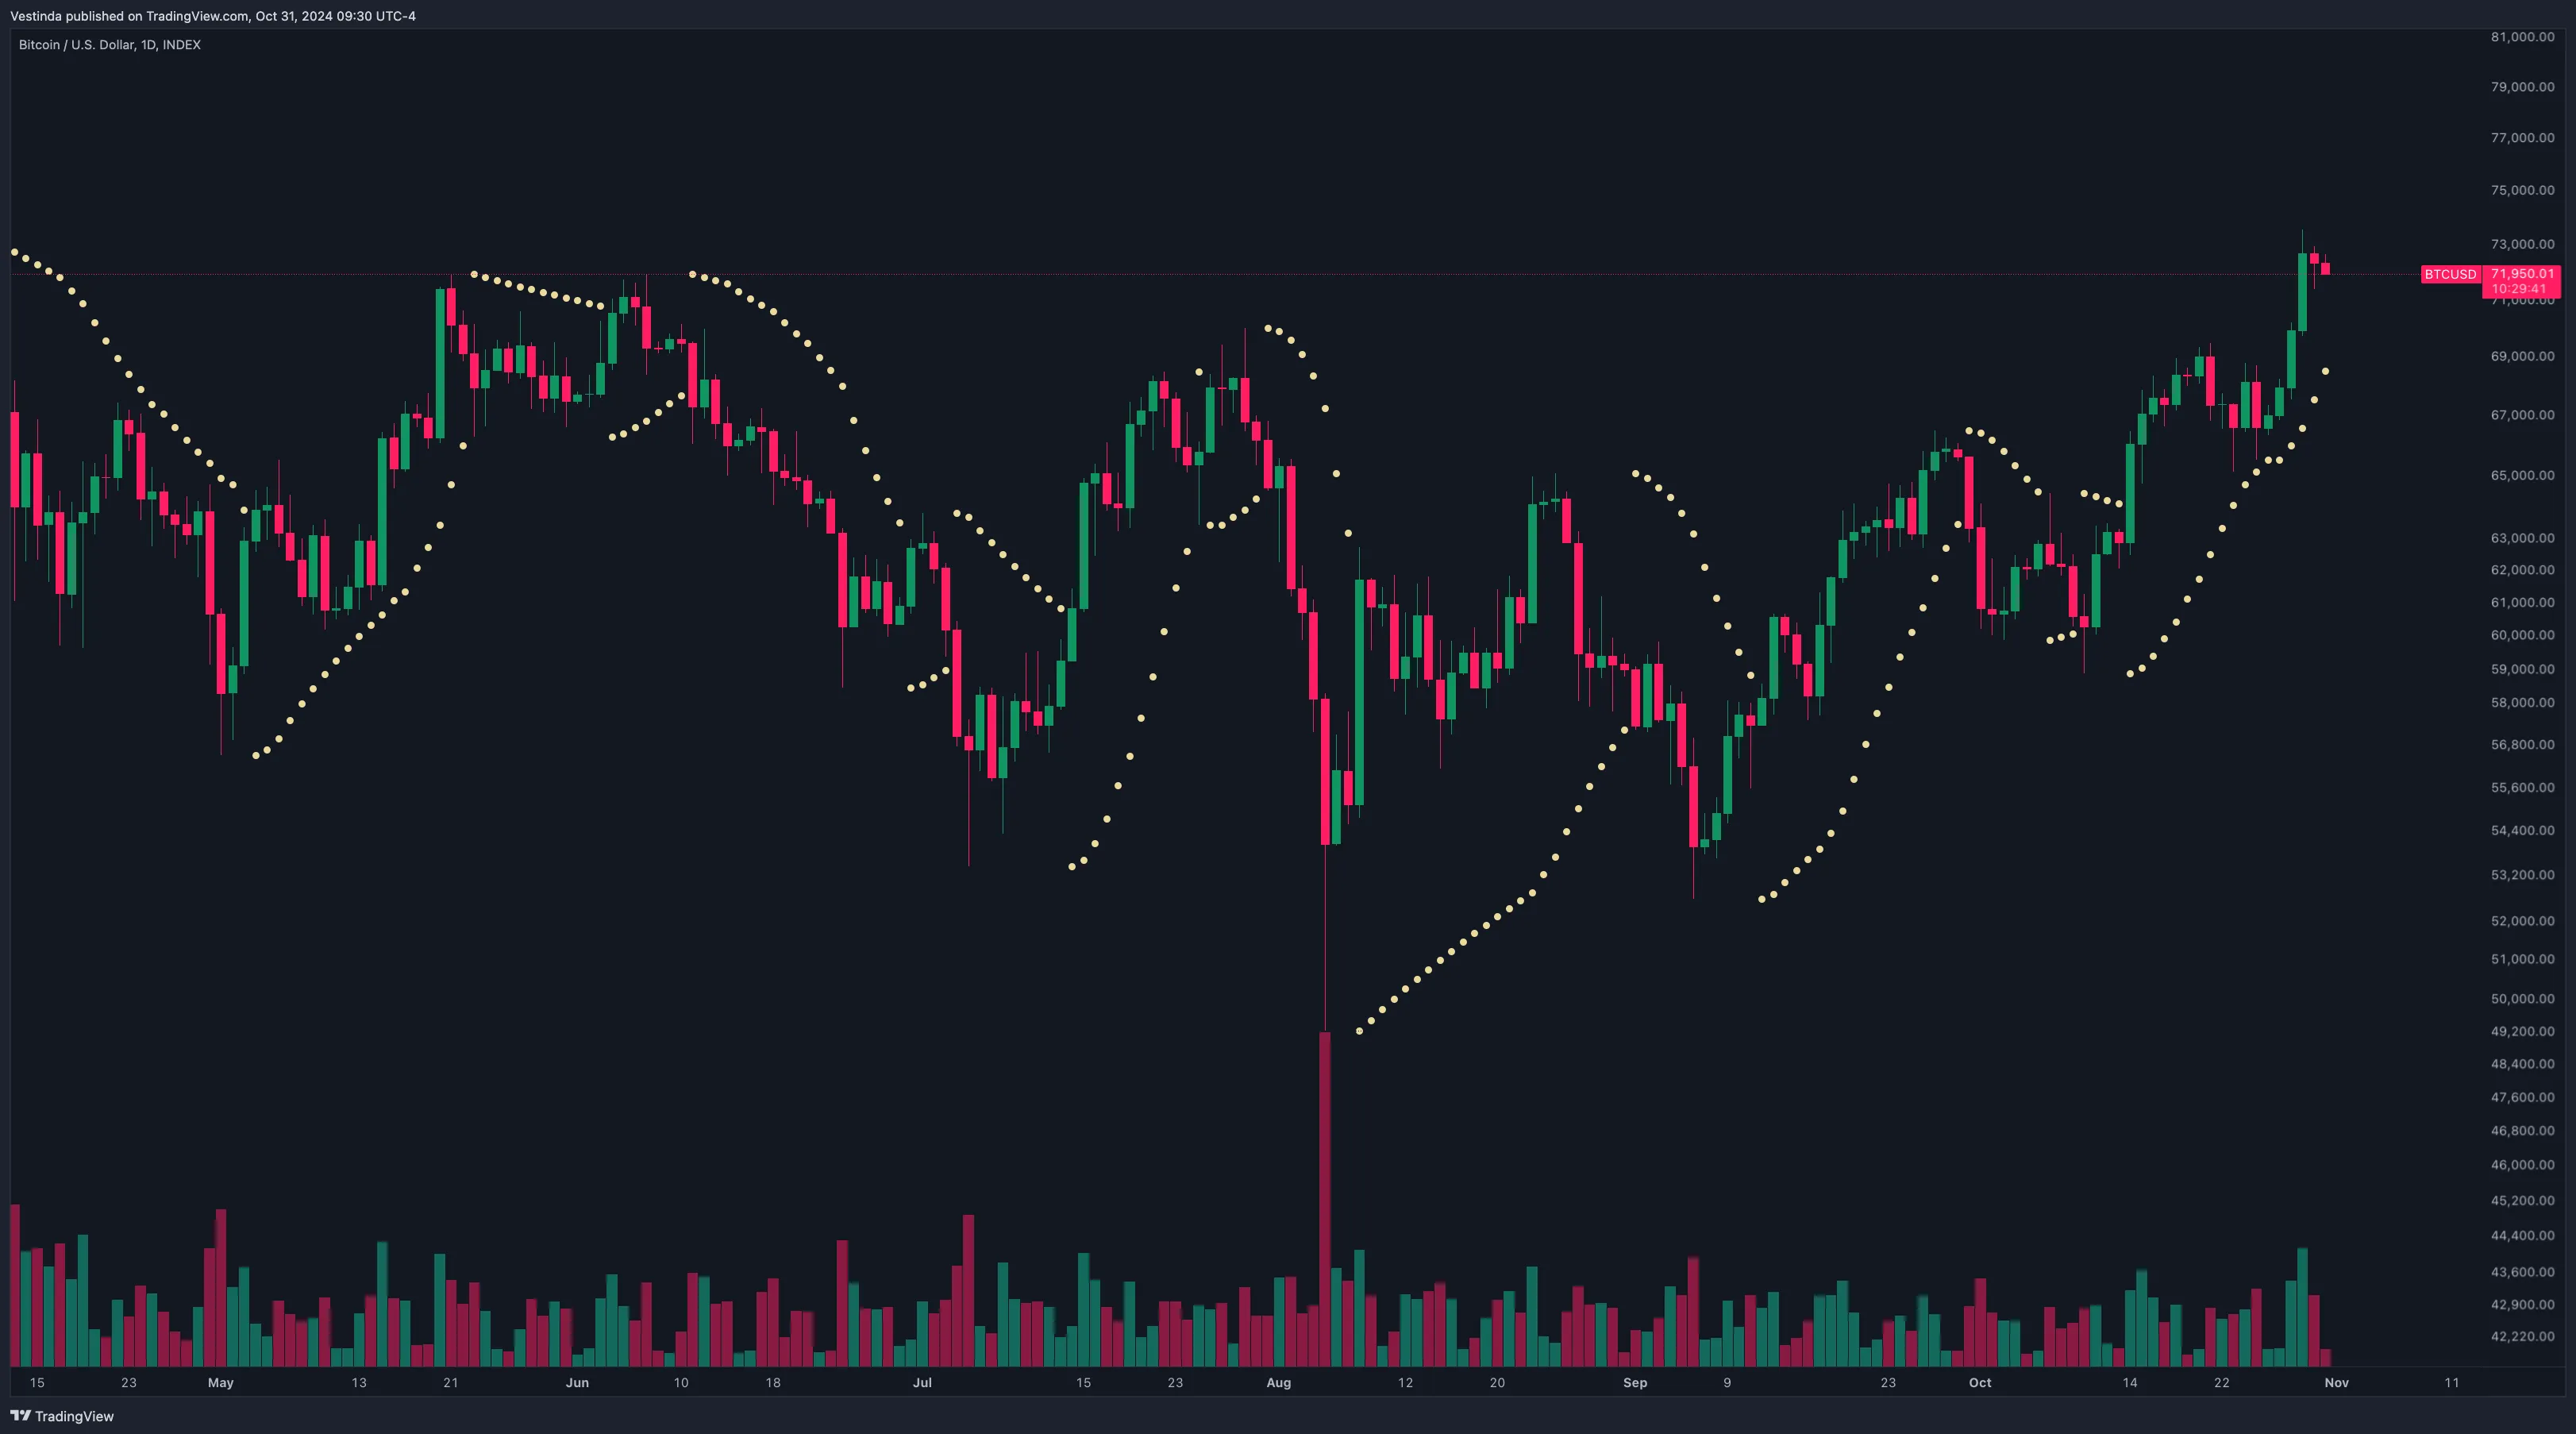
- Definition: The Parabolic SAR plots points on a price chart to signal the direction of an asset’s price movement, switching from below to above the price to indicate trend reversals.
- Purpose: It serves as both a trend-following indicator and a trailing stop, helping traders stay in profitable trends while avoiding premature exits.
- How It Works: When the dots appear below the price, it indicates a bullish trend; when they are above the price, it suggests a bearish trend. The indicator “stops and reverses” as soon as the trend direction changes.
Core Trading Strategies Using Parabolic SAR:
1. Trend-Following Strategy with Parabolic SAR:
Concept: Use the Parabolic SAR to capture longer trends, entering trades when the indicator confirms the trend direction.
Why It Works: This strategy allows traders to follow strong trends while staying protected by the indicator’s trailing stop function.
How to Implement:
- Indicator Settings: Set the Parabolic SAR with default parameters (typically an acceleration factor of 0.02 with a maximum value of 0.2).
- Entry and Exit: Buy when Parabolic SAR dots switch below the price (bullish), and sell when they appear above (bearish).
- Backtesting Tip: Run this strategy on historical trending data to evaluate its performance, optimizing the acceleration factor for different market conditions.
2. Parabolic SAR with Moving Average Confirmation:
Concept: Combine the Parabolic SAR with a moving average to filter out false signals, only taking trades that align with the trend.
Why It Works: The moving average helps confirm the trend, reducing the likelihood of trading on weaker signals.
How to Implement:
- Indicators: Apply Parabolic SAR along with a 50-period EMA to confirm trends.
- Entry and Exit: Buy when Parabolic SAR is below the price and the price is above the 50 EMA. Sell when Parabolic SAR is above the price and the price is below the EMA.
- Backtesting Tip: Backtest with various EMA settings and analyze win rates across different timeframes to find the best combination.
3. Parabolic SAR and RSI for Reversal Trades:
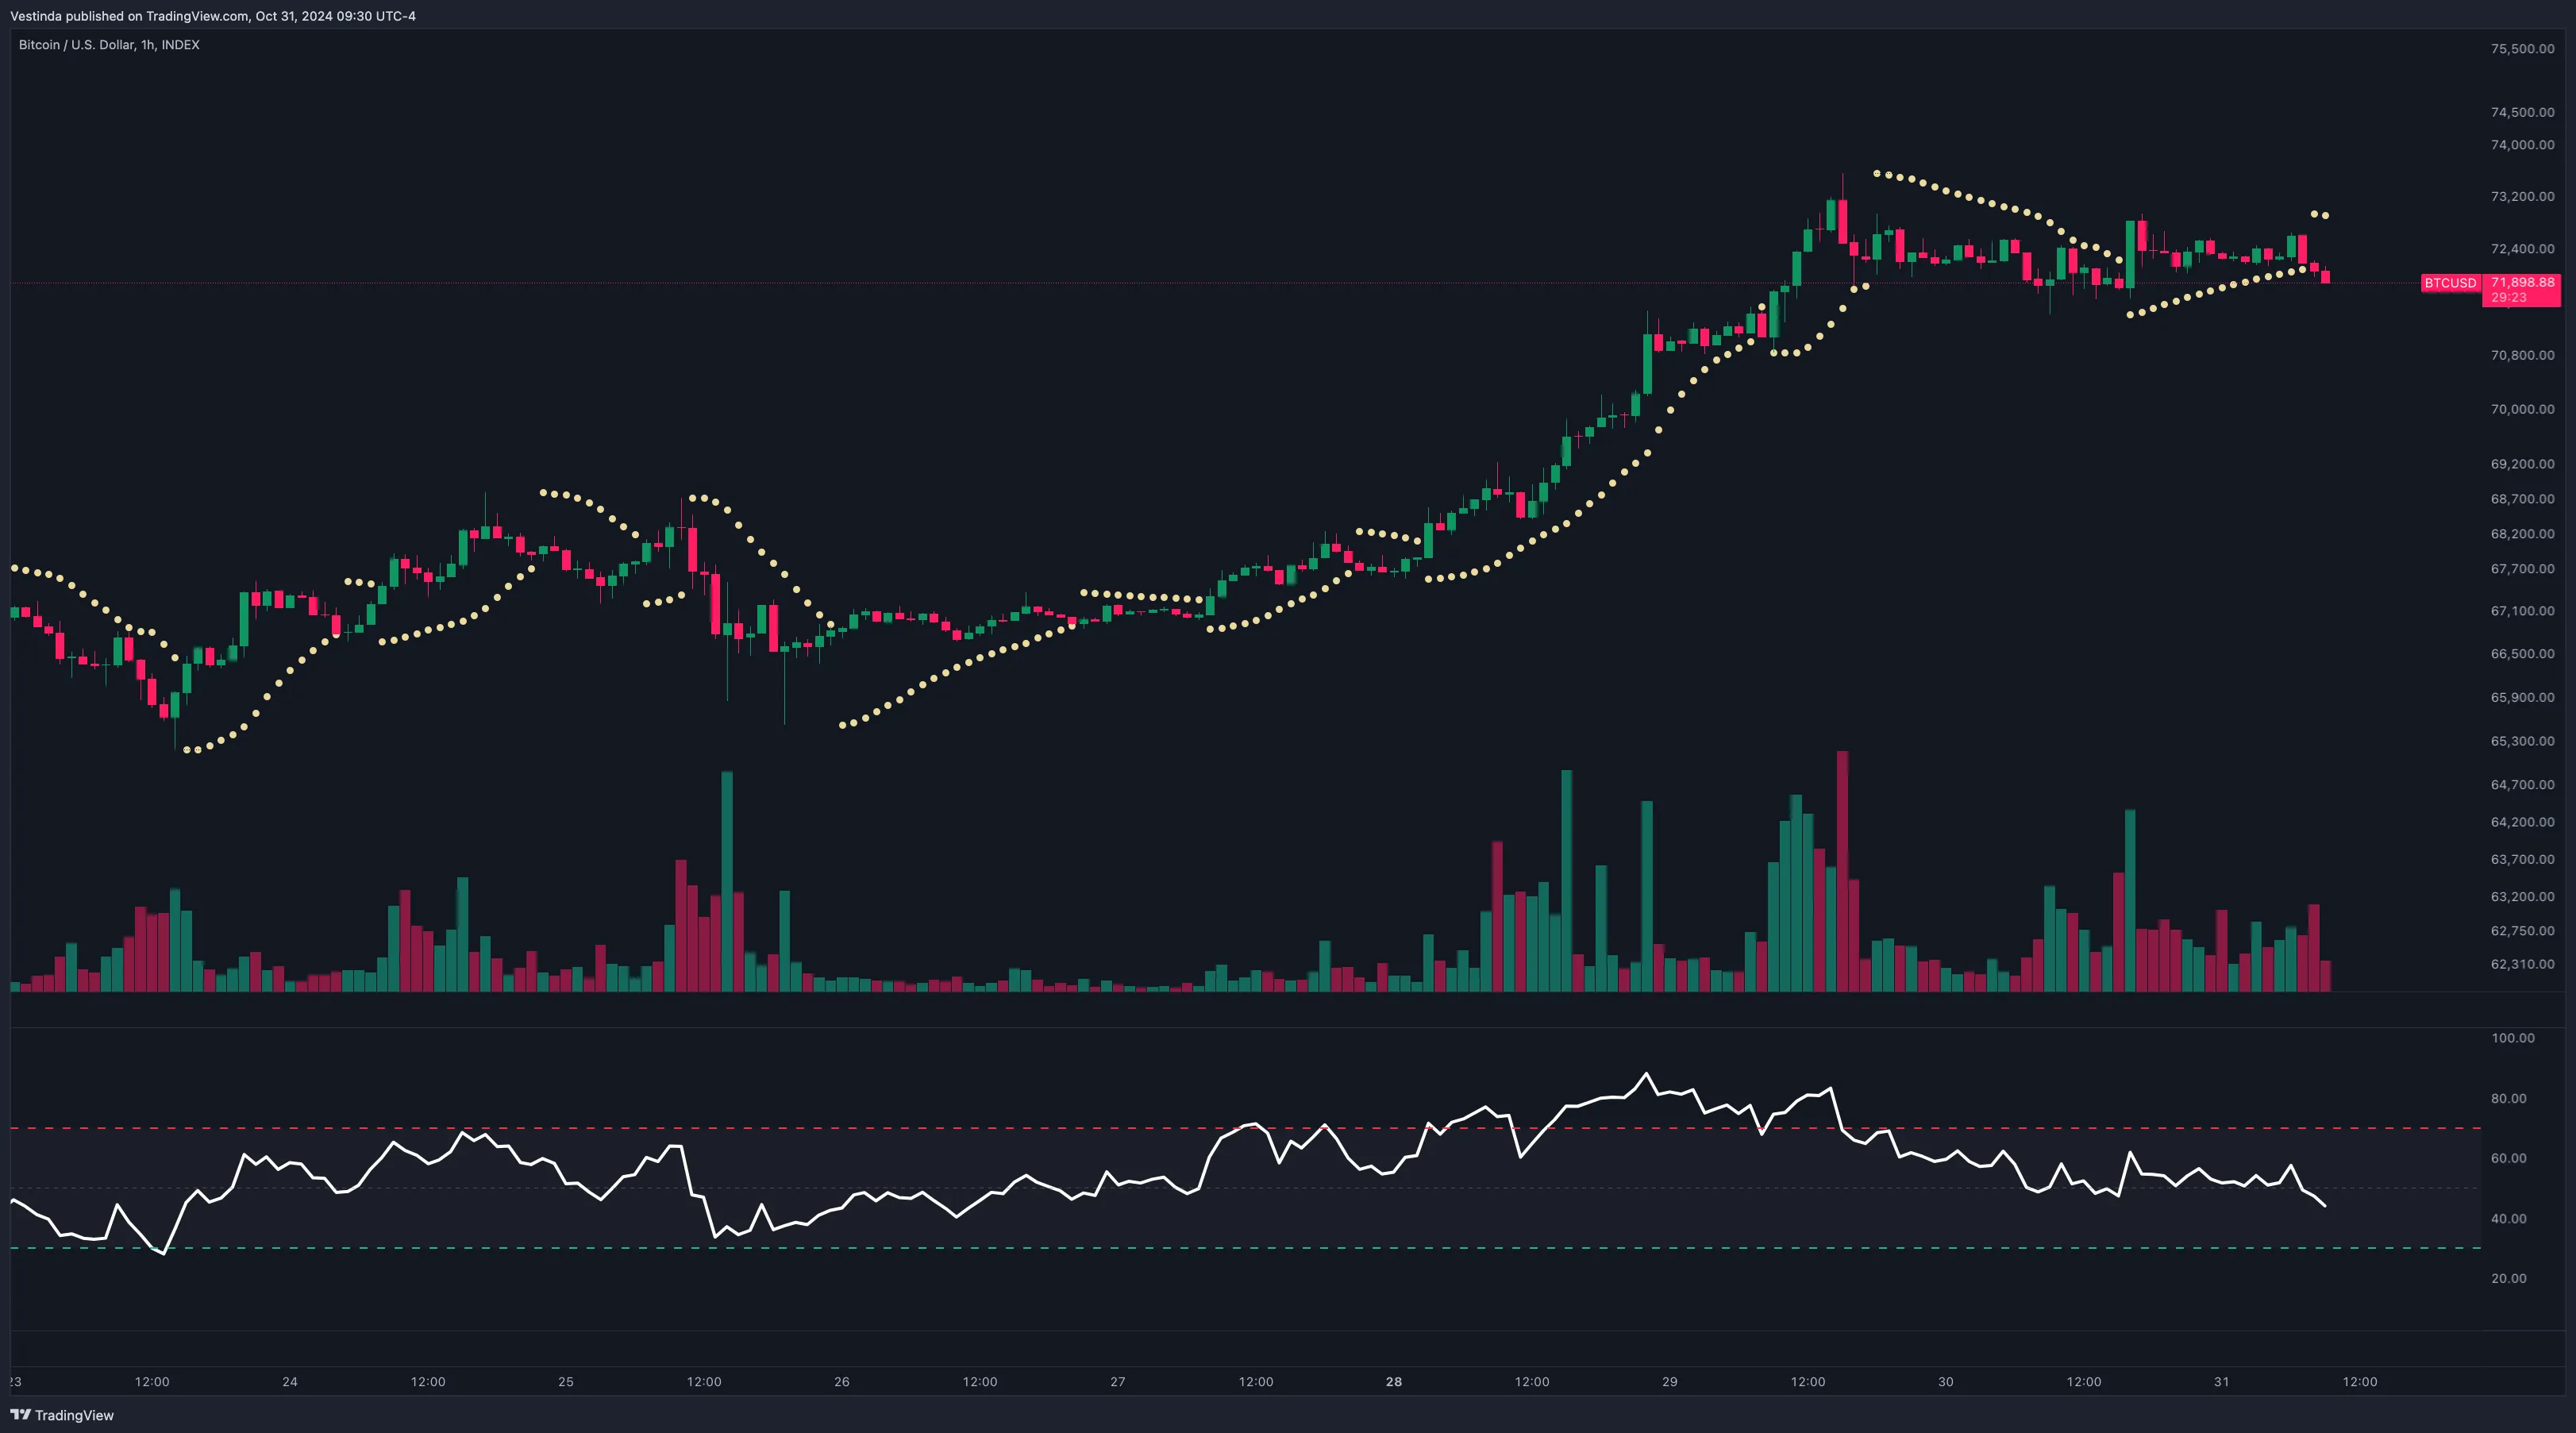
Concept: Use the Relative Strength Index (RSI) alongside the Parabolic SAR to capture reversals, entering trades when RSI indicates overbought/oversold conditions.
Why It Works: RSI identifies momentum extremes, adding a layer of confirmation to Parabolic SAR’s trend shifts.
How to Implement:
- Indicators: Set Parabolic SAR and RSI (with a 14-period setting) on the chart.
- Entry and Exit: Buy when Parabolic SAR indicates a bullish trend, and RSI is below 30 (oversold). Sell when Parabolic SAR indicates a bearish trend, and RSI is above 70 (overbought).
- Backtesting Tip: Test different RSI thresholds and Parabolic SAR settings to see how well this combination captures trend reversals.
4. Multi-Timeframe Strategy with Parabolic SAR:
Concept: Apply Parabolic SAR on multiple timeframes to increase the accuracy of entry and exit signals.
Why It Works: Using multi-timeframe analysis helps identify stronger trends by aligning signals from higher and lower timeframes.
How to Implement:
- Indicators: Apply Parabolic SAR on both daily and 4-hour charts, for example.
- Entry and Exit: Only enter trades when Parabolic SAR on both timeframes is in agreement. For example, buy when both timeframes show bullish Parabolic SAR signals.
- Backtesting Tip: Backtest the strategy across various timeframes and assets to measure consistency, focusing on trends that align across timeframes.
Combining Parabolic SAR with Other Indicators:
1. Parabolic SAR + MACD for Trend Confirmation:
How It Works: Use Parabolic SAR to detect trends and confirm signals with MACD crossovers, reducing false signals.
Example: Enter long when Parabolic SAR shows a bullish trend and MACD line crosses above the signal line. Exit or go short when the Parabolic SAR turns bearish and MACD line crosses below the signal line.
Backtesting Tip: Backtest on a variety of assets to assess the reliability of this indicator combination, adjusting MACD settings for best performance.
2. Parabolic SAR + Bollinger Bands for Volatility-Based Entries:
How It Works: Use Bollinger Bands to identify volatility and apply Parabolic SAR to capture trends. This combination works well in markets with frequent trend reversals.
Example: Buy when Parabolic SAR shows a bullish trend, and the price crosses above the lower Bollinger Band. Sell when Parabolic SAR is bearish, and the price touches the upper Bollinger Band.
Backtesting Tip: Test different Bollinger Band widths and Parabolic SAR parameters to evaluate performance in volatile conditions.
Risk Management with Parabolic SAR Strategies:
1. Setting Trailing Stops Using Parabolic SAR:
Concept: Use Parabolic SAR’s dots as trailing stops to lock in profits while allowing trades to continue if the trend remains favorable.
How to Implement: Set stop-loss levels slightly below or above the Parabolic SAR dots, moving them as the trend progresses.
Backtesting Tip: Measure how frequently trades are stopped out versus those that reach a take-profit level, adjusting SAR settings for optimal stop placement.
2. Position Sizing and Capital Allocation:
Concept: Adjust position sizes based on risk tolerance and account for volatility, particularly when using Parabolic SAR in trending markets.
How to Implement: Limit risk per trade to a small percentage of your portfolio, typically 1-2%, and increase position sizes gradually as confidence in the strategy grows.
Backtesting Tip: Simulate different position sizes in backtesting to understand the risk-to-reward balance under various conditions.
3. Regular Monitoring and Strategy Adjustments:
Concept: Review strategy performance periodically, adjusting Parabolic SAR settings as market conditions evolve.
How to Implement: Use backtesting data to track metrics like win rate, average return, and maximum drawdown, making necessary adjustments to improve the strategy’s adaptability.
Tip: Test different acceleration factors and maximum values in the Parabolic SAR to respond to changing market conditions.
Backtesting Your Parabolic SAR Strategy:
1. Backtesting Across Multiple Market Conditions:
Why: Testing in bull, bear, and range-bound markets ensures the strategy is robust and adaptable.
How to Implement: Run the Parabolic SAR strategy on historical data across different market cycles, assessing performance metrics to identify the best periods for each setup.
2. Continuous Monitoring and Live Adjustments:
Why: Ongoing performance monitoring allows for real-time adjustments, ensuring the strategy remains relevant in changing conditions.
How to Implement: Track live trades, comparing backtested results to actual performance, and make adjustments as needed for volatility and trend strength.
Conclusion:
Parabolic SAR strategies provide a structured approach to trend-following and reversal trading, with added reliability through backtesting. By combining Parabolic SAR with indicators like MACD, RSI, and Bollinger Bands, traders can capture SPY’s trends while managing risk effectively. Consistent backtesting and adjustments help validate these strategies, ensuring they align with evolving market conditions.
Simplified Parabolic SAR Backtesting Tutorial
- Choose a timeframe and symbol you want to backtest the Parabolic SAR indicator on.
- Gather historical price data for the chosen timeframe and symbol.
- Apply the Parabolic SAR indicator to the historical price data.
- Define the buy and sell signals based on the Parabolic SAR values.
- Backtest the strategy by applying the buy and sell signals to the historical data.
- Analyze the performance of the Parabolic SAR indicator based on the backtest results.
Analyzing Parabolic SAR Backtesting Findings
Interpreting Parabolic SAR backtesting results requires careful analysis of its signals. The indicator's primary purpose is to identify potential trend reversals in the market. Shorter sentences highlight key points and provide easily digestible information. However, longer sentences can elaborate on the nuances of the indicator's performance. Backtesting results may show instances where Parabolic SAR effectively predicted trend reversals, leading to profitable trades. By comparing the indicator's signals with actual market movements, traders can gauge its accuracy. It is crucial to consider the prevailing market conditions during the backtesting period, as Parabolic SAR's effectiveness may vary based on market volatility. Inconsistent signals or conflicting results should prompt further examination of the backtesting data. Ultimately, traders must interpret the Parabolic SAR backtesting results according to their own risk appetite, trading strategy, and market understanding.
Cross-Asset Parabolic SAR Backtesting Analysis
Backtesting Parabolic SAR strategies with different asset classes allows traders to evaluate the effectiveness of this popular trading indicator across various markets. By analyzing historical price data and applying Parabolic SAR as a trend-following tool, traders can identify potential entry and exit points. Results from backtesting reveal the indicator's performance and potential profitability in different asset classes such as equities, forex, commodities, and cryptocurrencies. Short-term traders may find Parabolic SAR particularly useful due to its ability to generate frequent signals. However, it's important to note that backtesting results should not be solely relied upon, as market conditions can evolve. Traders should consider other technical indicators, fundamental analysis, and risk management techniques in conjunction with Parabolic SAR strategies to make informed trading decisions. Overall, backtesting allows traders to fine-tune their Parabolic SAR strategies and adapt them to different markets for increased trading success.
Mastering Parabolic SAR Trading Techniques
The Parabolic SAR is a popular technical analysis tool used by traders to identify potential entry and exit points in the market. It is a trend-following indicator that is extremely effective in trending markets. The Parabolic SAR calculates its values based on the direction of the market and constantly adjusts its position on the chart. It appears as a series of dots above or below the price bars, indicating the potential reversal points in the market. When the dots are below the price bars, it suggests an uptrend, while dots above indicate a downtrend. Traders use the Parabolic SAR in combination with other indicators to confirm trading signals and manage risk. It is crucial to understand that the Parabolic SAR is not designed for use in range-bound or choppy markets, as false signals may occur.
-
 Create
account -
 Build trading strategies
with no code -
 Validate
& Backtest -
 Connect exchange
& start earning
Frequently Asked Questions
To automatically backtest on TradingView, you can utilize the Pine Script programming language. Write a script that defines your desired trading strategy, including entry and exit conditions. Apply the script to a chart, select the timeframe you wish to test, and click on the "Add to Chart" button. This will prompt TradingView to backtest your strategy against historical data, providing you with performance metrics and equity curve analysis. Automated backtesting on TradingView allows you to evaluate the effectiveness of your strategy without manual effort, enabling efficient and data-driven trading decisions.
To start backtesting, follow these essential steps:
1. Define your trading strategy, including entry/exit signals, risk management rules, and position sizing.
2. Gather historical data for the desired investment instrument.
3. Use backtesting software or programming languages like Python to simulate trades based on your strategy using historical data.
4. Assess the performance metrics, such as profit/loss, win rate, maximum drawdown, and risk-adjusted returns.
5. Iterate and refine your strategy, making appropriate adjustments based on the backtesting results.
6. Validate the strategy with out-of-sample data and continue optimizing. Remember, backtesting is not foolproof, so exercise caution when applying the findings to real trading.
There is no definitive answer to which trading strategy is the most accurate, as it ultimately depends on market conditions, individual preferences, and risk tolerance. Different strategies such as trend following, mean reversion, or momentum trading can be effective depending on the market environment. Additionally, one's ability to manage risk, conduct thorough research, and maintain discipline are crucial factors for success. Traders should focus on adopting a strategy that aligns with their goals and continuously adapt and refine it based on their experience and market dynamics.
The statistical methods commonly used for analyzing Parabolic SAR backtesting results include measuring the overall profitability of the strategy through metrics such as average return, standard deviation of returns, and maximum drawdown. Additionally, performance ratios like the Sharpe ratio and Sortino ratio can be calculated to evaluate risk-adjusted returns. Other statistical techniques, such as t-tests and analysis of variance (ANOVA), can be employed to determine if the strategy's returns are statistically significant compared to a benchmark or the market. These methods provide insights into the effectiveness and reliability of the Parabolic SAR strategy in generating consistent profits.
Conclusion
In conclusion, Parabolic SAR backtesting is a necessary step for traders to evaluate the effectiveness of this indicator in their trading strategies. By conducting historical simulations and analyzing the performance of Parabolic SAR signals, traders can make more informed decisions when entering and exiting trades. However, it is essential to be aware of the pitfalls of backtesting and use the appropriate software and techniques to ensure accurate results. Additionally, interpreting the backtesting results requires careful analysis of the indicator's signals and consideration of market conditions. Overall, backtesting is a valuable tool for optimizing Parabolic SAR strategies and increasing trading success.

Successful traders rely on backtesting to be profitable.
Be like them with our
Free Backtesting Guide