-
 Create
account -
 Build trading bots
with no code -
 Validate
& Backtest -
 Connect exchange
& start earning
Trading bots & Backtesting results using Bollinger Bands
Discover below a selection of trading bots based on the Bollinger Bands indicator and how they have performed in backtesting. You can test all these bots (and many more) for free on thousands of assets, using their complete historical data.
Trading bot: Template BB RSI on SPX
Based on the backtesting results statistics for the trading strategy, spanning from December 8, 2021, to December 8, 2023, several key insights can be derived. The strategy exhibits a profit factor of 5.83, indicating a favorable risk-reward ratio. The annualized return on investment (ROI) stands at 4.01%, which demonstrates consistent profitability over the stated period. The average holding time for trades is approximately 3 days and 23 hours, suggesting a relatively short-term approach. With a low average of 0.1 trades per week, the strategy focuses on quality rather than quantity. Out of the 11 closed trades, an impressive 72.73% were profitable, indicating a high success rate. Moreover, this strategy outperformed the buy and hold approach, generating excess returns of 10.28%. These statistics highlight the potential effectiveness and profitability of this trading strategy.
 SPX
SPX

Choose another period and try again.
Trading bot: Template BB RSI on FIZZ
Based on the backtesting results for the trading strategy, conducted from November 9, 2022, to November 9, 2023, the strategy exhibited promising performance. With a profit factor of 2.02, it suggests that for every dollar invested, an average profit of $2.02 was achieved. The annualized return on investment (ROI) stood at 5.55%, indicating a steady growth throughout the period. The average holding time for trades was approximately 3 days and 16 hours, reflecting a relatively short-term approach. Furthermore, with an average of 0.09 trades per week and a winning trade percentage of 80%, the strategy demonstrated consistency in generating profitable trades. Additionally, when compared to a passive buy-and-hold approach, it outperformed by generating excess returns of 0.5%. These backtesting results indicate the potential of this trading strategy for future implementation.
 FIZZ
FIZZ
Choose another period and try again.
Bollinger Bands Algo Trading Strategy: Effective Strategies and Tips
Introduction
Bollinger Bands are widely used to gauge market volatility, providing traders with visual signals for potential price breakouts, reversals, and trends. When applied within an algorithmic trading strategy, Bollinger Bands help automate entries and exits by reacting to shifts in volatility. This guide covers effective algo strategies using Bollinger Bands, tips for combining them with other indicators, and backtesting insights to optimize your approach.

What are Bollinger Bands?
- Definition: Bollinger Bands consist of a moving average line, typically a 20-period SMA, with upper and lower bands set a standard deviation away, usually at two standard deviations.
- Purpose: Bollinger Bands indicate periods of high and low volatility, helping traders identify breakouts, reversals, and continuations.
- Key Benefit: They provide a dynamic range for price movement, allowing for consistent identification of overbought or oversold conditions and potential trading signals.
Core Algo Trading Strategies Using Bollinger Bands:
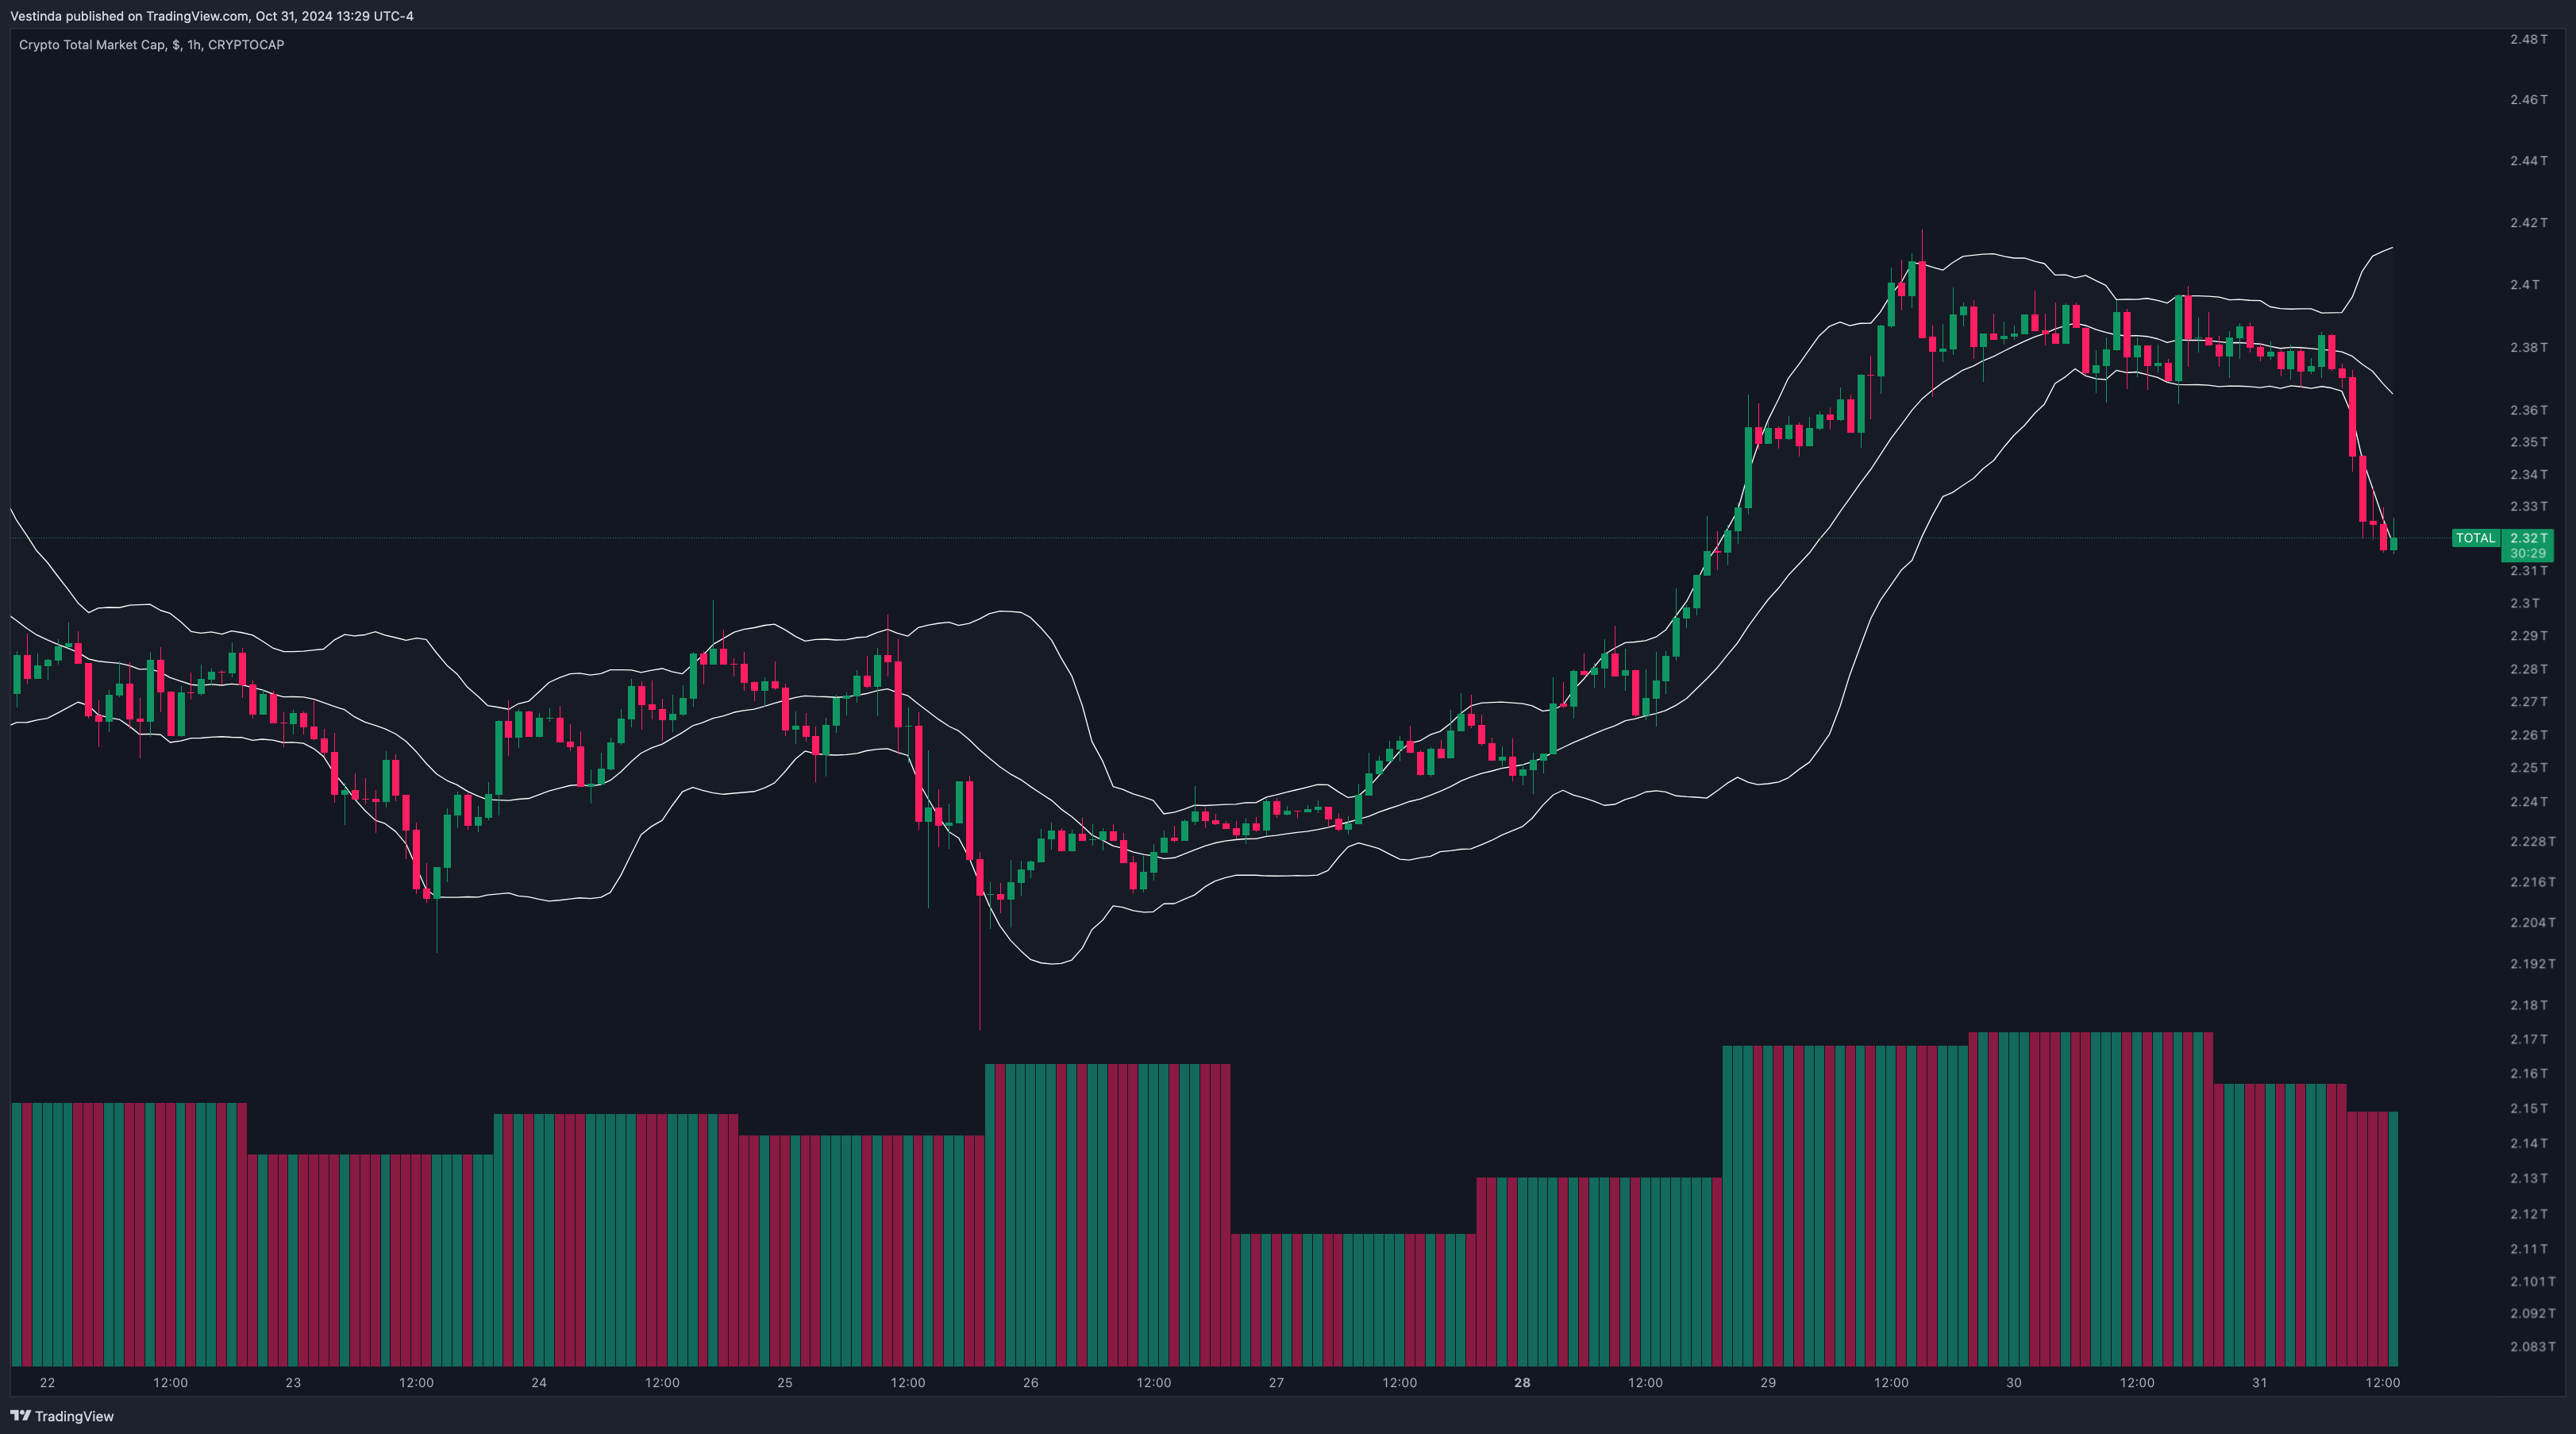
1. Breakout Strategy Using Bollinger Bands:
Concept: Automate trades based on breakouts when price moves outside the upper or lower Bollinger Bands, capturing volatile moves.
Why It Works: Price movement outside the bands often signals a trend continuation or reversal, creating trading opportunities as volatility spikes.
How to Implement:
- Indicator Setup: Set Bollinger Bands with a 20-period SMA and two standard deviations.
- Entry and Exit: Enter long when price closes above the upper band and short when it closes below the lower band. Exit when the price returns to the middle band or hits a stop.
- Backtesting Tip: Run this strategy on historical data to determine optimal take-profit and stop-loss levels, adjusting standard deviation settings based on market volatility.
2. Mean Reversion Strategy Using Bollinger Bands:
Concept: Trade based on the assumption that prices revert to the mean after touching the upper or lower Bollinger Bands.
Why It Works: Mean reversion is effective in range-bound markets, as prices often move back toward the center of the bands after touching the extremes.
How to Implement:
- Indicator Setup: Apply Bollinger Bands with standard settings (20-period SMA, two standard deviations).
- Entry and Exit: Go long when price touches the lower band and exit near the middle band. Go short when price touches the upper band and exit near the middle band.
- Backtesting Tip: Test on assets with strong range-bound behavior, and adjust the period or deviation settings based on market conditions.
3. Bollinger Band Squeeze Strategy for Trend Detection:
Concept: Use Bollinger Band squeezes (narrowing of bands) to identify periods of low volatility that often precede breakouts.
Why It Works: When Bollinger Bands tighten, it indicates consolidation, and subsequent expansion signals a strong trend movement.
How to Implement:
- Indicator Setup: Use Bollinger Bands with a volatility filter (e.g., Bollinger Band Width) to monitor for band tightening.
- Entry and Exit: Enter long on a breakout above the squeeze range or short on a breakdown below it, exiting when the opposite band is hit.
- Backtesting Tip: Test the squeeze strategy across various assets and timeframes to capture optimal breakout conditions.
Combining Bollinger Bands with Other Indicators for Confirmation:
1. Bollinger Bands + RSI for Overbought/Oversold Signals:
How It Works: Use Bollinger Bands to detect overbought/oversold conditions, confirming entries with RSI for momentum.
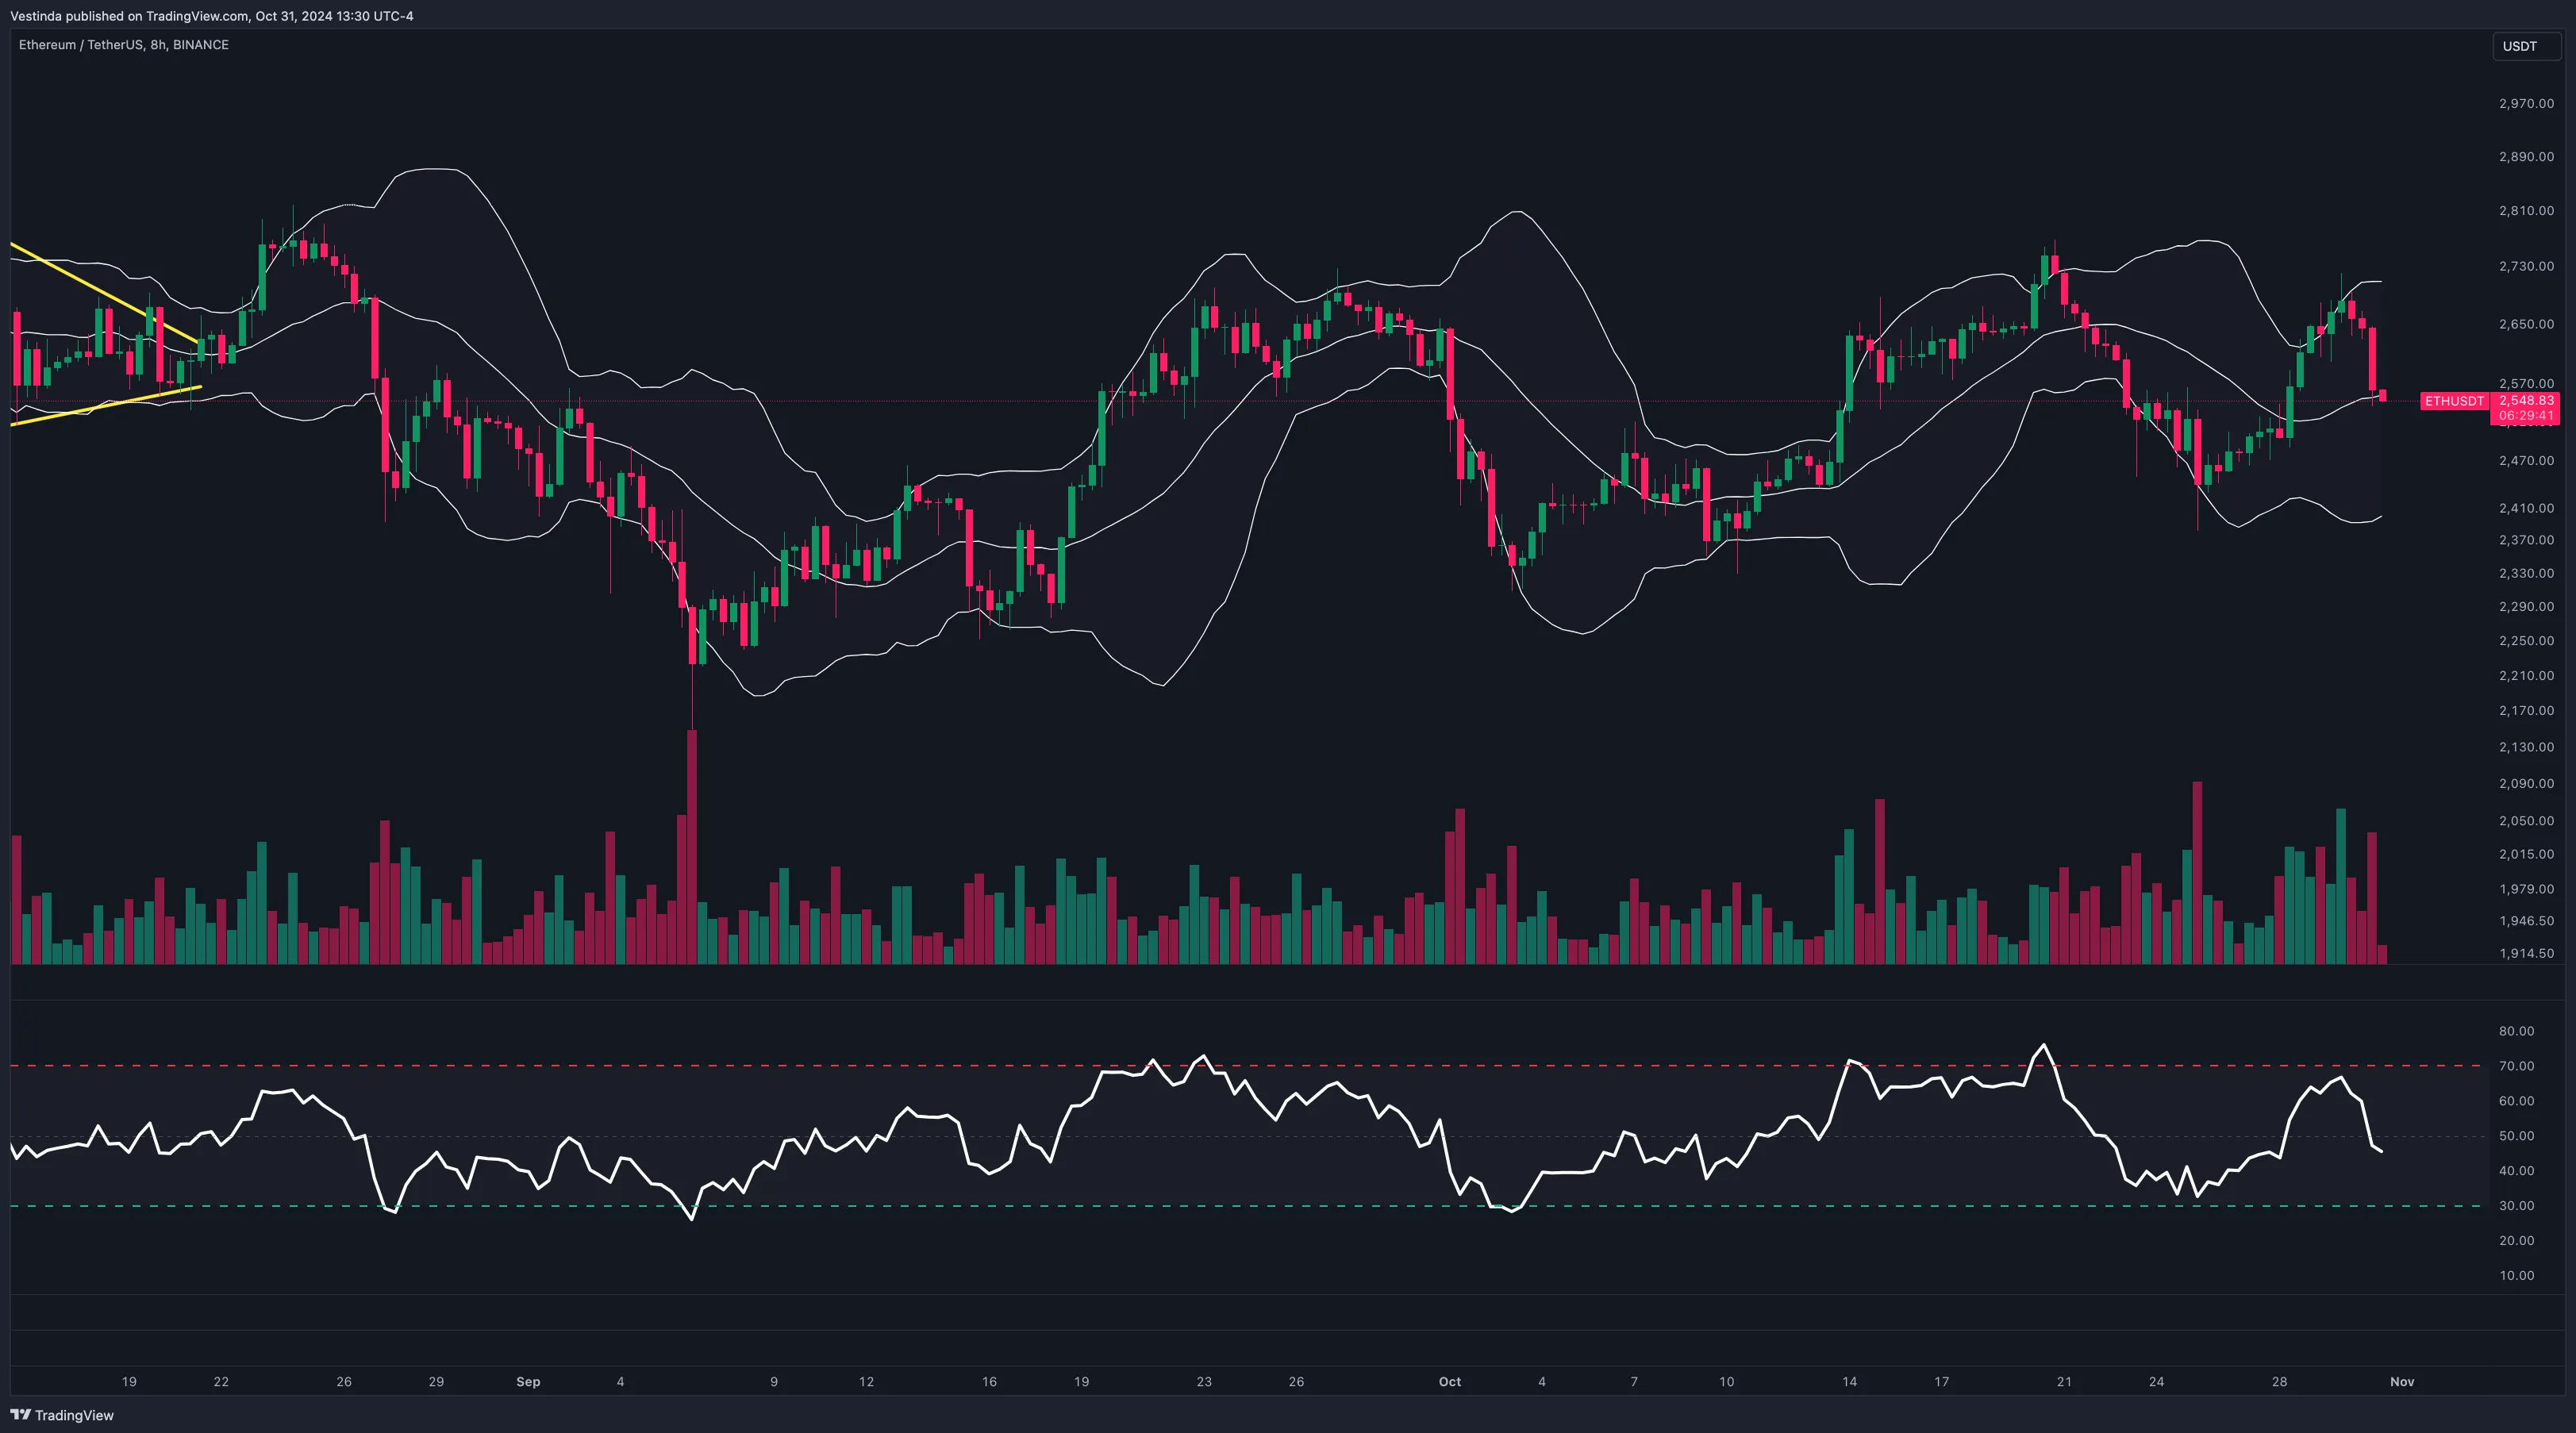
Example: Go long when price touches the lower band and RSI is below 30, indicating oversold conditions. Go short when price touches the upper band and RSI is above 70.
Backtesting Tip: Test this strategy across various markets, refining RSI thresholds to ensure alignment with Bollinger Bands.
2. Bollinger Bands + MACD for Trend Confirmation:
How It Works: Combine Bollinger Bands with MACD crossovers to confirm trend direction and strength.
Example: Go long when price breaks above the upper band with a bullish MACD crossover, or go short with a bearish MACD crossover when the price drops below the lower band.
Backtesting Tip: Test both indicators on historical data, adjusting MACD settings to align with the Bollinger Bands' responsiveness.
Risk Management in Bollinger Bands Algo Trading Strategies:
1. Position Sizing Based on Volatility:
Concept: Use volatility measures to determine position sizes, ensuring consistent risk exposure.
How to Implement: Calculate position sizes based on the width of the Bollinger Bands (greater width, smaller position).
Automation Tip: Program the bot to adjust position sizes according to the band width to maintain a balanced risk level.
2. Stop-Loss and Take-Profit Placement:
Concept: Set stop-loss and take-profit levels based on the band boundaries, using Bollinger Bands as dynamic support and resistance.
How to Implement: Place stop-loss orders outside the upper or lower band, setting take-profits at the middle band or predetermined targets.
Backtesting Tip: Test various stop-loss distances and take-profit ratios to optimize returns and manage risk.
3. Trailing Stops for Breakout Strategies:
Concept: Use trailing stops in breakout trades to capture extended moves while locking in profits as price trends outside the bands.
How to Implement: Set trailing stops a fixed distance from the entry or outside the bands, adjusting with each new high or low.
Automation Tip: Program trailing stops into the bot to ensure consistent risk management as price moves.
Backtesting and Optimizing Bollinger Bands Strategies:
1. Backtesting Across Multiple Market Conditions:
Purpose: Test strategies in different market conditions (trending, ranging) to ensure robustness and adaptability.
How to Implement: Run backtests on assets with varied volatility and range characteristics, adjusting band settings to identify the most resilient configurations.
2. Parameter Optimization for Algo Efficiency:
Purpose: Optimize Bollinger Band settings (period and standard deviation) to align with current market conditions and asset volatility.
How to Implement: Fine-tune the period, standard deviation, and any additional indicators, like RSI or MACD, based on live performance and backtesting data.
Conclusion:
Bollinger Bands algo trading strategies provide valuable insights into market volatility, offering clear guidelines for breakouts, mean reversion, and trend-following strategies. By integrating Bollinger Bands with other indicators and implementing strong risk management, traders can improve strategy reliability and profitability. Consistent backtesting and parameter adjustments ensure these strategies remain effective across varying market conditions.
Bollinger Bands: Mastering Automated Trading with Bots
1. Study and understand the concept of Bollinger Bands as a trading indicator.
2. Choose a reliable trading bot that supports Bollinger Bands and meets your requirements.
3. Configure the trading bot by setting the desired parameters for Bollinger Bands.
4. Connect your preferred cryptocurrency exchange account to the trading bot.
5. Test the trading bot with a demo account to ensure it works properly with Bollinger Bands.
6. Implement risk management strategies and define your desired trading goals.
7. Monitor the trading bot's performance and make necessary adjustments based on market conditions.
8. Continuously evaluate and optimize the trading bot's settings to maximize profits and minimize risks.
BolliBot: Automating DCA Trading with Bollinger Bands
The DCA Trading Bot for Bollinger Bands is a powerful tool designed for traders. It utilizes the Bollinger Bands indicator to enhance trading strategies. With this bot, traders can automate their DCA (Dollar-Cost Averaging) strategy based on Bollinger Bands signals. The Bollinger Bands indicator helps identify potential entry and exit points by displaying dynamic price levels. By using the DCA Trading Bot, traders can take advantage of these signals and execute trades automatically, saving time and effort. The bot allows users to customize their DCA parameters, including time intervals, stop-loss settings, and target profit levels. Furthermore, it provides real-time monitoring of trades and offers comprehensive reporting for analysis. Overall, the DCA Trading Bot for Bollinger Bands empowers traders with an efficient and integrated solution for maximizing profits.
Briefing: Agile Bot Utilizing Bollinger Bands Indicator
It consists of a middle band and two outer bands, representing price volatility. Traders often use Bollinger Bands to identify potential price reversals and breakout opportunities. A Bollinger Bands Scalping Trading Bot is a computer program that automatically executes trades based on Bollinger Bands signals. This bot scans the market for price movements that reach or exceed the outer bands and executes trades accordingly. By scalping small profits from these price fluctuations, the bot aims to generate consistent returns. With its automated nature, the Bollinger Bands Scalping Trading Bot eliminates the need for manual monitoring and allows traders to take advantage of trading opportunities 24/7. However, like any trading strategy, it is important for traders to understand the risks and set appropriate risk management parameters.
BolliBot: Maximize Swing Trading with Bollinger Bands
Bollinger Bands is a trading indicator that helps traders identify potential price reversals. It consists of a simple moving average line, an upper band, and a lower band. Using volatility and standard deviation, the upper and lower bands expand and contract as market conditions change. Traders use Bollinger Bands to gauge price levels that may be overbought or oversold and potentially indicate trend reversals. By combining Bollinger Bands with swing trading strategies, traders can capitalize on short-term price movements. A swing trading bot can automate this process, using Bollinger Bands as a key indicator to make trading decisions. As the bot identifies price levels reaching the upper or lower bands, it can execute trades accordingly, aiming to capture profit during periods of high volatility.
-
100,000 available assets New
-
years of historical data
-
practice without risking money

Frequently Asked Questions
Algo trading, also known as automated trading, involves the use of computer algorithms to execute trading strategies. While it can be complex and require a certain level of technical knowledge, algo trading is not exclusively for experienced traders. Various platforms and educational resources are available to help beginners understand and engage in algo trading. However, it is crucial for newcomers to thoroughly educate themselves, start with simple strategies, and gain practical experience before fully diving into the complexities of algorithmic trading.
The risk of bots lies in their potential to cause various harms and disruptions. Bots can be used for malicious activities such as spreading misinformation, hacking into systems, conducting cyber-attacks, or perpetuating scams. They can manipulate public opinion by amplifying certain narratives, undermining trust, or engaging in social engineering. Bots can also exploit vulnerabilities in online platforms, compromising user privacy and promoting cybercrime. Furthermore, the automation and efficiency of bots can lead to job displacement and economic inequality. Thus, it is crucial to implement robust security measures and regulations to mitigate the risks associated with bots.
There are several brokers that allow bot trading, enabling traders to automate their strategies. Some popular options include Interactive Brokers, TD Ameritrade, E*TRADE, and Alpaca. These brokers offer various APIs and platforms that support automated trading systems, allowing users to execute trades, monitor positions, and access market data programmatically. It's important to review each broker's specific requirements, fees, and limitations before engaging in bot trading.
When trading with Bollinger Bands using a trading bot, it is advisable to monitor its performance regularly. While there is no fixed frequency, checking in at least once a day is recommended. This allows you to assess the bot's performance, monitor any potential issues or errors, and make necessary adjustments. Continuous monitoring helps ensure effective implementation and timely responses to changing market conditions, maximizing the potential benefits of trading Bollinger Bands. Remember, active supervision can help prevent any losses or missed opportunities, ultimately improving your trading outcomes.
Trading bots can be risky if not used properly. They rely on algorithms to execute trades automatically, which can lead to substantial losses if the market conditions change rapidly or if the bot malfunctions. Moreover, trading bots may make decisions based on historical data that may not accurately reflect future market behavior. Lack of human intervention and emotional judgment can also be a potential risk. It is crucial to thoroughly research and test any trading bot, set appropriate risk parameters, and closely monitor its performance to mitigate potential risks.
Conclusion
In conclusion, the Bollinger Bands trading bot is a powerful tool that combines the accuracy of the Bollinger Bands indicator with the speed and precision of automated trading. By utilizing this bot, traders can save time and effort while taking full advantage of the popular Bollinger Bands indicator. With the ability to customize parameters and monitor performance in real-time, traders can optimize their trading strategies and maximize profits. Whether you're a swing trader or implementing a DCA strategy, the Bollinger Bands trading bot provides an efficient and integrated solution for enhancing your trading experience.

Successful traders rely on backtesting to be profitable.
Be like them with our
Free Backtesting Guide