-
Track your
Crypto Portfolio -
Copy Crypto trading
bots -
Build trading bots
with no code
-
Backtest trading bots
on Crypto, Forex, Stocks, etc. -
Demo Trading
Risk-free Paper Trading -
Automate trading bots
with Live Trading
Trading bots & Backtesting results using Volume
Discover below a selection of trading bots based on the Volume indicator and how they have performed in backtesting. You can test all these bots (and many more) for free on thousands of assets, using their complete historical data.
Trading bot: WMA Crossovers with Volume support on AUD
Based on the backtesting results statistics for the trading strategy from October 17, 2022, to October 17, 2023, it is evident that the strategy experienced challenges. The profit factor for the period was 0.2, indicating that the strategy did not generate significant profits relative to the losses incurred. The annualized return on investment (ROI) stood at -19.68%, suggesting a negative performance overall. On average, the holding time for trades was 4 hours and 11 minutes, while the strategy executed an average of 1.63 trades per week. The number of closed trades amounted to 85, with only 12.94% of them being winning trades. These results highlight the need for potential improvement and adjustment in the trading strategy to enhance future performance.

 AUDUSDT

Choose another period and try again.
Trading bot: WMA Crossovers with Volume support on NJR
The backtesting results for the trading strategy during the period from November 9, 2022, to November 9, 2023, reveal promising statistics. The profit factor stands at 1.95, indicating that the strategy generated nearly double the amount of profits compared to losses. The annualized return on investment (ROI) achieved an impressive 8.92%, showcasing positive growth. On average, positions were held for approximately 2 days and 10 hours, while there were, on average, 0.34 trades per week. The strategy concluded a total of 18 closed trades. Notably, the strategy outperformed the buy and hold approach by generating excess returns of 16.47%, demonstrating its effectiveness in enhancing investment outcomes.
 NJR
NJR
Choose another period and try again.
The Ultimate Volume-Based Trading Strategy (bot)
Building an ultimate trading strategy that leverages volume as the key indicator to profit in both bull and bear trends involves a thorough understanding of volume dynamics and their relationship with price movements. Here’s a structured approach to create such a strategy:

Key Concepts and Indicators
Volume Analysis
- Volume Spike: Sudden increase in volume often indicates the beginning of a significant price movement.
- Volume Divergence: Price makes a new high/low, but volume does not support the move, indicating a potential reversal.
Volume-Based Indicators
- On-Balance Volume (OBV): Measures cumulative buying/selling pressure.
- Volume Price Trend (VPT): Similar to OBV but factors in the percentage change in price.
- Accumulation/Distribution Line (A/D Line): Combines price and volume to show how much of the stock is being accumulated or distributed.
Volume-Weighted Average Price (VWAP)
- Acts as a benchmark for the day's trading, helps in identifying the trend.
- Buying above VWAP in a bull trend and selling below in a bear trend can be effective.
Volume-Only Strategy Components
Volume Spikes and Clusters
- Volume Spikes: Enter a trade when there is an unusually high volume spike compared to the average volume. This spike often indicates strong interest and can signal the start of a new trend.
- Volume Clusters: Multiple days of high volume can indicate accumulation or distribution, suggesting a significant upcoming move.
Volume Oscillators
- Chaikin Money Flow (CMF): Measures the buying and selling pressure based on volume. Positive CMF indicates buying pressure, while negative CMF indicates selling pressure.
- Volume Oscillator: Compares short-term and long-term volume moving averages. Positive values indicate increasing volume in the short term, while negative values suggest decreasing volume.

Volume Ratio Indicators
- Volume-Weighted Average Price (VWAP): Use VWAP as a dynamic benchmark. Trading above VWAP can be considered bullish, while trading below VWAP can be considered bearish.
- Volume-Price Trend (VPT): Similar to OBV but considers price changes. Increasing VPT indicates a strengthening trend, while decreasing VPT suggests weakening.
Accumulation/Distribution Techniques
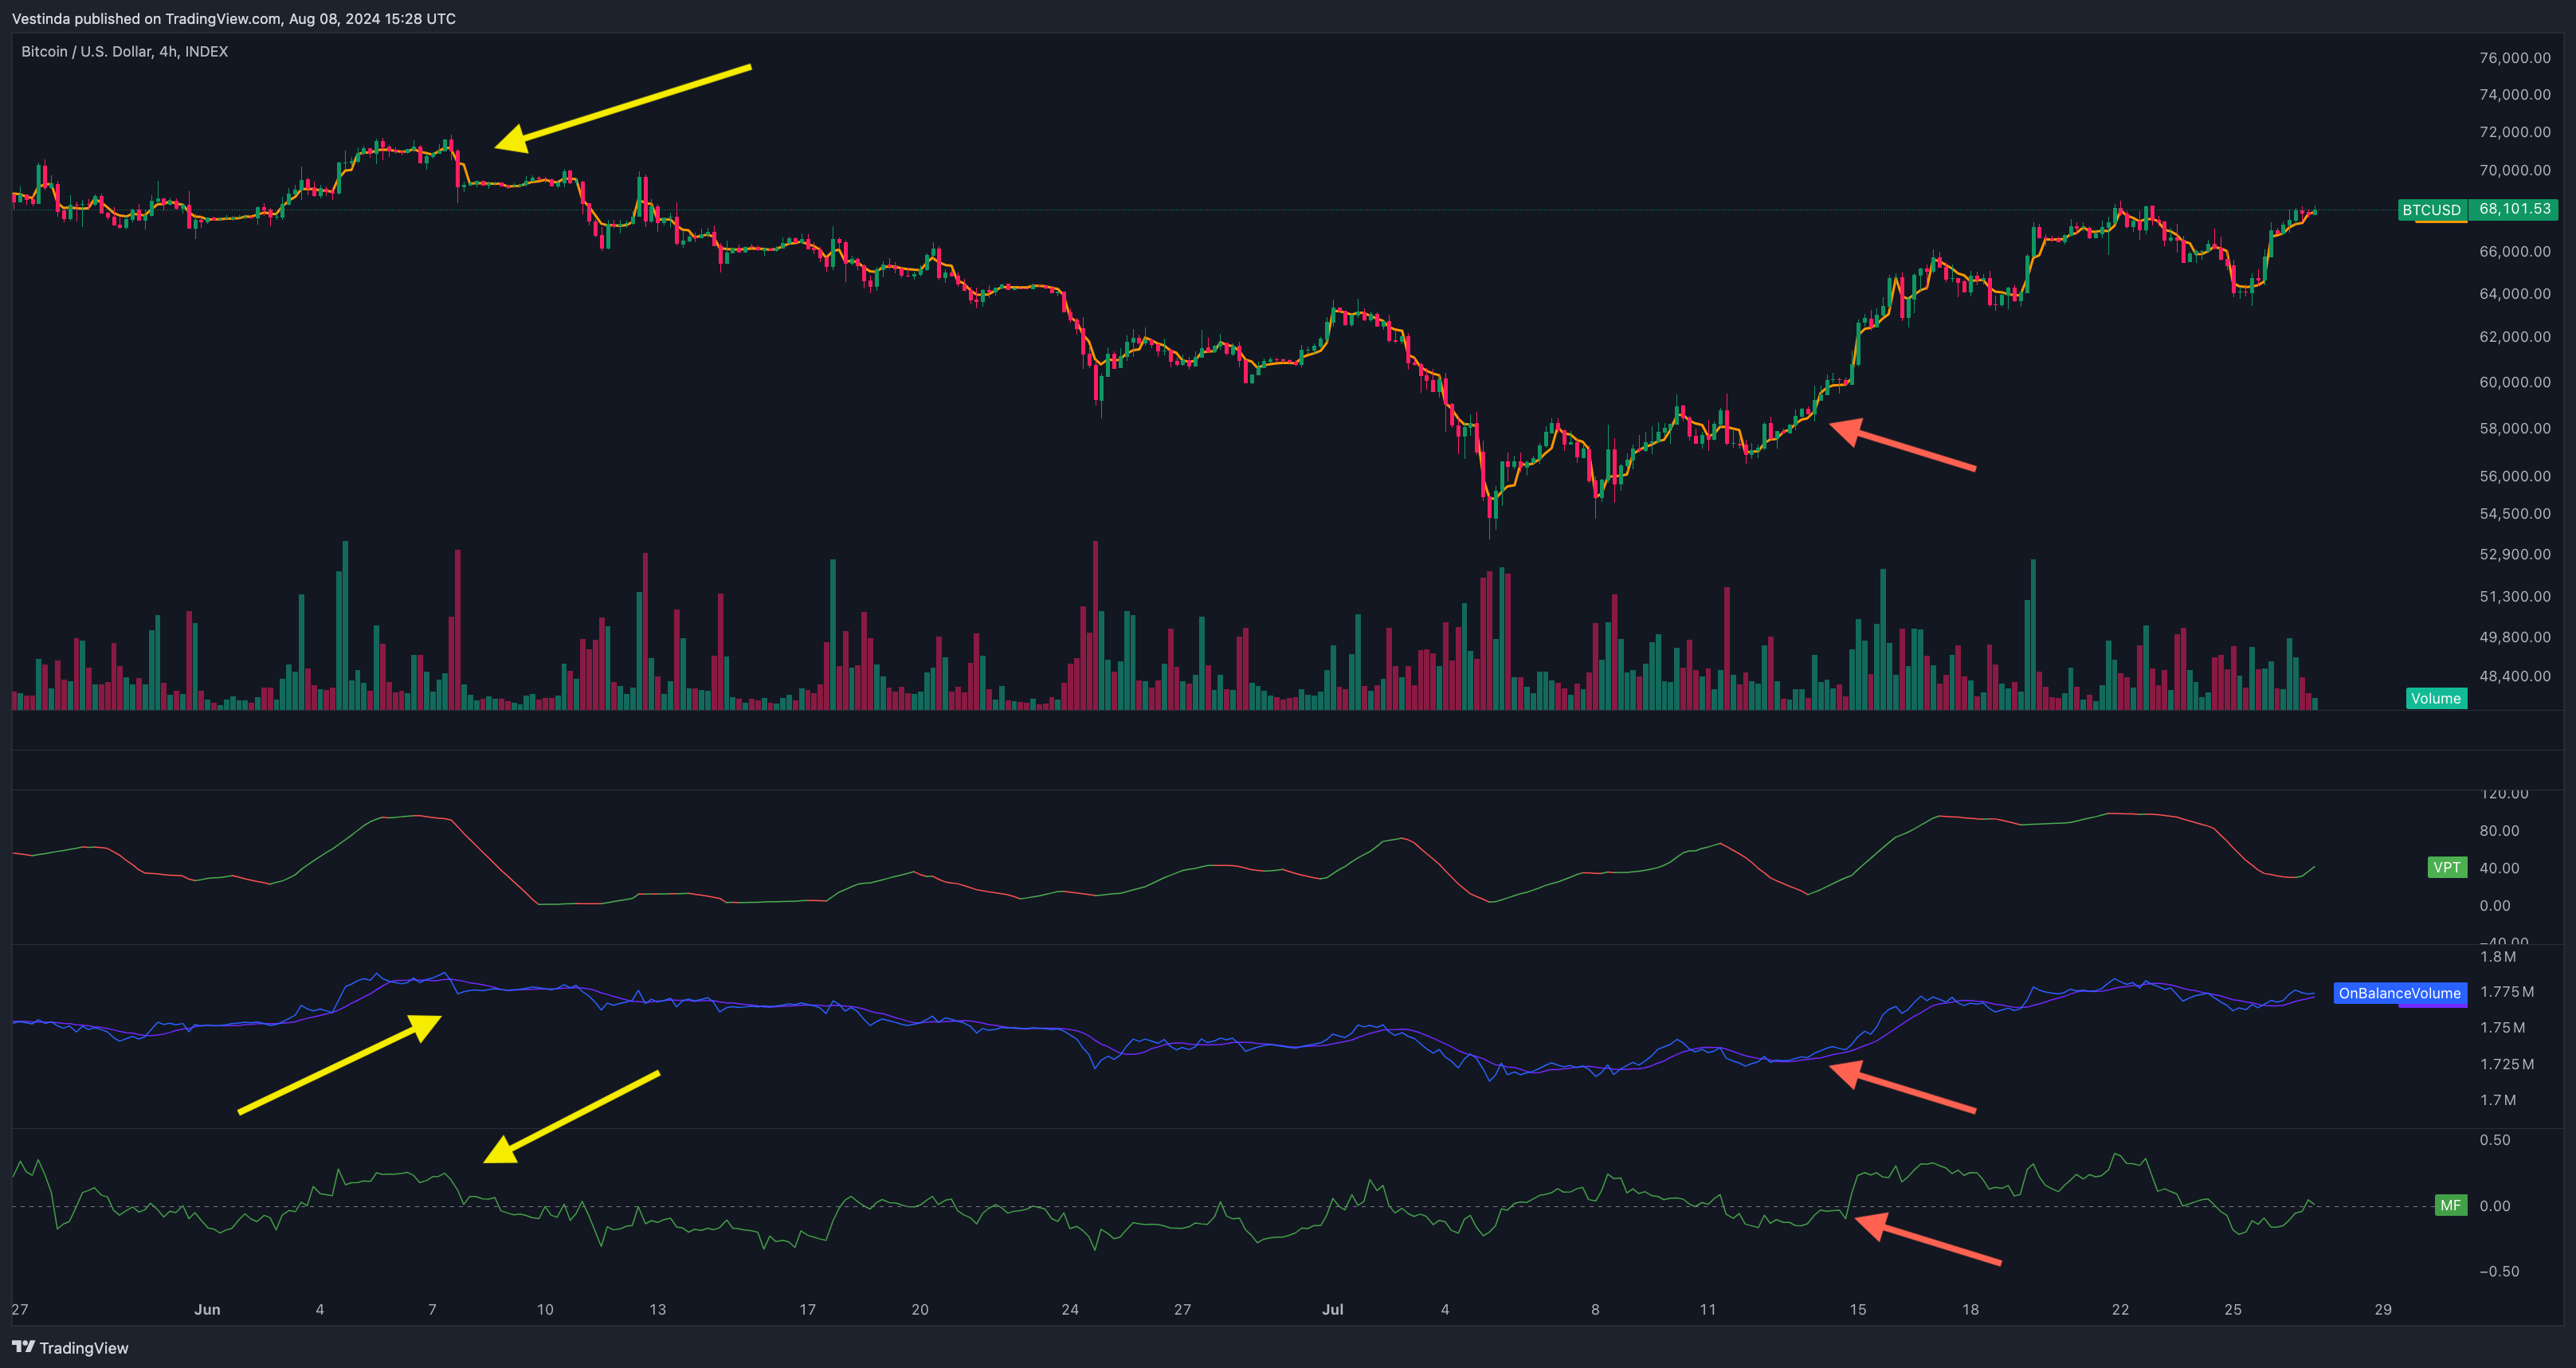
- On-Balance Volume (OBV): Use OBV to identify the flow of volume. Rising OBV indicates accumulation, while falling OBV indicates distribution.
- Accumulation/Distribution Line (A/D Line): Combines volume and price to show the cumulative flow of money. A rising A/D Line suggests accumulation, and a falling A/D Line suggests distribution.
Example Strategy Without Price Patterns
Identify Trend
- Volume Moving Average Cross: Use a short-term volume moving average (e.g., 20-day) and a long-term volume moving average (e.g., 50-day).
- Bullish Trend: Short-term volume moving average crosses above the long-term volume moving average.
- Bearish Trend: Short-term volume moving average crosses below the long-term volume moving average.
Entry Criteria
Bullish Entry
- OBV is rising and crosses above its moving average.
- CMF is positive and increasing.
- VWAP is below the current price.
Bearish Entry
- OBV is falling and crosses below its moving average.
- CMF is negative and decreasing.
- VWAP is above the current price.
Exit Criteria
Bullish Exit
- OBV starts to decline.
- CMF turns negative.
- Volume starts to decrease significantly.
Bearish Exit
- OBV starts to rise.
- CMF turns positive.
- Volume starts to decrease significantly.
Additional Tools
Volume Profile
Analyze the volume traded at different price levels over a specific period. This helps identify high volume nodes (areas of strong interest) and low volume nodes (areas of weak interest).
Relative Volume (RVOL)
Measures current volume relative to a standard average volume. High RVOL indicates stronger-than-usual trading activity, while low RVOL indicates weaker activity.
Time-of-Day Volume Patterns
Identify periods during the trading day with consistently high or low volume. This can help in timing entries and exits based on expected volume surges.
Conclusion
This strategy focuses on using volume as a key indicator to confirm price movements and identify potential reversals. By combining volume analysis with other technical indicators and price action, you can build a robust strategy capable of profiting in both bull and bear trends. Regularly backtesting and refining the strategy with historical data is crucial to ensure its effectiveness in various market conditions.
Enhancing Trades: Maximizing Volume-Based Swing Strategies
Volume is a trading indicator used to analyze the strength and momentum of a price movement. It measures the number of shares or contracts traded in a given period. In swing trading, volume can be a valuable tool for identifying potential price reversals or continuations. A Volume Swing Trading Bot takes advantage of this indicator to make trading decisions automatically. By analyzing the volume data, the bot can identify patterns and trends that may indicate a change in market sentiment. It can then execute trades based on predetermined rules and parameters. This automated approach allows traders to take advantage of opportunities in the market without constantly monitoring the volume data themselves. The Volume Swing Trading Bot can provide a faster and more efficient way to trade based on volume analysis.
Optimum Trading Range Seeker
It measures the number of shares or contracts of a security traded in a given period. Range refers to the price difference between the high and low of a trading session. A volume range trading bot combines these two indicators to make trading decisions. By analyzing the volume and range of a security, the bot identifies potential price reversals or breakouts. It can then execute trades based on predetermined parameters to take advantage of these market movements. This type of trading bot is especially useful for day traders or short-term traders looking to profit from short-lived price fluctuations. It takes away the need for manual analysis and decision-making, allowing traders to capitalize on opportunities in real-time.
Technical Analysis-driven Volume Trading Bot
Volume is a trading indicator that measures the number of shares or contracts traded in a given period. It indicates the strength of market participants' interest in a particular stock or asset. Technical analysis can be used to analyze volume patterns and identify potential trading opportunities.
A trading bot for volume using technical analysis can be programmed to monitor volume levels and detect significant changes. This bot can analyze historical volume data to identify patterns and signals that indicate potential price movements. By using specific volume-based indicators, such as volume moving averages or volume rate of change, the bot can generate buy or sell signals based on volume patterns.
This trading bot can also incorporate other technical indicators and strategies, such as moving averages or trendlines, to confirm volume-based signals. By combining volume analysis with other technical indicators, the trading bot can increase the probability of making profitable trades. Overall, a trading bot for volume using technical analysis can automate the process of monitoring and analyzing volume indicators, making it easier for traders to identify trading opportunities based on volume patterns.
Unveiling Trading Bots: Mechanics and Workflow
Trading bots are automated computer programs that execute trades on behalf of traders. They employ algorithmic strategies to identify and capitalize on trading opportunities in financial markets. Using sets of predefined rules, trading bots analyze market conditions and perform trades based on specific signals or indicators. These bots can be programmed to execute trades even when the trader is not actively monitoring the market. Some bots use technical analysis, looking at indicators such as volume, price movements, and patterns, while others employ fundamental analysis by considering economic news and events. By continuously monitoring the market and executing trades quickly and efficiently, trading bots aim to generate profits for traders, taking advantage of market inefficiencies or price discrepancies.
Sophisticated backtesting is not only possession of high-esteemed hedge funds anymore.
Impressive Team and support, Backtesting engine with detailed reports, The Strategy builder.

Great purchase!
I have always manually invested in stocks and cryptocurrencies, but after studying Vestinda, I must say it has enormous potential.

Mature platform for trading
Pro: Easy to use, Nice UX, A lot of customization for strategies, Back testing is an awesome tool, can check any strategy in history.

Frequently Asked Questions
The speed of a trading bot depends on various factors such as the algorithm it uses, the connection speed, and the market conditions. High-frequency trading bots can execute trades within microseconds, leveraging advanced technology like co-location and low-latency connections. However, the speed also depends on the exchange's infrastructure and the trading strategy implemented by the bot. In some cases, trading bots may take longer to process and execute trades due to network congestion. Ultimately, the responsiveness and speed of a trading bot play a crucial role in capitalizing on market opportunities and minimizing latencies.
Creating forex bots involves several key steps. First, determine your trading strategy and identify indicators to trigger trades. Next, select a programming language like Python or MQL and learn the syntax. Use APIs provided by forex brokers to access live market data. Implement your strategy by coding buy and sell orders based on your indicators. Backtest your bot using historical data to evaluate its performance. Finally, deploy your bot on a virtual private server (VPS) to ensure uninterrupted trading. Continuous monitoring and periodic optimization are crucial for successful forex bot trading.
Yes, trading bots can fail. While they offer automated trading based on predefined algorithms, they are not foolproof. Several factors can contribute to their failure, including sudden market fluctuations, technical glitches, incorrect programming, or inadequate historical data. Additionally, market conditions and trends can change rapidly, rendering the bot's strategy ineffective. Trading bots require constant monitoring and adjustments to adapt to evolving market conditions. Therefore, it is crucial to understand their limitations and have a risk management strategy in place to mitigate potential failures.
Yes, it is possible to lose on a trading bot. Although trading bots are automated systems designed to execute trades based on predefined parameters, they are not foolproof. Market conditions can change rapidly, leading to unexpected price fluctuations that may result in losses. Additionally, poor strategy implementation, technical glitches, or insufficient risk management can also contribute to losses when using a trading bot. Traders should exercise caution, regularly monitor their bots, and ensure they have a well-defined trading plan to mitigate potential risks and losses.
Yes, you can customize a trading bot for your specific strategy with volume. By implementing predefined rules and parameters based on volume indicators, you can optimize the bot to execute trades in alignment with your strategy. These rules could include volume thresholds, moving averages, or other volume-based indicators. With customization, you can ensure the bot responds to volume fluctuations according to your trading strategy.
There are both free and paid trading bots available in the market. Free trading bots often have limited features and might not provide the same level of sophistication as their paid counterparts. Additionally, free trading bots may have certain restrictions or limitations on the number of trades or assets they can handle. However, there are some free trading bots that can be effective for traders with basic requirements. It is important to thoroughly research and compare different options to find the most suitable trading bot that meets your needs and budget.
Conclusion
In conclusion, volume trading bots are revolutionizing the way investors approach the market. By utilizing historical and real-time volume data, these algorithmic bots automate trading decisions and aim to optimize profits. Backtesting results have shown promising returns, making volume trading bots a popular tool among traders of all experience levels. With the ability to analyze large volumes of data quickly and accurately, these bots provide a faster and more efficient way to trade based on volume indicators. They take advantage of market opportunities without the need for constant monitoring, allowing traders to maximize their trading potential.

Successful traders rely on backtesting to be profitable.
Be like them with our
Free Backtesting Guide