Learn the art of analyzing market data. Explore technical analysis through charts, patterns, and indicators used to forecast future price movements and make informed trading decisions.

Are you wondering how top investors consistently outperform the market? The answer often lies in the smart money concept. This powerful trading strategy involves following the actions of large, well-informed institutional investors who have access to more information and resources than the average trader. Understanding the smart money concept can give you a significant edge in the financial markets.

In this article, we’ll explore what the smart money concept is and how it works. We’ll also delve into practical ways you can apply this strategy to your own trading. Sections will cover identifying smart money movements, analyzing market indicators, and leveraging technology to track institutional activity.

You can make more informed trading decisions and potentially boost your investment returns. Whether you’re a novice or an experienced trader, learning to follow the smart money can be a game-changer.

What is the smart money concept in trading?

The smart money concept in trading refers to the practice of tracking and following the investment strategies of large, well-informed institutional investors. These investors, such as hedge funds, mutual funds, and investment banks, have access to superior research, advanced technology, and extensive market knowledge, enabling them to make more informed trading decisions. The smart money concept assumes that these institutional investors’ actions can signal future market trends.

Traders using this concept analyze patterns, volume spikes, and other indicators to identify where smart money is flowing. By aligning their trades with these movements, individual traders aim to benefit from the insights and strategies of more experienced market participants. This approach can provide an edge in predicting market direction and making more profitable trading decisions.

How to trade using the smart money concept

Identify Market Structure

The Smart Money Concept (SMC) emphasizes understanding the thinking of big institutional players in the market. The first step is deciphering the current market structure. Is it trending upwards, downwards, or stuck in a range?

Identifying key support and resistance levels is also important. These areas represent price zones where the market has historically shown difficulty breaking through.

By understanding the overall trend and these key levels, you can start to anticipate where “smart money” might be accumulating positions (in an uptrend near support) or distributing them (in a downtrend near resistance). This knowledge empowers you to identify potential entry and exit points aligned with the moves of these major market players.
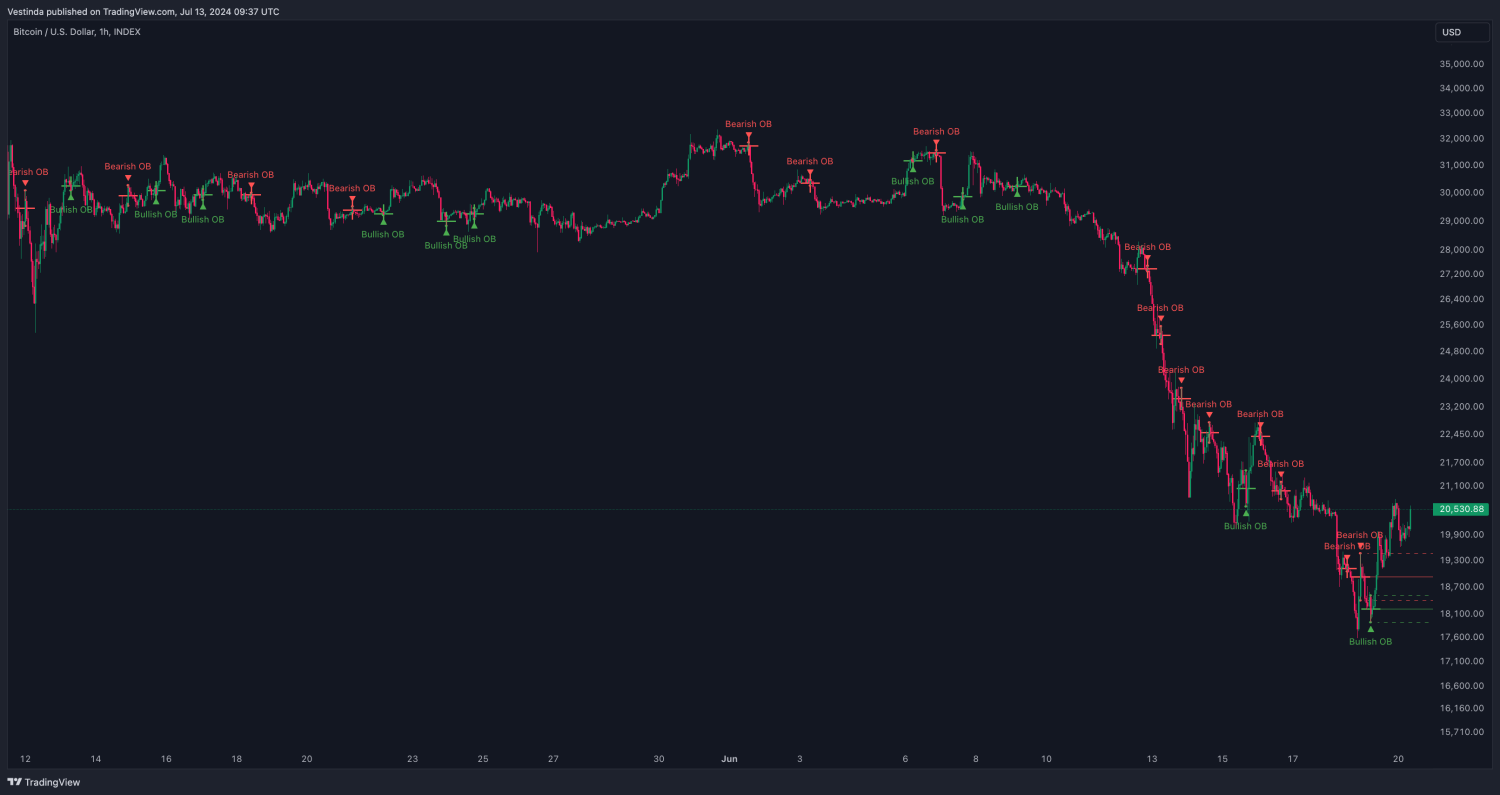
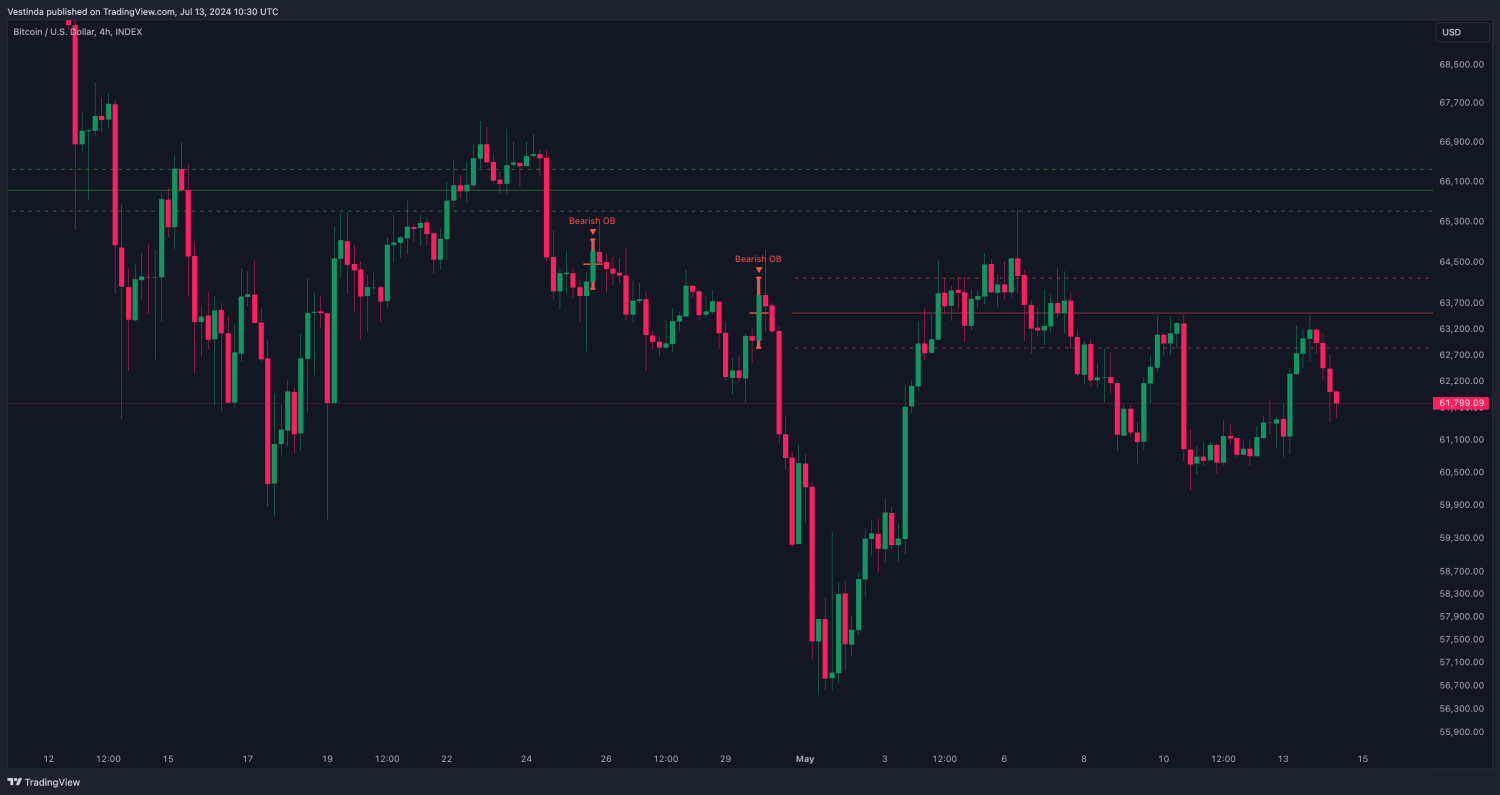
Spot Order Blocks

Imagine a tug-of-war between bulls and bears in the market. Order blocks, a core concept in Smart Money Concepts (SMC), are like footprints left on the battlefield. These appear on charts as zones where the price has consolidated and traded sideways for a period. This sideways movement suggests a temporary truce between the opposing forces. But within this zone lies a hidden story.

Depending on the market structure – uptrend, downtrend, or ranging – these order blocks could signal where “smart money,” big institutional players, might be accumulating (buying in an uptrend near support) or distributing (selling in a downtrend near resistance) positions.

You can potentially predict areas where the price might breakout in the direction favored by “smart money,” allowing you to strategically align your entries and exits with the moves of these major market influencers.

Analyze Liquidity Zones

Liquidity zones are like underwater trenches on the price chart, marking areas where significant buying or selling activity has previously taken place. Let’s assume a giant pool of orders resting beneath the surface. These zones can morph into support or resistance levels, depending on the market context.

Here’s where things get interesting – “smart money” might strategically use these liquidity zones to their advantage. In an uptrend, they might re-enter positions near support within a liquidity zone, pushing the price higher. Conversely, during a downtrend, they might use a liquidity zone near resistance as an exit point, profiting by selling into that pool of orders before the price dips further.

The interplay between liquidity zones and market structure offers clues into where “smart money” might take action. Analyzing these factors can potentially position your own trades to align with the moves of these market influencers.

Watch for Breakouts and Break of Structure (BOS)

Keep your eyes peeled for breakouts and Breaks of Structure (BOS). These occur when the price decisively surges above an order block or key support level (in an uptrend) or plunges below resistance (in a downtrend).

If a breakout aligns with the overall market structure (upward movement during an uptrend), it could be a promising entry point for your trade. Recognizing these breakouts and ensuring they complement the larger trend can potentially ride the wave alongside “smart money” as they capitalize on this shift in market momentum.

Pay close attention to “Changes of Character” (ChoCH) – how the price reacts at critical support or resistance zones. Does it stall and sputter, hinting at hesitation from major players, before reversing course? Or does it pierce through decisively, suggesting a potential power move by “smart money”? By deciphering these ChoCH signals, you can gain valuable insights.

A stalling price at support in an uptrend might indicate “smart money” accumulating before a push higher. Conversely, a decisive break above resistance in a downtrend could signal a distribution by “smart money,” foreshadowing a potential price drop.

By observing these ChoCH moments and interpreting them within the context of the larger market trend, you can potentially anticipate the next move by the market’s heavyweights and strategically align your trades accordingly.

Use Price Action Confirmation

Wondering what strategies top traders use to stay ahead of the market? The ICT strategy might be the answer. This approach, developed by veteran trader Michael Huddleston, delves into understanding the market’s inner workings, specifically focusing on how big institutions move the price.

This article will unveil the secrets of ICT, guiding you through its core concepts, practical application, and valuable tips to navigate the market with newfound confidence. So, buckle up and get ready to trade like the big dogs!

What is ICT strategy?

The ICT strategy is a sophisticated trading approach that focuses on understanding the underlying mechanics of financial markets. Developed by Michael J. Huddleston, ICT strategy emphasizes the study of market structure, liquidity, and price action to identify high-probability trading opportunities.

Traders can anticipate market movements and make informed decisions by analyzing these elements. Key components of ICT strategy include identifying market maker patterns, using institutional order flow, and understanding the significance of liquidity pools.

This strategy is designed to give traders a deeper insight into how and why markets move, enabling them to trade with greater precision and confidence. Whether you’re a novice or an experienced trader, mastering ICT strategy can provide a significant edge in the financial markets.

How to trade the ICT strategy

Now that you know the ICT lingo, let’s unpack how to use it for your trades.

Identify Market Structure

The ICT strategy emphasizes understanding the current market structure: is the price steadily climbing in an uptrend, relentlessly falling in a downtrend, or stuck in a choppy range with no clear direction? By learning ICT’s framework, you’ll be able to identify these different structures and tailor your trading approach accordingly.

Imagine a rising tide – during an uptrend, ICT can help you identify potential entry points to ride the wave higher. Conversely, downtrends might be better suited for short selling strategies to capitalize on falling prices. Choppy ranges, on the other hand, often present fewer clear opportunities, and ICT can help you recognize when it’s best to stay on the sidelines and wait for a more decisive move.

Curious about the secret behind successful crypto traders’ ability to predict market movements? Delving into market depth is your gateway to mastering effective crypto trading strategies. “Market Depth: How to Use Market Depth in Crypto Trading” uncovers this indispensable tool that can significantly enhance your trading prowess.

Market depth involves visualizing real-time buy and sell orders in the market, offering insights into current supply and demand dynamics at different price levels. With this, traders can assess support and resistance strengths, forecast price fluctuations, and make well-informed trading decisions.

This article provides a comprehensive overview of market depth’s fundamentals, its critical role in crypto trading strategies, and practical advice on leveraging this information to your advantage. Whether you’re a novice trader or seasoned investor, understanding market depth empowers you to navigate the complexities of crypto markets with greater confidence and precision.

What is market depth in crypto?

Market depth in crypto refers to the real-time visualization of buy and sell orders at different price levels for a particular cryptocurrency. It illustrates the quantity of assets that traders are willing to buy or sell at various prices, providing insights into the current supply and demand dynamics in the market. Market depth is typically represented in the form of a chart or order book, where traders can see the cumulative volume of orders waiting to be executed.

This information helps traders assess the liquidity of a cryptocurrency, identify support and resistance levels, and anticipate potential price movements. Understanding market depth is essential for making informed trading decisions, as it allows traders to gauge market sentiment and the strength of price levels where significant buying or selling activity is likely to occur.

What does market depth tell you?

Market depth provides valuable insights into the supply and demand dynamics of a market at any given time. By visualizing the cumulative volume of buy and sell orders at different price levels, market depth reveals several critical aspects for traders and investors. Firstly, it indicates the liquidity of a market or asset—higher liquidity suggests a greater number of buyers and sellers, facilitating easier transactions and potentially narrower bid-ask spreads. Conversely, lower liquidity can lead to wider spreads and increased price volatility.

Secondly, market depth helps identify support and resistance levels. Support levels are where there are a significant number of buy orders, suggesting a potential price floor as traders are willing to buy at those levels. Resistance levels, on the other hand, show where sell orders are concentrated, indicating a potential barrier to further price increases as traders look to sell at those levels.

Moreover, analyzing market depth allows traders to gauge market sentiment. For instance, a strong buy-side depth with substantial orders clustered at higher price levels may indicate bullish sentiment and potential upward momentum. Conversely, a heavy sell-side depth concentrated at lower price levels could signal bearish sentiment and potential downward pressure on prices.

Overall, market depth provides a nuanced view of supply and demand dynamics, helping traders make informed decisions based on current market conditions and anticipate potential price movements more effectively.

How to use market depth in crypto trading

1. Understand Market Depth Basics:

In crypto markets, market depth illustrates the volume of buy-and-sell orders at various price levels. It’s displayed in an order book format, with bids (buy orders) on one side and asks (sell orders) on the other. This tool allows traders to see where the market stands in terms of liquidity and potential price movements.

This foundational knowledge helps traders make more informed decisions and navigate the complexities of cryptocurrency trading with greater confidence. Understanding market depth is crucial for anyone looking to delve deeper into the dynamics of cryptocurrency markets and optimize their trading strategies accordingly.

2. Interpret Order Book Layout:

The order book in crypto trading is split into two primary sections: the bid (buy) side and the ask (sell) side. On the bid side, buy orders are listed from the highest to the lowest price levels, reflecting the willingness of traders to purchase at those prices.

Conversely, the ask side displays sell orders from the lowest to the highest prices, showing where traders are looking to sell their holdings. Interpreting this layout is essential because it provides insights into the market’s sentiment and potential future movements.

For instance, a deep bid side with substantial buy orders may indicate strong support levels, suggesting that prices are likely to hold or bounce back from those levels. Conversely, a significant ask side could indicate resistance, where selling pressure may halt or reverse price increases. Understanding these dynamics helps traders identify strategic entry and exit points and navigate market fluctuations more effectively.

3. Identify Support and Resistance Levels:

Using market depth in crypto trading involves identifying critical support and resistance levels. Support levels are where buy orders accumulate, indicating potential price floors. These levels are crucial because they represent points where there is significant demand for the cryptocurrency, potentially preventing prices from falling further. On the other hand, resistance levels are where sell orders aggregate, suggesting barriers to price increases.

Recognizing these levels helps traders anticipate where buying or selling pressure may intensify, influencing their trading decisions. By analyzing market depth charts, traders can visualize these levels more clearly, seeing where the order book is stacked with buy or sell orders.

This insight allows for strategic planning, such as setting stop-loss orders below key support levels or targeting profit-taking near significant resistance levels. Understanding and effectively using support and resistance levels based on market depth analysis can enhance trading strategies and improve risk management in crypto markets.

4. Assess Market Liquidity:

Market depth provides essential insights into liquidity in crypto trading. It allows traders to evaluate the depth of buy-and-sell orders at various price levels, indicating the market’s ability to absorb large transactions without significant price fluctuations.

Higher liquidity typically corresponds to tighter bid-ask spreads, facilitating smoother trade executions and reducing transaction costs. Conversely, lower liquidity may result in wider spreads and increased price volatility, making it more challenging to enter and exit positions at desired prices.

By analyzing market depth charts, traders can gauge the current liquidity conditions and adjust their trading strategies accordingly. Understanding liquidity levels helps traders anticipate potential slippage and make informed decisions on trade sizes and timing. Moreover, monitoring changes in liquidity over time can provide insights into market trends and investor sentiment, aiding in the formulation of more accurate trading strategies in dynamic crypto markets.

5. Monitor Order Flow Changes:

Continuously monitoring changes in the order book is essential for crypto traders to gauge market sentiment and anticipate potential price movements. By observing shifts in order flow, such as sudden increases in buy orders or large sell orders at critical resistance levels, traders can identify significant market trends and potential trading opportunities.

For instance, a sudden surge in buy orders may indicate increasing bullish sentiment and potential upward price momentum. Conversely, a large sell order at a key resistance level could signal potential selling pressure and a possible price reversal.

Monitoring these changes in real-time allows traders to adapt their strategies accordingly, whether it involves adjusting entry or exit points or reassessing market conditions based on evolving order dynamics. This proactive approach helps traders stay ahead of market movements and capitalize on favorable trading opportunities in dynamic crypto markets.

6. Combine with Technical Analysis:

Integrating market depth analysis with technical indicators and chart patterns enhances your trading strategy. By combining these tools, you gain a comprehensive view of market conditions, increasing the accuracy of your trade decisions.

For example, confirming a bullish reversal pattern on the price chart with strong buy-side liquidity in the order book can bolster your confidence in entering a long position. Similarly, a bearish candlestick pattern supported by a significant sell order concentration at a resistance level may strengthen the case for a short trade.

Combining market depth with technical analysis allows you to validate your trading signals, reducing the likelihood of false positives. This holistic approach not only improves your ability to spot entry and exit points but also enhances your overall market understanding, helping you navigate the complexities of crypto trading with greater precision and confidence.

What is 2% depth in crypto?

In crypto trading, the term “2% depth” refers to the cumulative volume of buy and sell orders that exist within 2% of the current market price of a cryptocurrency. Essentially, it represents the total quantity of assets available for immediate purchase or sale, very close to the current market price.

For example, if the current market price of Bitcoin is $50,000, the 2% depth would encompass all buy orders up to $51,000 and sell orders down to $49,000. This depth metric is crucial for traders as it provides insights into the immediate liquidity available in the market.

A higher 2% depth indicates more liquidity, implying that a larger volume of transactions can occur near the current price without significantly impacting it. Conversely, a lower 2% depth suggests lower liquidity, potentially leading to wider bid-ask spreads and greater price volatility. Understanding the 2% depth helps traders gauge market conditions and make informed decisions based on the availability of liquidity near the current market price.

What is the best indicator for market depth?

The best indicator for market depth in trading, including crypto, is the order book itself. The order book provides a real-time display of all outstanding buy and sell orders at different price levels, offering a direct view of market liquidity and potential price movements.

Key metrics within the order book, such as the total volume of buy and sell orders, the spread between bid and ask prices, and the density of orders at various price levels, provide critical insights into market depth.

Traders often analyze the order book to identify support and resistance levels, assess the strength of price trends, and anticipate market reversals. While other indicators like volume profiles and liquidity indicators can complement this analysis, the order book remains the primary tool for understanding market depth and making informed trading decisions based on supply and demand dynamics.

Have you ever wondered if order blocks can unlock the key to trading success? In this article, “Order blocks in trading: Are they profitable?” We’ll explore the potential of this intriguing trading concept. Order blocks are clusters of orders that can influence price movements and reveal market sentiment. Understanding their formation and impact could provide traders with a strategic edge.

We’ll get into the basics of order blocks, examine their effectiveness, and analyze their profitability in various market conditions. By the end, you’ll have a clearer picture of whether incorporating order blocks into your trading strategy is worth the effort. Join us as we uncover the mysteries behind this powerful trading tool and its potential to boost your trading performance.

What are order blocks in trading?

Order blocks in trading are significant clusters of orders that accumulate at specific price levels, reflecting the activity of large institutional traders. These blocks often mark areas where substantial buying or selling interest exists, which can influence price movements and act as key support or resistance levels. By identifying order blocks, traders can gain insights into market sentiment and potential price reversals or continuations.

Order Blocks Examples:

How to Order Blocks in Trading

Order blocks represent areas where large orders from institutional traders are placed, causing significant changes in price direction. These blocks are crucial as they indicate areas of high liquidity and strong market interest, often aligning with support and resistance levels.

These blocks are typically formed when institutions execute large orders in chunks to avoid significant market impact. Understanding and leveraging order blocks can provide traders with strategic entry and exit points, enhancing their ability to predict market movements and make informed trading decisions. This approach requires keen observation and analysis of price action and volume data to identify these critical zones.

How do order blocks work?

Order blocks work by reflecting the accumulation of large buy or sell orders at specific price levels, typically placed by institutional traders. These large players, such as hedge funds and banks, execute their substantial trades in chunks to avoid creating significant market impact, thus forming order blocks. When these blocks are identified, they indicate strong areas of support or resistance. Traders can use this information to anticipate potential price movements.

When price approaches an order block, it may either bounce back, indicating a reversal, or break through, signaling a continuation. This happens because order blocks represent significant liquidity zones where the balance between supply and demand is temporarily disrupted. If there is more buying interest, the price is likely to rise; if there is more selling interest, the price may drop. By analyzing the behavior of price around these blocks, traders can make informed decisions about their trades.

The identification of order blocks requires a thorough understanding of price action and volume analysis. Traders look for areas where the price has previously stalled or reversed, often marked by high trading volumes. These are the potential order blocks. Once identified, these blocks can serve as strategic points for placing trades.

For instance, a trader might place a buy order near a bullish order block, expecting the price to rise from that support level, or a sell order near a bearish order block, anticipating a decline. In summary, order blocks serve as critical tools for traders to gauge market sentiment and predict price movements, providing strategic entry and exit points based on the accumulation of large institutional orders. This approach enhances the trader’s ability to align with the underlying market forces.

Types of order block

Order blocks in trading can be categorized into various types based on their directional bias and significance in the market. Firstly, there are bullish order blocks, which form when there is a substantial accumulation of buy orders at a specific price level. These blocks indicate strong buying interest from institutional traders and often create support zones.

Bullish Order Block Example:

Bullish Order Blocks on Bitcoin Chart

In this chart, the bullish order block is highlighted, showing where significant buy orders have pushed the price up. This area can act as a strong support level in future price movements.

Traders identify bullish order blocks by observing areas on the chart where the price has previously paused or reversed upwards with notable trading volumes. Conversely, bearish order blocks represent a significant accumulation of sell orders at a particular price level. These blocks signal strong selling interest from institutional traders and typically create resistance zones.

Bearish Order Block Example:

Bearish Order Blocks on Bitcoin

This chart highlights a bearish order block, where substantial sell orders have driven the price down. This area can act as a strong resistance level in future price movements.

Traders identify bearish order blocks by looking for areas where the price has previously stalled or reversed downwards with significant volume. In addition to directional bias, order blocks can also be classified based on their significance. Major order blocks occur on longer timeframes, such as daily or weekly charts, and involve larger volumes and institutional activity.

Minor order blocks, on the other hand, form within smaller timeframes and may not have as significant an impact on price movements. Understanding the different types of order blocks allows traders to make more informed decisions in their trading strategies.

By recognizing these patterns, traders can anticipate potential price movements and identify strategic entry and exit points in the market. This knowledge empowers traders to navigate the dynamic nature of the financial markets more effectively, increasing their chances of success.

Example of an order block

Imagine you’re a forex trader analyzing the price chart of a currency pair. As you zoom out to the daily timeframe, you notice a significant downtrend that has been in place for several weeks. However, amidst the downward movement, you spot a distinct area where the price briefly stalled before continuing its descent. This area represents an order block.

Upon closer inspection, you observe that during this consolidation phase, there was a notable increase in trading volume, indicating significant market activity. Traders who recognize this pattern may interpret it as a sign of accumulation by institutional players, suggesting a potential reversal in the prevailing trend.

As the price retraced to this level in the future, you witnessed a sudden surge in buying interest, causing a rapid reversal in price direction. This order block now acts as a crucial support zone, where buyers have previously shown strong interest. Traders who identify this order block may strategically place buy orders near this level, anticipating another bounce upwards when the price revisits the block.

In this scenario, the order block serves as a pivotal point on the price chart, influencing future price action and providing valuable insights for traders. By identifying and understanding such order blocks, traders can make informed decisions and capitalize on potential trading opportunities in the market.

Are order blocks profitable?

The profitability of order blocks depends on various factors, including the trader’s ability to accurately identify and interpret them, as well as market conditions. While order blocks can provide valuable insights into market sentiment and potential price reversals, they are not guaranteed to result in profitable trades. Successful trading requires careful analysis, risk management, and the ability to adapt to changing market dynamics.

Traders who effectively incorporate order blocks into their trading strategies and combine them with other technical and fundamental analysis tools may find them to be profitable. However, like any trading strategy, there are risks involved, and traders should conduct thorough research and practice proper risk management to increase their chances of success.

Are order blocks the same as supply and demand?

Order blocks and supply and demand zones are related concepts in trading but are not exactly the same. Order blocks refer to areas on a price chart where institutional traders have placed significant buy or sell orders, causing the price to stall or reverse. These blocks indicate where large trading volumes have occurred, suggesting future price action might react similarly when revisiting these levels.

Bullish Order Block Acting as a Demand Zone:

In this chart, the bullish order block coincides with a demand zone. Notice how the price respects this area and reverses upwards.

Bearish Order Block Acting as a Supply Zone:

Here, the bearish order block aligns with a supply zone. The price struggles to break through this area and reverses downward.

Supply and demand zones, on the other hand, are broader areas where buying and selling pressures have historically caused price reversals. Supply zones are regions where selling pressure outweighs buying pressure, leading to price declines, while demand zones are areas where buying pressure exceeds selling pressure, causing price increases.

In essence, order blocks can be considered a more specific manifestation of supply and demand principles, highlighting the exact block levels where institutional activities are concentrated.

How do you calculate order blocks?

Calculating order blocks involves identifying key areas on a price chart where significant buying or selling activity has occurred, often leading to price reversals or consolidations. To calculate order blocks, traders typically start by examining historical price data to pinpoint areas of consolidation, where the price has paused before a significant move. These areas are often characterized by high trading volume, indicating strong market interest.

Next, traders look for price patterns that signal the presence of large institutional orders, such as engulfing candles or strong price rejections at specific levels. These patterns can help identify the boundaries of the order block. Once the order block is identified, its high and low price levels are marked on the chart.

Traders then monitor these levels for future price action, expecting that the price may react similarly when revisiting the order block. This approach combines technical analysis with volume analysis to accurately identify potential order blocks.

What time frame is best for order blocks?

The best time frame for identifying order blocks depends on the trader’s strategy and trading style. For long-term traders, higher time frames like daily or weekly charts are preferred, as they provide a broader view of market trends and significant levels of institutional activity. These time frames help in identifying major order blocks that can influence price movements over extended periods.

For short-term traders or day traders, lower time frames such as 1-hour or 4-hour charts are more suitable. These shorter intervals allow traders to pinpoint intraday order blocks and capitalize on shorter-term price fluctuations. Ultimately, the choice of time frame should align with the trader’s overall strategy and risk management approach, ensuring consistency in identifying and trading order blocks.

Looking to venture into the world of options trading? If so, learning how to sell options can be a lucrative strategy for beginners in 2024. While it may seem daunting at first, selling options offers unique advantages and opportunities for profit. I

n this comprehensive guide, we’ll walk you through the basics of selling options, covering everything from understanding option contracts to implementing effective trading strategies. You’ll learn how to select suitable underlying assets, choose the right strike prices and expiry dates, and manage risk effectively. By the end of this article, you’ll have the knowledge and confidence to start selling options and potentially generate consistent returns in the dynamic financial markets of 2024.

Steps on how to sell options for beginners

Discover essential strategies and tips to help you sell options with our comprehensive guide. Let’s dive in!

Understand Options Basics

Options are financial instruments offering the right, but not the obligation, to buy or sell an asset at a predetermined price before or at expiry. Calls confer the right to buy, while puts grant the right to sell. Understanding time decay is vital; options lose value as expiration approaches due to diminishing time for the underlying asset to move favorably.

This understanding aids in selecting appropriate strategies and strike prices. By comprehending these basics, beginners can navigate the options market more effectively and make informed decisions about when and how to sell options. Thus, a solid grasp of options basics serves as a foundational step for aspiring options sellers, facilitating their journey towards profitable trading.

Choose a Low-Risk Strategy

Opting for a low-risk strategy like covered calls is advisable for novice options sellers. Covered calls provide a controlled approach to trading by allowing you to collect premiums while mitigating potential downside risks. With this strategy, you sell call options on underlying assets that you already own. By doing so, you receive a premium from the buyer but commit to selling your shares at a predetermined price (the strike price) if the option is exercised before expiry.

This approach offers a level of protection since you already own the underlying asset, reducing the risk associated with the trade. As a beginner, starting with covered calls allows you to gain experience in options trading while limiting potential losses, making it a prudent choice to initiate your trading journey.

Select Underlying Assets Wisely

To navigate the world of options trading successfully, it’s crucial to make informed decisions about the underlying assets. Selecting the right stocks is paramount; opt for those you understand thoroughly and have a strong grasp of their market dynamics. Additionally, prioritize assets with good liquidity, ensuring seamless buying and selling transactions.

Conduct thorough research into the historical price movements of these stocks to gauge their behavior in different market conditions. Furthermore, delve into their future prospects, analyzing factors such as industry trends, company performance, and upcoming events that could impact their value. By carefully selecting underlying assets based on these considerations, beginner options sellers can mitigate risks and increase their chances of success in the market.

Plan Your Strike Price and Expiry

When planning your strike price and expiry for covered calls, it’s essential to strike a balance between risk and reward. Opting for a strike price slightly above the current market price can provide a buffer against potential losses while still allowing you to collect a premium. Starting with short expiry periods, typically a few weeks, can help minimize the impact of time decay, a critical consideration in options trading.

As a beginner, these strategies can offer a more controlled approach, allowing you to gain experience while managing risk. Over time, as you become more comfortable with options trading, you can explore different strike prices and expiry periods to tailor your approach to market conditions and your trading objectives. Remember, risk management is key, so always start small and gradually increase complexity as you gain confidence in your abilities.

Focus on Premium, Not Price Movement

As you sell options, your main source of profit is the premium you receive upfront. This premium is essentially payment from the buyer for the right to buy or sell the underlying asset at a predetermined price within a specified period. Unlike buying options with hopes of capitalizing on price swings, selling options allows you to profit from time decay and volatility.

Regardless of whether the underlying asset’s price moves significantly, you can still earn a profit as long as the option expires worthless or loses value over time. This approach emphasizes the importance of understanding options pricing and market dynamics to effectively capitalize on premium collection strategies. By prioritizing premium over price movement, you can build a more consistent and sustainable trading strategy.

Monitor Deltas Closely

Deltas indicate the rate of change in an option’s price concerning changes in the underlying asset’s price. By understanding deltas, traders can gauge the sensitivity of their options positions to price movements in the underlying asset. This information is valuable for adjusting positions to maintain desired risk levels and potentially capitalize on market opportunities.

If deltas indicate increasing risk or unexpected market movements, traders may choose to buy back the option early to limit potential losses or take profits. Overall, keeping a close eye on deltas empowers options sellers to adapt their strategies effectively in response to changing market conditions, ultimately enhancing their chances of success in options trading.

Start Small and Gradually Increase Complexity

Begin by executing a small number of contracts to acclimate yourself to the dynamics of the market. This approach allows for hands-on learning without exposing yourself to excessive risk. As you gain confidence and proficiency, consider expanding your repertoire by exploring additional beginner-friendly strategies such as cash-secured puts.

These strategies offer a more controlled risk profile and can serve as stepping stones to more advanced techniques. However, it’s crucial to emphasize learning and risk management above all else. Take the time to understand the intricacies of each strategy and how they align with your trading objectives and risk tolerance. By gradually increasing complexity while prioritizing education and risk management, you can enhance your chances of success as an options trader over time.

Is it profitable to sell options?

Selling options can be profitable, but it comes with risks. When you sell an option, you receive a premium upfront. If the option expires worthless, you keep the premium as profit. However, if the option is exercised, you may be obligated to buy or sell the underlying asset at a predetermined price (strike price), which can lead to losses.

The profitability of selling options depends on various factors, including market conditions, the strategy employed, and risk management practices. Successful option sellers often focus on conservative strategies, such as covered calls, and employ effective risk management techniques to mitigate potential losses. Overall, while selling options can yield profits, it requires careful consideration and an understanding of the associated risks.

How much money do you need to sell options?

The amount of money needed to sell options depends on the brokerage’s requirements and the specific option strategy employed. Generally, brokerage firms impose minimum capital requirements to engage in options trading to ensure traders can fulfill their financial obligations if the trade moves against them. For selling covered calls, the minimum requirement may involve owning the underlying stock, which determines the capital needed.

However, for more complex strategies like naked options, higher capital is typically required due to the increased risk. It’s essential for traders to assess their risk tolerance, understand the capital requirements of their chosen strategy, and ensure they have sufficient funds to cover potential losses before engaging in options selling.

Looking to dive deeper into analyzing market volume for your trading decisions? Understanding volume can provide valuable insights into market dynamics and help you make more informed trading choices. In this article, we’ll explore the best indicators for volume analysis in 2024. These indicators can help you gauge the strength of price movements, identify potential trend reversals, and confirm the validity of price trends.

We’ll cover a range of indicators, from simple volume bars to more advanced volume-based oscillators. Whether you’re a novice trader or an experienced investor, incorporating these volume analysis tools into your trading strategy can enhance your ability to interpret market movements and improve your overall trading performance. Join us as we uncover the power of volume analysis in today’s dynamic markets.

What is volume analysis?

Volume analysis is a technique used in finance to understand trends in the market by examining how many shares of a security are traded (volume) over time. By looking at volume alongside price movements, analysts can gauge the strength of a trend. High volume with rising prices suggests strong buying pressure and a likely continuation of the uptrend. Conversely, high volume with falling prices suggests strong selling pressure and a possible trend reversal. Volume analysis isn’t perfect, but it can be a helpful tool for making informed trading decisions.

Best indicators for volume analysis

Let’s explore the top indicators for volume analysis in 2024, offering insights into market dynamics and enhancing trading strategies.

Volume bars

Volume bars are a fundamental tool in technical analysis that illustrate the number of trades executed during a given timeframe, typically displayed as vertical bars on a price chart. Each bar represents the volume of transactions that occurred within that period, offering insights into market activity and liquidity.

By observing volume bars, traders can gauge the level of participation in the market, identify potential buying or selling pressure, and confirm the strength of price movements. For example, an increase in volume during an uptrend may indicate strong buying interest and validate the bullish momentum, while a decrease in volume during a price reversal could signal weakening conviction among market participants.

Overall, volume bars provide valuable context for interpreting price movements and help traders make more informed decisions by corroborating trends and potential market reversals with supporting volume data.

On-Balance Volume (OBV)

Are you tired of feeling lost in the stormy seas of market volatility? Finding your bearings amidst unpredictable price swings can be daunting, but fear not—we’ve got you covered. In this guide, we’ll delve into the world of market volatility and unveil the best tools to help you navigate these turbulent waters. 

Get ready to discover the top market volatility indicators that will empower you to make informed decisions and weather the storm with confidence. From tried-and-tested metrics to cutting-edge strategies, we’ll explore everything you need to know to stay ahead of the curve in today’s dynamic markets. So buckle up and prepare to unlock the secrets of mastering market volatility like a seasoned trader. Let’s dive in!

What is market volatility?

Market volatility refers to the degree of variation or fluctuation in the price of a financial instrument or asset over a certain period. It reflects the speed and magnitude of price changes, indicating the level of uncertainty or risk present in the market. High volatility implies that prices can change rapidly and unpredictably, while low volatility suggests more stable and predictable price movements. 

Various factors contribute to market volatility, including economic data releases, geopolitical events, market sentiment, and investor behavior. Understanding and measuring market volatility is crucial for traders and investors to assess risk, make informed decisions, and develop effective strategies for managing their portfolios. By analyzing volatility trends and utilizing appropriate tools and indicators, market participants can navigate the dynamic landscape of financial markets more confidently.

Top 7 market volatility indicators

Unlock the secrets to navigating market volatility with precision using the best volatility indicators. Let’s explore these essential tools together.

1. Average True Range (ATR)

Average True Range (ATR) is a widely-used indicator that measures market volatility by calculating the average range of price movements over a specified period. It provides traders with valuable insights into the magnitude of price fluctuations, allowing them to gauge the potential for future volatility. A higher ATR value indicates greater volatility, while a lower value suggests calmer market conditions.

Traders often use ATR to set stop-loss levels, determine position size, and identify potential breakout opportunities. By incorporating ATR into their trading strategy, traders can effectively manage risk and adapt to changing market conditions with greater precision. For example, a trader may use ATR to adjust their stop-loss levels based on current market volatility, allowing them to give their trades more room to breathe while still protecting their capital from excessive losses.

Additionally, ATR can help traders identify potential breakout opportunities by highlighting periods of increased volatility. When ATR values spike, it often indicates that a significant price movement is underway, presenting traders with opportunities to enter new positions or capitalize on existing trends. Overall, ATR is a versatile tool that can provide traders with valuable insights into market volatility and help them make more informed trading decisions.

2. Bollinger Bands

Bollinger Bands are another popular indicator for assessing market volatility and identifying potential trend reversals. They consist of a simple moving average (SMA) line surrounded by upper and lower bands that represent standard deviations from the SMA. When the bands widen, it indicates increased volatility, while narrowing bands suggest decreased volatility.

Traders often use Bollinger Bands to identify overbought or oversold conditions and anticipate potential price breakouts or reversals. By monitoring Bollinger Bands, traders can gain valuable insights into market volatility and make more informed trading decisions. For example, when prices touch or exceed the upper band, it may indicate that the market is overbought and due for a correction. Conversely, when prices touch or fall below the lower band, it may signal that the market is oversold and poised for a potential reversal.

Additionally, Bollinger Bands can be used in conjunction with other technical indicators to confirm trading signals and filter out false signals. Overall, Bollinger Bands are a versatile tool that can help traders navigate volatile market conditions and identify profitable trading opportunities.

3. Volatility Index (VIX)

The Volatility Index (VIX), also known as the “fear index,” is a measure of expected market volatility derived from options prices on the S&P 500 index. It reflects investor sentiment and provides insight into market expectations for future volatility. A higher VIX value suggests increased fear and uncertainty in the market, while a lower value indicates calmer conditions.

Traders often use the VIX as a contrarian indicator, with high VIX levels signaling potential buying opportunities and low levels suggesting potential selling opportunities. By monitoring the VIX, traders can gauge market sentiment and adjust their trading strategies accordingly to capitalize on changing volatility dynamics.

Moreover, the VIX can serve as a valuable tool for hedging against volatility risk in the market. Traders and investors can use VIX futures or options to hedge their portfolios against potential downturns or sudden market movements. Additionally, institutions and fund managers may utilize the VIX to manage risk and allocate capital more effectively across different asset classes. Overall, the VIX provides traders and investors with valuable insights into market sentiment and volatility expectations, helping them make more informed decisions in uncertain market conditions.

4. Chaikin Volatility Indicator

The Chaikin Volatility Indicator is a technical analysis tool that measures market volatility by comparing the difference between a security’s high and low prices over a specified period. It provides traders with insights into the intensity of price movements, allowing them to identify periods of high and low volatility. When the indicator rises, it indicates increased volatility, while a decline suggests decreased volatility.

Traders often use the Chaikin Volatility Indicator to confirm trends, identify potential reversals, and set appropriate stop-loss levels. By incorporating this indicator into their analysis, traders can better understand market dynamics and make more informed trading decisions. For example, when the Chaikin Volatility Indicator spikes, it may signal that the market is experiencing heightened volatility and increased risk. Traders can use this information to adjust their trading strategy accordingly, such as tightening their stop-loss levels or reducing their position size, to manage risk effectively.

Overall, the Chaikin Volatility Indicator is a valuable tool for traders seeking to navigate volatile market conditions and identify profitable trading opportunities.

5. Relative Volatility Index (RVI)

The Relative Volatility Index (RVI) is a momentum oscillator that measures the volatility of a financial instrument relative to its recent price movements. It compares the magnitude of price changes over a specified period, allowing traders to assess the intensity of volatility. A higher RVI value indicates greater volatility, while a lower value suggests calmer market conditions.

Traders often use the RVI to identify potential trend reversals, confirm price trends, and anticipate breakout opportunities. By incorporating the RVI into their analysis, traders can gain valuable insights into market volatility and make more informed trading decisions. For example, when the RVI value spikes, it may indicate that the market is experiencing increased volatility, signaling potential trading opportunities. Traders can use this information to adjust their trading strategy accordingly, such as tightening stop-loss levels or increasing position size to capitalize on price movements.

Additionally, the RVI can be used in conjunction with other technical indicators to confirm trading signals and enhance trading strategies. Overall, the Relative Volatility Index is a valuable tool for traders seeking to navigate volatile market conditions and identify profitable trading opportunities.

6. Standard Deviation

Standard Deviation is a statistical measure of market volatility that calculates the dispersion of a set of data points from its mean. In trading, it is commonly used to assess the variability of price movements over a specified period. A higher standard deviation indicates greater volatility, while a lower value suggests more stable market conditions.

Traders often use the standard deviation to quantify risk, set stop-loss levels, and identify potential price extremes. By incorporating standard deviation into their analysis, traders can gain a better understanding of market volatility and adjust their trading strategies accordingly to mitigate risk and capitalize on opportunities.

For example, traders may use the standard deviation to determine the appropriate width of Bollinger Bands or to identify potential price targets based on historical volatility levels. Additionally, the standard deviation can be used in conjunction with other technical indicators to confirm trading signals and filter out false signals. Overall, standard deviation is a versatile tool that can provide traders with valuable insights into market volatility and help them make more informed trading decisions.

7. Momentum Indicator

The Momentum Indicator is a technical analysis tool that measures the rate of change in a financial instrument’s price over a specified period. While not explicitly a volatility indicator, it can provide valuable insights into market momentum, which often correlates with volatility. Traders use the Momentum Indicator to identify overbought or oversold conditions, confirm trends, and anticipate potential trend reversals.

In volatile markets, momentum can be a key driver of price movements, making this indicator particularly useful for assessing volatility dynamics. By incorporating the momentum indicator into their analysis, traders can better understand market sentiment and make more informed trading decisions in volatile market conditions.

For example, when the Momentum Indicator shows divergences from price action, it may signal potential trend reversals or shifts in market sentiment. Traders can use this information to adjust their trading strategy accordingly, such as entering or exiting positions based on momentum signals. Overall, the Momentum Indicator provides traders with valuable insights into market dynamics and helps them navigate volatile market conditions more effectively.

Which is the best volatility indicator?

In volatile market conditions, a dynamic trading strategy embracing volatility often yields the best results. One such strategy is the volatility breakout strategy, where traders capitalize on significant price movements following periods of low volatility. By identifying key support and resistance levels, traders place buy or sell orders above or below these levels, anticipating breakout movements.

Additionally, trend-following strategies can be effective in volatile markets, where traders ride the momentum of established trends and adapt their positions as market conditions change. The key lies in flexibility and agility, allowing traders to adjust their strategies in response to changing market dynamics. Ultimately, the best strategy for volatility depends on a trader’s risk tolerance, market analysis skills, and ability to adapt to the unpredictable nature of volatile markets.

Which strategy is best in volatility?

In times of heightened market volatility, employing a strategy that capitalizes on the market’s unpredictability can be advantageous. One such strategy is the volatility breakout strategy, which involves identifying periods of low volatility followed by significant price movements. Traders aim to enter positions as prices break out of established ranges, leveraging the momentum created by these movements. Additionally, trend-following strategies can be effective in volatile markets as traders ride the momentum of established trends while remaining vigilant for potential reversals.

However, it’s crucial to note that the best strategy for managing volatility may vary depending on individual risk tolerance, market analysis skills, and the ability to adapt to rapidly changing market conditions. Therefore, traders should carefully consider their trading objectives and risk management techniques when selecting a strategy in volatile markets.

In today’s volatile market, it’s important to have a reliable set of indicators to foresee potential downturns. The best indicators for a market pullback act as your guiding stars, offering insights amidst uncertainty.

In this article, we’ll dive into the essentials: understanding key indicators, interpreting market signals, and devising a plan to safeguard your investments. We’ll explore tried-and-tested metrics like moving averages, RSI, and MACD, shedding light on their significance and practical application.

But wait, there’s more. We won’t stop at just identifying indicators; we’ll delve into actionable steps to weather market storms and even seize opportunities amidst the chaos. So buckle up as we embark on this journey to decode the mysteries of market pullbacks.

What is a market pullback?

A market pullback refers to a temporary decline in stock prices within a broader uptrend, often triggered by investors selling off their positions to secure profits or in response to negative news. Unlike a full-blown market correction or crash, pullbacks are typically short-lived and represent a healthy correction in an otherwise bullish market. They serve as opportunities for investors to buy stocks at a discounted price before the upward trend resumes. Understanding market pullbacks is crucial for investors to distinguish between normal market fluctuations and more significant downturns. 

By identifying the signs and utilizing appropriate indicators, investors can navigate pullbacks effectively, optimizing their portfolios for long-term growth while minimizing potential losses. Staying informed about market conditions and having a solid strategy in place can help investors capitalize on pullbacks while avoiding panic-driven decisions.

Top 7 indicators for a market pullback

Let’s discover the essential tools to anticipate market downturns. Explore the top 7 indicators for a market pullback in this insightful guide.

1. Moving Averages:

Moving averages, such as the 50-day or 200-day, provide a smoothed-out view of price trends over a specific period. When the shorter-term moving average crosses below the longer-term one, it signals potential weakness in the market. This crossover acts as a warning sign for a looming pullback, prompting investors to reassess their positions and risk exposure.

Understanding the significance of moving averages requires a nuanced approach. For instance, investors often look for confirmation from other technical indicators or fundamental factors before making trading decisions based solely on moving average crossovers. Moreover, the choice of moving average lengths can vary depending on the trader’s time horizon and market conditions.

Shorter-term moving averages react more quickly to price changes but may generate more false signals, while longer-term moving averages provide a broader perspective but may lag behind price movements. By incorporating moving averages into a comprehensive trading strategy, investors can effectively anticipate market pullbacks and make informed decisions to manage their portfolios.

2. Relative Strength Index (RSI):

The Relative Strength Index (RSI) is a momentum oscillator that measures the speed and change of price movements. It oscillates between 0 and 100, with readings above 70 indicating overbought conditions and readings below 30 suggesting oversold conditions. During a market pullback, RSI readings often dip into oversold territory as selling pressure intensifies. This oversold condition may precede a potential reversal, offering traders an opportunity to enter the market at a favorable price.

Conversely, RSI readings above 70 may signal an impending pullback as buying momentum weakens, prompting investors to exercise caution. Understanding RSI dynamics is crucial for investors to gauge market sentiment and anticipate potential trend reversals. Traders often use RSI in conjunction with other technical indicators to confirm signals and identify entry or exit points.

Observing divergences between RSI and price movements can provide valuable insights into underlying market dynamics. By incorporating RSI analysis into their trading strategies, investors can enhance their decision-making process and effectively navigate market pullbacks.


3. Moving Average Convergence Divergence (MACD):

The Moving Average Convergence Divergence (MACD) is a versatile indicator renowned for its ability to capture changes in trend momentum. Comprising two lines—the MACD line and the signal line—it’s a staple tool in traders’ arsenals. A key signal for market pullbacks occurs when the MACD line crosses below the signal line, indicating a potential shift from bullish to bearish momentum. This crossover serves as a red flag for investors, prompting caution and potentially signaling an impending market pullback.

Moreover, traders keen on spotting trend reversals often scrutinize MACD divergences. The divergence between the MACD line and the price trend suggests a weakening trend and hints at a possible market reversal. Additionally, analyzing the MACD histogram, which displays the difference between the MACD line and the signal line, provides insight into the strength of the prevailing trend, aiding investors in anticipating market pullbacks.

Incorporating MACD analysis into trading strategies enriches decision-making by providing a nuanced comprehension of market momentum dynamics. This empowers traders to confidently manage potential pullbacks, leveraging insights gleaned from MACD signals and divergences.

4. Volume:

Volume is a crucial indicator that measures the number of shares traded during a specific period. An increase in trading volume during a market pullback suggests heightened selling pressure, indicating a potential shift in sentiment among market participants. This surge in volume often accompanies significant price movements, reinforcing the validity of the pullback. 

Conversely, a decrease in volume may signal a lack of conviction in the prevailing trend, potentially foreshadowing a market reversal. Analyzing volume alongside price movements provides valuable insights into market dynamics, helping investors anticipate and respond to pullbacks effectively.

Moreover, observing volume spikes or divergences relative to price trends can offer early warnings of impending pullbacks, allowing investors to adjust their strategies accordingly. By paying close attention to volume patterns, traders can discern the strength of market movements and make informed decisions about entering or exiting positions. Volume analysis serves as a vital tool in assessing market sentiment and identifying potential opportunities or risks during pullback scenarios.

5. Price Patterns:

Price patterns, such as head and shoulders, double tops, and triangles, provide valuable insights into market sentiment and potential trend reversals. These patterns emerge as a result of the collective actions of market participants, reflecting shifts in supply and demand dynamics. During a market pullback, specific price patterns may signal exhaustion among buyers or sellers, indicating a potential reversal in the prevailing trend. 

Traders often use chart patterns in conjunction with other technical indicators to confirm their trading decisions and manage risk effectively. By identifying and interpreting price patterns accurately, investors can anticipate market pullbacks and capitalize on emerging opportunities in the market.

Understanding the intricacies of these patterns requires a blend of technical analysis and market intuition. Traders diligently monitor price movements, looking for recognizable patterns that may signal shifts in market sentiment and potential trend reversals. By mastering the art of pattern recognition, investors can enhance their trading strategies and navigate market pullbacks with confidence. Recognizing these patterns early guides traders to advantageous positions during pullbacks.

6. Fibonacci Retracement Levels:

Fibonacci retracement levels are essential tools for traders navigating market pullbacks. These horizontal lines indicate potential support or resistance levels based on key Fibonacci ratios such as 23.6%, 38.2%, 50%, 61.8%, and 100%. Traders frequently employ these levels during market pullbacks to pinpoint areas where the price may reverse and resume its prior trend. 

By analyzing the extent of retracement relative to the preceding move, investors can assess the pullback’s strength and anticipate possible reversal points. Moreover, Fibonacci retracement levels act as dynamic support or resistance zones, providing guidance for traders’ decision-making processes and assisting in risk management.

Incorporating Fibonacci analysis into trading strategies enhances traders’ abilities to navigate market pullbacks effectively and capitalize on emerging opportunities. This systematic approach offers a structured method for identifying critical levels and making informed trading decisions amidst market volatility. By leveraging Fibonacci retracement levels alongside other technical indicators, investors can gain deeper insights into market dynamics and improve their overall trading performance during pullback scenarios.

7. Volatility Index (VIX):

The Volatility Index (VIX), often dubbed the fear index, measures the market’s anticipation of future volatility through options pricing. During market pullbacks, the VIX tends to surge as investors fret over potential downside risks. This spike in the VIX mirrors elevated fear and uncertainty, signaling a heightened likelihood of a market pullback.

Traders commonly view the VIX as a contrarian indicator; exceedingly high readings indicate excessive fear, potentially signaling buying opportunities. By monitoring shifts in the VIX alongside other technical indicators, investors glean valuable insights into market sentiment, facilitating anticipation of potential pullbacks.

This awareness empowers them to adapt their strategies accordingly, optimizing their positions and seizing emerging opportunities. Thus, leveraging the VIX as a gauge of market sentiment enables investors to navigate turbulent periods with greater confidence and strategic precision. Incorporating VIX analysis into trading strategies offers a comprehensive approach to risk management, providing traders with a clearer understanding of market dynamics and potential pullback scenarios.

Which indicator has the highest accuracy?

Among indicators, it’s challenging to definitively identify one with the highest accuracy, as their effectiveness can vary depending on market conditions and individual trading strategies. However, some traders find Moving Average Convergence Divergence (MACD) to be particularly reliable due to its ability to capture changes in trend momentum. MACD’s incorporation of moving averages and signal line crossovers provides valuable insights into market dynamics, making it a popular choice among traders for identifying potential trend reversals and anticipating market pullbacks.

Despite its popularity, it’s essential for traders to conduct thorough analysis and consider multiple indicators to make well-informed trading decisions, as no single indicator guarantees accuracy in all scenarios. Ultimately, traders should use MACD alongside other indicators to enhance their trading strategies and navigate market fluctuations effectively, ensuring a balanced and informed approach to decision-making.

Ever wondered how top traders consistently pinpoint lucrative trading opportunities? It’s all about understanding the intricacies of order blocks in trading. These seemingly unassuming price levels hold the key to uncovering significant market movements and maximizing trading profits. In this detailed exploration of order blocks in trading, we’ll unveil the secrets behind their formation and utilization.

First, we’ll delve into the fundamentals, elucidating what order blocks are and why they matter in the world of trading. Then, we’ll dive deeper into practical strategies for identifying and interpreting order blocks on price charts. From dissecting their anatomy to harnessing them as powerful support and resistance zones, we’ll equip you with the knowledge and techniques needed to leverage order blocks effectively in your trading endeavors.

Stay tuned as we unravel the mysteries of order blocks, providing actionable insights and strategies to elevate your trading game and navigate the markets with confidence.

What are order blocks?

Order blocks are significant price levels on a trading chart that indicate areas of substantial buying or selling activity. These blocks represent clusters of orders placed by institutional traders or large market participants, leaving a footprint on the price action. Order blocks typically form at key support and resistance levels or after significant market movements, such as breakouts or pullbacks.

They are characterized by price consolidations or sharp price movements followed by a swift reversal. Identifying and interpreting order blocks is crucial for traders, as they can provide insights into market sentiment and potential future price movements. By understanding order blocks, traders can strategically enter or exit positions, manage risk, and capitalize on trading opportunities with greater precision and confidence. Mastering the analysis of order blocks can enhance trading effectiveness and decision-making in dynamic market environments.

How do order blocks work?

Order blocks serve as pivotal components of technical analysis in trading, offering valuable insights into market dynamics and potential price movements. These blocks represent areas on price charts where significant buying or selling activity has occurred, often attributed to institutional traders or large market participants. Formed at key support and resistance levels or following notable market movements, order blocks are characterized by distinct price consolidations or sharp movements followed by swift reversals.

Traders utilize order blocks to anticipate shifts in market sentiment and strategically position themselves for profitable trades. By identifying and interpreting these blocks, traders can gauge the strength of supply-and-demand imbalances in the market, enabling them to make well-informed trading decisions. Additionally, order blocks provide traders with valuable clues about potential areas of price reversal or continuation, enhancing their ability to capitalize on trading opportunities.

Mastering the analysis of order blocks requires a comprehensive understanding of technical analysis principles and the ability to integrate them into a robust trading strategy. Traders often combine order block analysis with other technical indicators, such as moving averages, oscillators, and volume analysis, to validate trade setups and refine entry and exit points.

Ultimately, order blocks serve as essential tools in the trader’s toolkit, facilitating informed decision-making and enhancing trading effectiveness in dynamic market conditions. By incorporating order block analysis into their trading approach, traders can gain a competitive edge and improve their overall trading performance.

How to find order blocks in trading

Identify Significant Market Moves

Identifying significant market moves is the crucial first step in finding order blocks. These moves, such as breakouts from key levels or sharp pullbacks, often precede order block formations. Breakouts occur when prices reach a significant level of support or resistance, signalling a shift in market sentiment and the potential initiation of new trends. Conversely, sharp pullbacks represent sudden retracements in price after a significant move, reflecting profit-taking or corrective actions by market participants.

By recognizing these moves, traders can anticipate potential order block formations and position themselves strategically to capitalize on ensuing price movements. These moves serve as early indicators of market dynamics, offering valuable insights into potential order block opportunities and enhancing trading decisions with greater precision and confidence. Understanding the significance of significant market moves is essential for effectively identifying and utilizing order blocks in trading strategies.

Locate Consolidation Zones

Order blocks frequently develop within consolidation zones or areas of price congestion on the chart. These zones denote periods of market indecision where buyers and sellers are evenly matched, resulting in the accumulation of orders that can give rise to order blocks. During consolidation, prices tend to move sideways within a defined range, indicating a temporary pause in the prevailing trend as market participants reassess their positions.

Traders often observe consolidation zones as potential areas where order blocks may form, as they represent points of equilibrium where significant buying or selling interest may emerge. By identifying consolidation zones on the chart, traders can pinpoint potential order block formations and anticipate future price movements with greater accuracy. Understanding the role of consolidation zones in order block formation is crucial for effectively identifying and leveraging order blocks in trading strategies.

Analyze Volume Spikes

Volume spikes accompanying price movements indicate increased participation from traders, suggesting the formation of order blocks. High volume levels confirm the significance of price movements and validate the presence of order blocks. A price move is accompanied by a surge in trading volume, which signals strong interest and conviction from market participants, potentially leading to the establishment of significant order blocks.

Traders often interpret volume spikes as confirmation of price momentum and the potential for sustained price action in the direction of the volume surge. By analyzing volume spikes in conjunction with price movements, traders can identify areas of strong buying or selling pressure and anticipate the formation of order blocks with greater confidence. Understanding the relationship between volume spikes and order block formation is essential for effectively incorporating volume analysis into trading strategies and improving trade decision-making processes.

Use Supply and Demand Principles

Order blocks are a reflection of supply-and-demand imbalances in the market. By applying supply and demand analysis, traders can identify areas where significant imbalances exist, potentially leading to the formation of order blocks. Supply and demand analysis involves assessing the interaction between buyers and sellers in the market to determine the equilibrium price levels where supply matches demand. When there is a mismatch between supply and demand, it creates imbalances that can result in order block formation.

Traders look for areas where demand exceeds supply (or vice versa), indicating potential areas for order block formation. By understanding supply and demand dynamics, traders can effectively identify order block opportunities and make informed trading decisions based on the underlying market dynamics. Incorporating supply and demand principles into trading strategies enhances traders’ ability to identify high-probability trade setups and improve overall trading performance.

Observe Price Reactions

Traders closely observe how prices react at key support and resistance levels, as order blocks often form around these areas due to the concentration of buying or selling interest. Support and resistance levels represent significant price zones where historical buying and selling activity has occurred, creating barriers that influence future price movements. When price approaches these levels, traders monitor price behavior for signs of potential order block formations. Sharp bounces, consolidations, or price reversals at these key levels suggest the presence of order blocks as traders react to price movements.

By incorporating support and resistance analysis into their trading strategies, traders can effectively identify order block opportunities and make informed trading decisions with greater precision and confidence. Understanding the importance of price reactions at key support and resistance levels is essential for successfully navigating order block formations in trading strategies.

Utilize Timeframe Analysis

Comparing order block formations across multiple timeframes can provide confirmation of their significance and validity. Traders often analyze order blocks on various timeframes, such as daily, hourly, or even minute charts, to assess their consistency and strength. Consistency in order block formations across different timeframes strengthens their relevance and increases the likelihood of successful trades. When order blocks align across multiple timeframes, it reinforces the validity of the trading setup and enhances confidence in trade decisions.

Additionally, examining order blocks on different timeframes allows traders to gain a comprehensive view of market dynamics and potential price movements. By incorporating timeframe analysis into their trading strategies, traders can effectively confirm order block formations and make well-informed trading decisions based on a holistic understanding of the market. Understanding the importance of timeframe analysis is essential for maximizing the effectiveness of order block trading strategies.

Confirm with Price Action Signals

Validating order block formations with price action signals adds an extra layer of confirmation to trading setups. Candlestick patterns, chart formations, or other price action signals that align with order block formations increase the reliability of trade setups and enhance trading confidence. For example, a bullish engulfing pattern forming at a key support level within an order block strengthens the bullish bias and increases the likelihood of a successful trade. Similarly, a bearish reversal pattern appearing at a resistance level within an order block confirms the bearish sentiment and provides a clear signal for potential short opportunities.

By combining order block analysis with price action signals, traders can refine their trade entries and exits, improve risk management, and increase the probability of profitable trades. Understanding the role of price action signals in confirming order block formations is essential for effective trading decision-making and trade execution.

What is the best indicator for order block?

The best indicator for identifying order blocks in trading is arguably price action itself. While various technical indicators can complement order block analysis, relying primarily on price action allows traders to directly observe the market’s behavior and sentiment. Key support and resistance levels, along with price reactions at these levels, provide valuable clues about potential order block formations.

Additionally, volume analysis can confirm the significance of price movements associated with order blocks. Combining price action analysis with volume and support/resistance levels enhances the accuracy of identifying order blocks and strengthens trading decisions. Ultimately, understanding and interpreting price action in conjunction with other technical factors offers a robust approach to effectively identifying and utilizing order blocks in trading strategies.

Navigating the complexities of the financial markets requires a keen understanding of support and resistance levels. Let’s uncover the top 7 support and resistance indicators to enhance your trading strategies.

In the dynamic world of trading, identifying key support and resistance levels is essential for making informed investment decisions. In this comprehensive guide, we’ll explore the top 7 support and resistance indicators that every trader should know. From traditional methods to advanced technical analysis tools, we’ll delve into each indicator’s functionality, strengths, and weaknesses. Whether you’re a novice trader looking to enhance your skills or a seasoned investor seeking new insights, this article has something for everyone. Join us as we unravel the mysteries of support and resistance levels, empowering you to take your trading game to the next level.

What is support and resistance?

Support refers to a price level where a downward trend is expected to pause or reverse as demand for the asset increases, preventing further price declines. Resistance, on the other hand, is a price level where an upward trend is anticipated to halt or reverse as selling pressure becomes dominant, preventing further price increases. Traders use support and resistance levels to identify potential entry and exit points, as well as to gauge the strength of market trends.

These levels are often identified using technical analysis tools such as trendlines, moving averages, and chart patterns. Understanding support and resistance levels is crucial for making informed trading decisions and managing risk effectively in financial markets.

Top support and resistance indicators

Explore the most effective support and resistance indicators utilized by traders to navigate financial markets and optimize investment strategies.

Fibonacci Support & Resistance

Fibonacci Support & Resistance is a popular technical analysis tool utilized by traders to identify potential price reversal levels in financial markets. Developed based on the Fibonacci sequence, this indicator is founded on the work of Italian mathematician Leonardo of Pisa, also known as Fibonacci. The project aims to apply mathematical principles to market analysis, leveraging key Fibonacci ratios like 0.618, 0.382, and 0.236 to pinpoint significant support and resistance levels.

Fibonacci Support & Resistance holds immense potential due to its ability to objectively identify price levels where buying or selling pressure is likely to emerge, aiding traders in making more accurate trading decisions. Its widespread adoption and historical effectiveness make it a valuable tool for technical analysts seeking to anticipate market movements and optimize their trading strategies.

Wolfe Waves

Wolfe Waves is a technical analysis pattern developed by Bill Wolfe, a trader and financial analyst. The project is based on the observation of specific price patterns in financial markets, aiming to identify potential reversal points with high accuracy. Wolfe Waves utilize a combination of trendlines and geometric shapes to spot patterns characterized by converging and diverging trendlines, forming distinct waves.

These patterns indicate potential support and resistance levels, helping traders anticipate market reversals and entry points. Wolfe Waves hold significant potential due to their ability to identify price patterns with defined entry and exit points, enhancing traders’ ability to execute well-timed trades. As a result, Wolfe Waves are widely utilized by technical analysts and traders seeking to capitalize on market trends and optimize their trading strategies.

Pivot Points

Established by floor traders in the early 20th century, Pivot Points are a widely used technical analysis tool in financial markets. The project aims to identify key support and resistance levels based on the previous day’s trading data. Using a simple mathematical formula, pivot points calculate potential price levels for the current trading session. Traders utilize these levels to gauge market sentiment and make informed trading decisions.

Pivot points hold significant potential due to their simplicity and effectiveness in identifying critical price levels where market dynamics may change. By providing clear reference points, pivot points help traders anticipate potential price movements and adjust their strategies accordingly. As a result, pivot points are favored by both novice and experienced traders for their ability to enhance trading precision and increase the probability of successful trades.

Camarilla Pivots

Camarilla Points, pioneered by a trader known only as Nick Stott, is a technical analysis tool. The project aims to identify potential support and resistance levels in financial markets using a proprietary formula. Camarilla Points leverage key price levels derived from the previous day’s trading range to predict future price movements. Traders utilize these levels to gauge market sentiment and make informed trading decisions.

Camarilla Points hold significant potential due to their ability to provide precise and actionable support and resistance levels, aiding traders in identifying entry and exit points with greater accuracy. By offering clear reference points, Camarilla Points enhance trading precision and increase the likelihood of successful trades. As a result, they are widely favored by traders looking to optimize their trading strategies and capitalize on market opportunities.

Murrey Math Lines

Formed by T. Henning Murrey, Murrey Math Lines are a set of mathematical indicators used to identify potential support and resistance levels in financial markets.The project applies mathematical principles to market analysis, utilizing a set of horizontal lines that represent significant price levels based on geometric relationships. Traders leverage these lines to anticipate price movements and make informed trading decisions.

Murrey Math Lines hold significant potential due to their ability to provide clear and objective support and resistance levels, aiding traders in identifying key entry and exit points with precision. By offering a systematic approach to analyzing market dynamics, Murrey Math Lines enhances traders’ understanding of market trends and improves the accuracy of their trading strategies. As a result, they are widely utilized by technical analysts and traders seeking to optimize their trading performance and achieve consistent profitability.

Andrew’s Pitchfork

Conceptualized by Dr. Alan H. Andrews, Andrew’s Pitchfork is a methodology designed to identify potential support and resistance levels in financial markets. The project aims to analyze price trends and forecast future price movements using a set of parallel trendlines. Traders leverage these trendlines to identify key entry and exit points and anticipate potential market reversals. Andrew’s Pitchfork holds significant potential due to its ability to provide clear and actionable support and resistance levels, aiding traders in making informed trading decisions.

By offering a systematic approach to analyzing market dynamics, Andrew’s Pitchfork enhances traders’ understanding of market trends and improves the accuracy of their trading strategies. As a result, it is widely favored by technical analysts and traders seeking to optimize their trading performance and achieve consistent profitability.

Speed Resistance Lines

Speed Resistance Lines, created by George Lane, are a technical analysis tool used to identify potential support and resistance levels in financial markets. The project aims to analyze price trends and anticipate future price movements by plotting trendlines based on historical price data. Traders leverage these trendlines to identify key entry and exit points and gauge the strength of market trends. Speed resistance lines hold significant potential due to their ability to provide clear and actionable support and resistance levels, aiding traders in making informed trading decisions.

By offering a systematic approach to analyzing market dynamics, Speed Resistance Lines enhance traders’ understanding of market trends and improve the accuracy of their trading strategies. As a result, they are widely favored by technical analysts and traders seeking to optimize their trading performance and achieve consistent profitability.

How do you identify support and resistance?

Support and resistance levels in financial markets are identified through various methods in technical analysis. Support levels are identified as price levels where buying interest is strong enough to overcome selling pressure, preventing the price from falling further. Traders typically look for areas where the price has bounced off multiple times in the past, forming a horizontal line of support.

Resistance levels, on the other hand, are identified as price levels where selling interest is strong enough to overcome buying pressure, preventing the price from rising further. Traders often identify resistance levels where the price has encountered significant selling pressure multiple times, forming a horizontal line of resistance. Additionally, trendlines, moving averages, pivot points, and other technical indicators can also be used to identify support and resistance levels, providing traders with valuable insights into potential price movements.