

The Moving Average Convergence/Divergence (MACD Indicator) is a cornerstone of technical analysis in financial markets. Known for its ability to measure momentum and trend direction, the MACD Indicator provides traders with powerful insights into market behavior. In this guide, we’ll explore its components, history, and practical applications, equipping you to integrate this tool into your trading strategies effectively.
Article summary
What Is the MACD Indicator?
The MACD is a versatile indicator that combines elements of both trend-following and momentum analysis. It achieves this by using two types of moving averages to gauge the strength and direction of price movements.
A Brief History of MACD
In the 1970s, Gerald Appel introduced the MACD line as a groundbreaking tool for measuring trend strength and direction by subtracting a longer-term EMA from a shorter-term EMA. This innovation provided traders with a clear view of price momentum and trends. In 1986, Thomas Aspray enhanced the MACD with the addition of the histogram, a visual feature that displayed the difference between the MACD line and the signal line. This improvement allowed traders to anticipate crossovers and momentum shifts earlier, solidifying the MACD’s reputation as a powerful indicator.
By the 1990s, the MACD Indicator had become a standard feature in charting platforms, gaining popularity among traders globally. Its versatility has since been enhanced with variations like the Adaptive MACD, allowing traders to tailor its settings for different timeframes and assets. This enduring legacy of innovation highlights the MACD’s value as a versatile tool that blends trend-following and momentum insights. Let’s now explore how some of the most prominent traders and analysts have used the MACD to navigate and excel in the markets.
Prominent Traders and Analysts in Trading: How They Use the MACD

 1. Gerald Appel
- Who: Creator of the MACD indicator, Gerald Appel was a respected financial analyst, fund manager, and author.
- How He Used It: Appel originally developed the MACD to enhance his ability to identify trends and momentum in equities and mutual funds. He utilized it extensively in his investment newsletters and trading strategies.
- Legacy: Appel’s MACD became a foundation for many technical analysis strategies used by traders worldwide.

 2. Thomas Aspray
- Who: A renowned technical analyst, Thomas Aspray added the histogram feature to the MACD in 1986.
- How He Used It: Aspray leveraged the histogram to reduce lag in MACD signals and used it to anticipate potential crossovers and momentum changes. This innovation significantly improved the predictive power of the MACD.

3. Linda Bradford Raschke
- Who: A legendary commodities and futures trader, Linda Raschke is known for her technical analysis expertise.
- How She Used It: While she employed multiple indicators, Raschke frequently highlighted the MACD as a key component of her toolkit for identifying trends and momentum in highly volatile markets.
- Notable Mention: Raschke often combined the MACD with other tools like RSI or Stochastic Oscillators to refine her trade entries and exits.
4. John Murphy

- Who: A pioneer of modern technical analysis and author of Technical Analysis of the Financial Markets, John Murphy is one of the most influential figures in the field.
- How He Used It: Murphy extensively discussed the MACD in his writings as a prime example of a trend-following and momentum indicator. He emphasized its versatility and simplicity in analyzing trends across various asset classes.
Breaking Down MACD’s Components: How MACD Indicator Is Calculated
As we’ve learned about the MACD’s history and its adoption by notable traders and analysts, understanding how this powerful indicator is calculated is the next step in mastering its fundamentals. The MACD indicator effectiveness lies in its ability to combine trend-following and momentum analysis through three key components: the MACD Line, the Signal Line, and the Histogram.
Start earning 60% a year with automated trading Free Sign Up Let’s break down the step-by-step process behind these calculations and uncover how each element contributes to analyzing market movements.
MACD Line:


 The MACD Line the primary line derived from the difference between a short-term EMA (typically 12 periods) and a long-term EMA (usually 26 periods). It captures changes in trend direction and strength.
Signal Line:
 The Signal Line lags behind the MACD Line and serves as a reference for crossover signals. smooths the MACD Line, providing a clearer picture of momentum shifts.
 Histogram:
 The Histogram visualizes the gap between the MACD Line and the Signal Line, oscillating above and below a Zero Line, providing an intuitive way to gauge momentum.
 The MACD Line the primary line derived from the difference between a short-term EMA (typically 12 periods) and a long-term EMA (usually 26 periods). It captures changes in trend direction and strength.
 The Signal Line lags behind the MACD Line and serves as a reference for crossover signals. smooths the MACD Line, providing a clearer picture of momentum shifts.
  The Histogram visualizes the gap between the MACD Line and the Signal Line, oscillating above and below a Zero Line, providing an intuitive way to gauge momentum.
Key Signals of the MACD Indicator: Crossover, Zero Line, and Divergence
1. Signal Line Crossovers
 The most common signals generated by MACD occur when the MACD Line crosses the Signal Line:
- Bullish Crossover: MACD Line crosses above the Signal Line, signaling increasing upside momentum.
- Bearish Crossover: MACD Line crosses below the Signal Line, indicating growing downside momentum.
2. Zero Line Crossovers
 These occur when the MACD Line crosses the Zero Line:
- Bullish Zero Line Crossover: MACD Line moves from negative to positive, signaling the start of an uptrend.
- Bearish Zero Line Crossover: MACD Line moves from positive to negative, indicating the onset of a downtrend.
3. Divergence
 Divergence between MACD and price action often signals potential reversals:
- Bullish Divergence: Price makes lower lows, but MACD records higher lows, suggesting weakening bearish momentum.
- Bearish Divergence: Price makes higher highs, but MACD shows lower highs, indicating fading bullish momentum.
Strengths and Limitations of MACD Indicator
The MACD indicator is a widely respected indicator in technical analysis due to its versatility and reliability. However, like any tool, it has its strengths and weaknesses. Understanding these aspects helps traders use it effectively while avoiding potential pitfalls.
Strengths of MACD Indicator
- Dual Purpose
The MACD combines two powerful analytical approaches: trend-following and momentum measurement. By integrating two moving averages and the histogram, it provides insights into both the direction and strength of price movements. This versatility makes it a valuable tool for traders looking for comprehensive market analysis. - Clear Visuals
One of the MACD’s most appealing features is its simplicity. The histogram and crossover signals are visually intuitive, making it accessible to traders of all experience levels. Beginners can quickly grasp its signals, while experienced traders can incorporate it into more complex strategies. - Wide Applicability
The MACD works effectively across multiple timeframes and asset classes, from stocks and forex to cryptocurrencies and commodities. Its adaptability ensures that traders can use it in various markets, whether they are scalping, swing trading, or position trading.
Limitations of MACD Indicator
- Lagging Nature
Since the MACD relies on moving averages, it inherently lags behind current price action. This can cause delays in identifying trend reversals, particularly in fast-moving or highly volatile markets. Traders should combine it with leading indicators to mitigate this limitation. - Not Suitable for Overbought/Oversold Conditions
Unlike oscillators like RSI or Stochastic, the MACD is unbounded, meaning it doesn’t have a fixed range of values. This makes it unreliable for identifying overbought or oversold conditions, as what’s considered “high” or “low” varies across assets. - False Signals
In choppy or sideways markets, the MACD can generate frequent crossover signals, many of which may be false. These “whipsaws” can lead to unnecessary trades and potential losses. Combining the MACD with other indicators, such as support and resistance levels, can help filter out noise.
Maximizing Strengths While Mitigating Limitations
To make the most of the MACD indicator, traders should pair it with complementary tools like RSI, trendlines, or Bollinger Bands to confirm signals. Additionally, adjusting the MACD’s settings to suit the specific asset or timeframe can enhance its accuracy and reduce the impact of lag and false signals. Understanding these nuances allows traders to harness the MACD’s strengths effectively while navigating its limitations.
Practical Applications of MACD Indicator
The MACD is a versatile tool that can be applied in various ways to enhance trading strategies. By combining its signals with other indicators or using it independently, traders can gain valuable insights into market behavior and optimize their entries and exits.
Trend Confirmation
The MACD is an excellent tool for confirming trends, especially when used alongside complementary indicators. By pairing the MACD with tools like RSI or Bollinger Bands, traders can strengthen their analysis and reduce the risk of false signals. For example, a bullish MACD crossover supported by RSI moving out of an oversold zone can provide a strong indication of an uptrend. Similarly, in a downtrend, a bearish MACD crossover confirmed by a Bollinger Band breakout can signal further downside momentum.
Momentum Reversals
One of the MACD’s standout features is its ability to detect momentum shifts before they appear in price action. Divergences between the MACD and price provide early warning signs of potential reversals. For instance, a bullish divergence occurs when the price makes lower lows, but the MACD records higher lows, suggesting waning bearish momentum. Conversely, a bearish divergence, where the price makes higher highs, but the MACD shows lower highs, signals weakening bullish momentum. These scenarios allow traders to prepare for possible market reversals with better precision.
Trade Entries and Exits
The MACD’s crossover signals are highly effective for timing trade entries and exits. A bullish crossover, where the MACD Line moves above the Signal Line, indicates a buying opportunity and is often used as a trigger to enter long positions. Conversely, a bearish crossover, where the MACD Line falls below the Signal Line, signals a selling opportunity and can be used to exit long trades or initiate short positions. When combined with support and resistance levels or other technical tools, these signals can significantly improve trade timing and profitability.
Maximizing Practical Applications
To fully leverage the MACD’s potential, traders should align its use with their specific trading goals and market conditions. For instance, combining MACD with trendlines can enhance its effectiveness in trending markets, while using divergence signals in range-bound conditions can help spot reversals early.
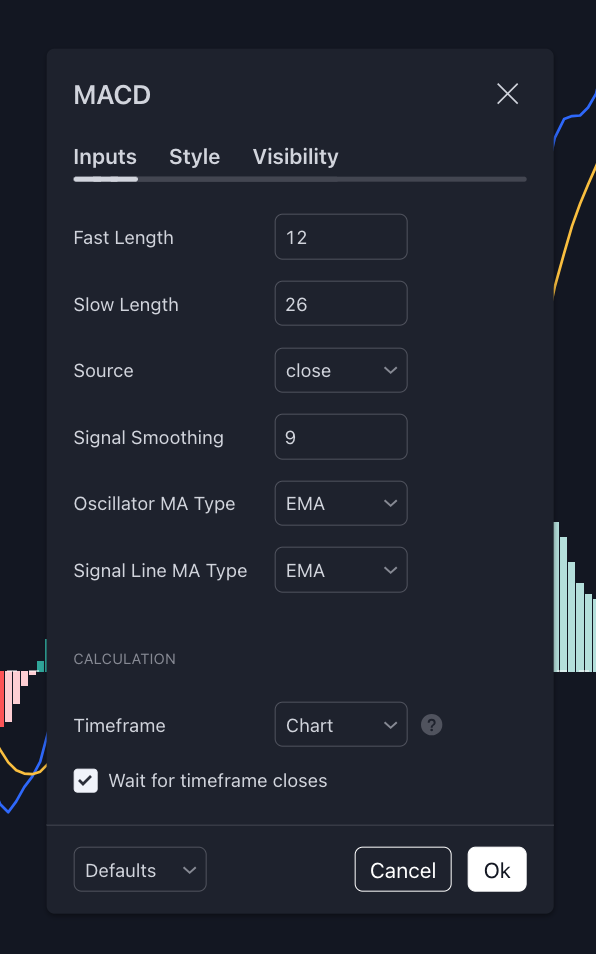
 Customizing MACD Indicator Settings
Inputs Options
One of the strengths of the MACD indicator is its flexibility, allowing traders to adjust its settings to align with their specific trading strategies and market conditions. By customizing the key inputs, traders can fine-tune the MACD for different assets, timeframes, and volatility levels:
- Fast Length (12): This defines the period for the shorter EMA, which reacts quickly to price changes and captures short-term momentum shifts. Adjusting this value can make the MACD more sensitive to rapid price movements.
- Slow Length (26): The period for the longer EMA, which smooths out longer-term price trends. A higher value can reduce noise but may cause the MACD to lag.
- Signal Smoothing (9): This is the period for the EMA of the MACD Line, also known as the Signal Line. Modifying this setting affects how quickly the Signal Line reacts to changes in the MACD Line.
Traders often experiment with these settings to match the MACD’s responsiveness to their preferred asset class and trading style. For instance, shorter settings (e.g., 6, 13, 5) might be more suitable for highly volatile assets like cryptocurrencies, while longer settings are better for steady, trending stocks.
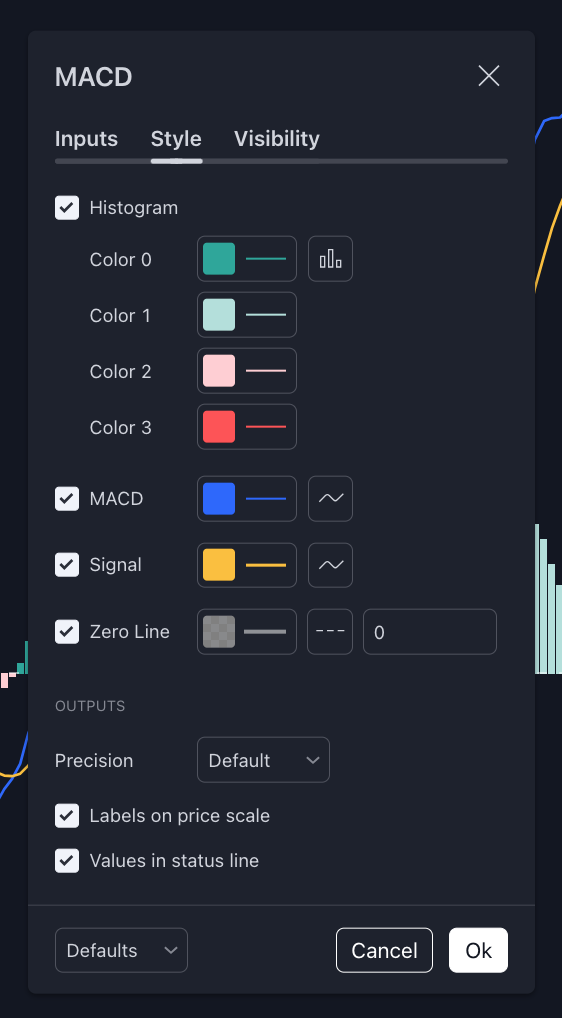
 Styling Options
In addition to adjusting the MACD’s calculation settings, traders can also modify its visual representation to enhance clarity and usability on their charts. These styling options allow for a personalized trading experience:
- Histogram: Traders can customize the visibility, color, and thickness of the histogram to better identify momentum shifts. Using distinct colors for positive and negative values can make bullish and bearish momentum clearer at a glance.
- MACD and Signal Lines: The line styles for the MACD Line and Signal Line can be adjusted for better readability. For example, using bold or contrasting colors helps differentiate them in busy charts.
- Precision: Setting the number of decimal places allows for greater accuracy when analyzing the MACD’s numerical values, which can be particularly useful in low-volatility markets or when trading assets with smaller price movements.
By combining customized settings and personalized styling, traders can create a MACD setup that not only aligns with their trading strategy but also enhances their ability to quickly interpret key signals and market trends.
Conclusion
MACD is a versatile and powerful tool that provides traders with insights into momentum and trend direction. While it has its limitations, its ability to combine lagging indicators with momentum analysis makes it invaluable for traders of all skill levels. By understanding its signals and customizing it to fit your trading style, you can effectively incorporate MACD into your strategies and enhance your decision-making process.

With over seven years of experience in trading since 2017, I specialize in cryptocurrency markets while sharing insights through engaging content. Proud to rank among the top 100 most popular analysts on TradingView of all time, I bring a blend of expertise, passion, and actionable strategies to the trading community.