
A successful investment portfolio does not come easy. For the longest time, investors have searched for proper investment portfolio management techniques. This is where metrics come in. This article explains the key investment portfolio metrics to help you on your journey through a successful investment.
Article summary
What are investment portfolio metrics?
Investment portfolio metrics are quantitative gauges used to analyze and evaluate the performance of a group of investments. Investment portfolio metrics are used by a variety of people ranging from analysts, and portfolio managers, to the average investor. There are a plethora of investment metrics sourced from data points, and intense research. But in this piece, we will focus on 5 key investment portfolio metrics you can follow.
ROI
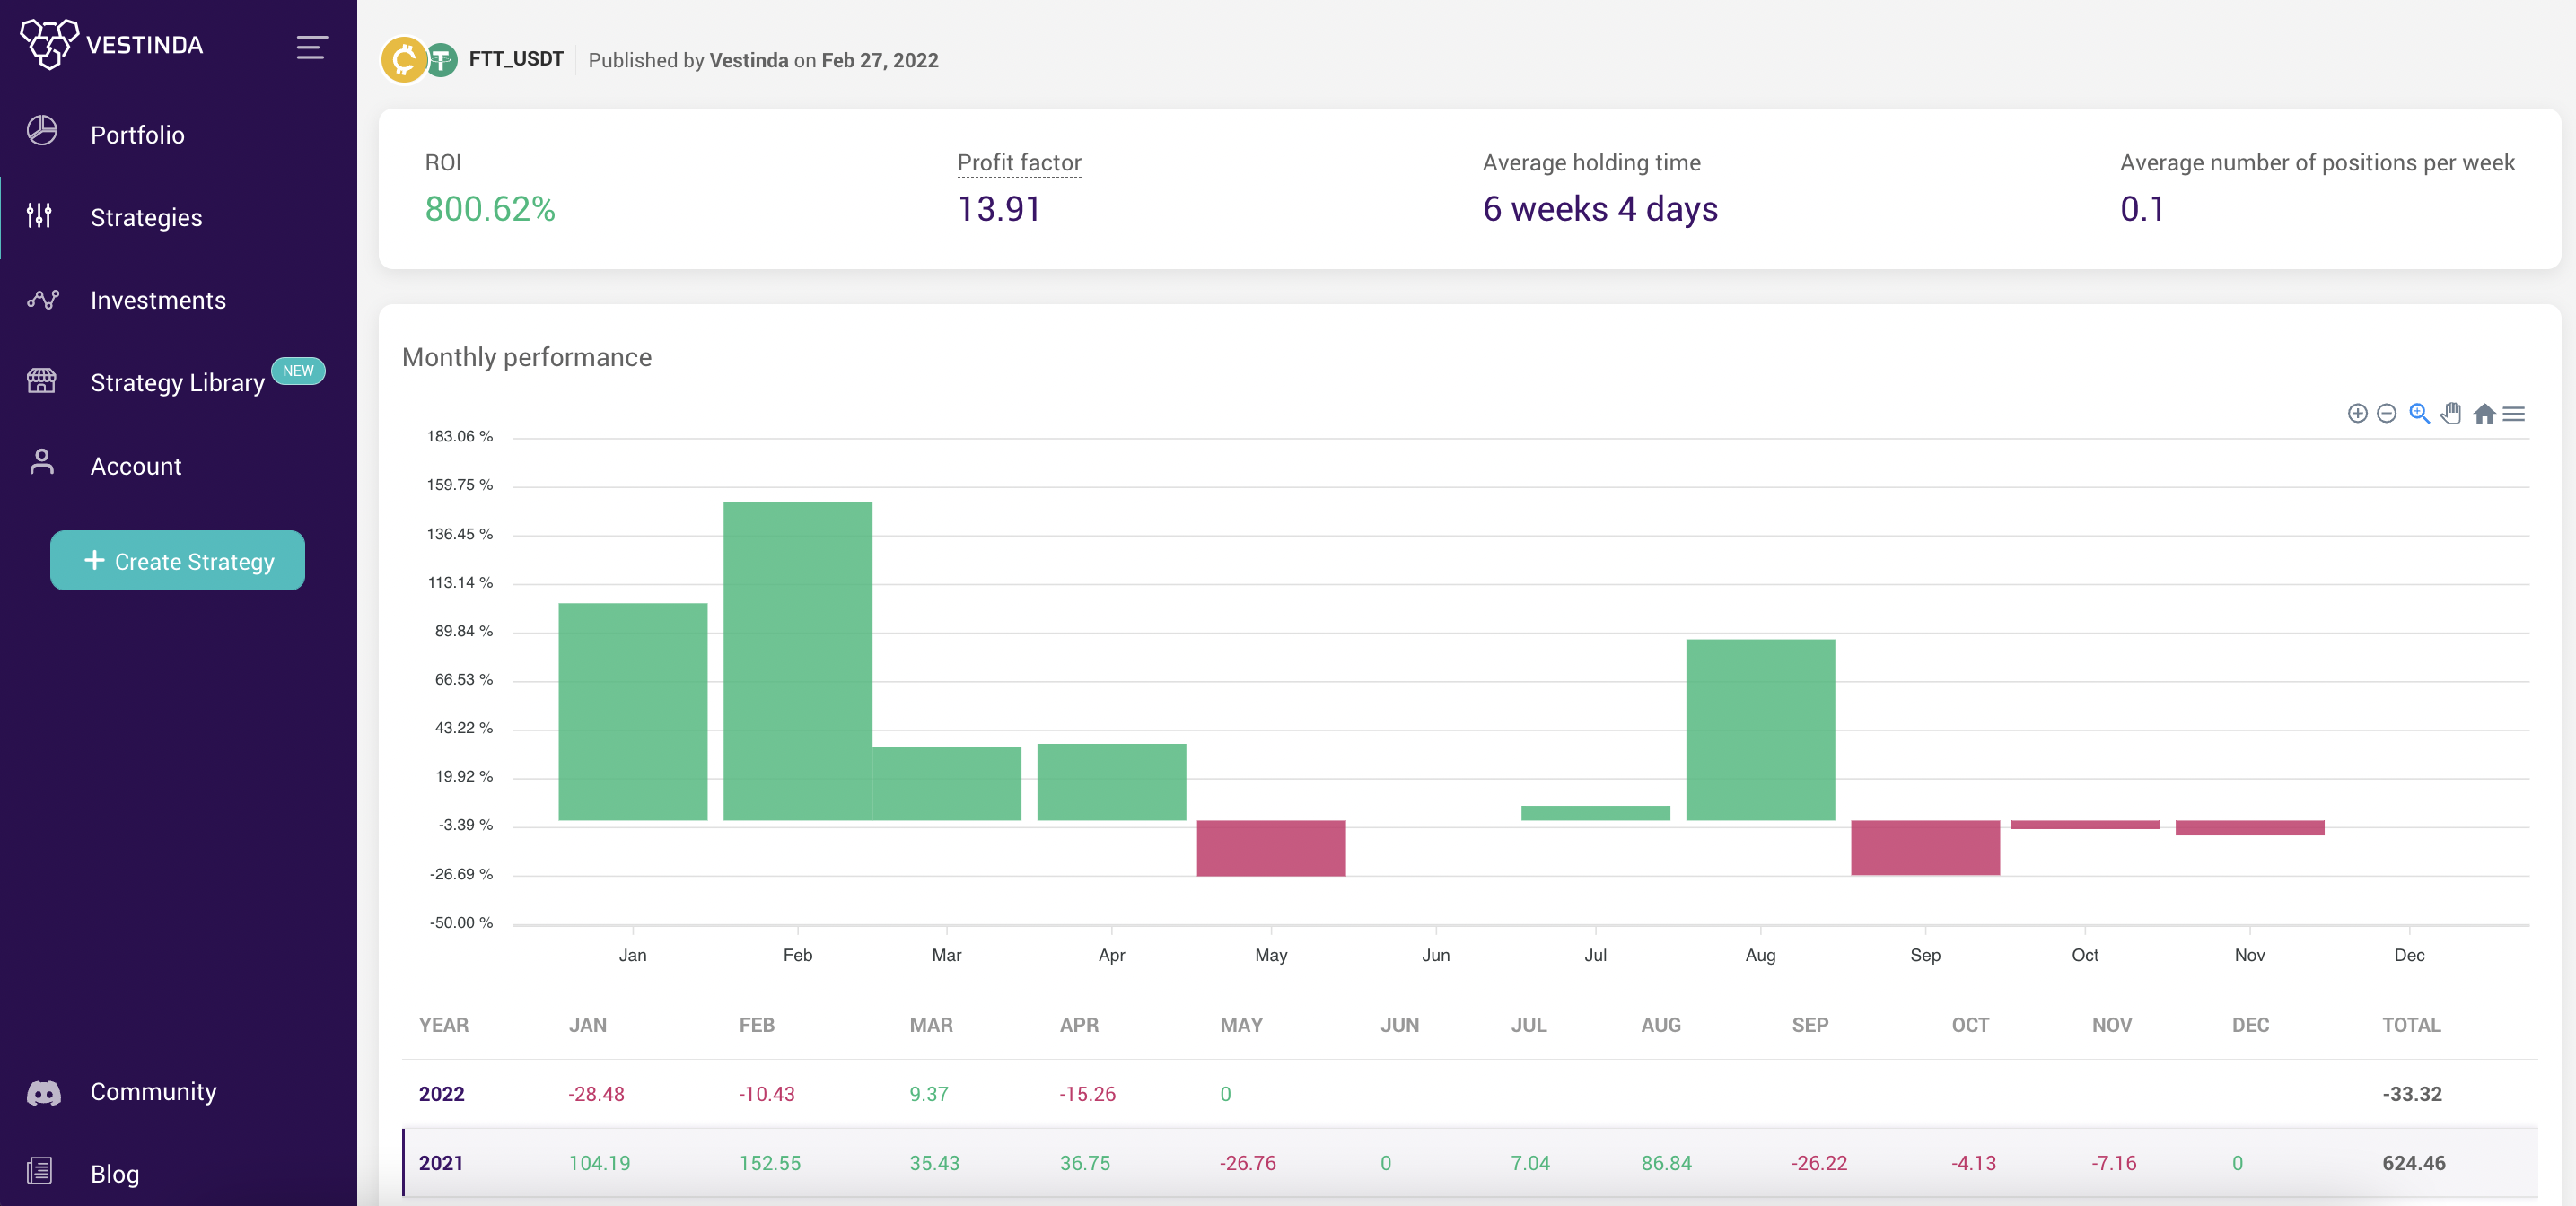
Return of investment (ROI) is a performance metric used to analyze the efficiency of an investment or a variety of investments. ROI uses the cost of investment to determine an investment’s profit. It also helps with investment portfolio management. This metric is often preferred because of its simplicity and ability to be used for several investments. ROI can be applied in various sectors like the stock market, crypto investment, small-scale, and large-scale businesses. The return of investments is usually represented by ratios or percentages. Hence, it is easy to compare the success of one investment to many others.
To calculate ROI, you will need a few parameters. Such parameters include present investment value and cost of investment.
When finding ROI, you will subtract the cost of investment from your present investment value and divide the figure by your cost of investment. Then, multiply by 100 to get your answer in percentage form.
Mathematically:
Start earning 60% a year with automated trading Free Sign UpROI = (Present investment value – Cost of investment) / (Cost of investment) x 100
ROI can be used to make important financial decisions. For example, if you had spent $500 on marketing and received $2000 in sales, you have an ROI of 300%. Hence, you will be aware that marketing for your company brings good returns.
Note that ROI does not acknowledge time during analysis. Hence, more attention is given to returns while time is neglected.
Profit factor
Profit factor is referred to as the division of a gross profit by a gross loss over a trading period. For clarity, gross profit and gross loss entail the total amount of money gained or lost in an investment respectively. A profit factor is represented as a ratio. Profit factor and returns are directly proportional. A high-profit factor will yield good returns and vice versa.
Here is the calculation for a profit factor:
Profit factor = Gross profit / Gross loss
For better understanding, we will take an example. Suppose you made a loss of $50 on a particular strategy. If you later make a profit of $150, then your profit factor will be;
Profit factor = $150 / $50 = 3.0
A profit factor of 1.0 is fairly profitable while 2.0 is good. A profit factor of 3.0, on the other hand, is excellent. While a profit factor of less than 1.0 represents a losing factor.
Understandably, you might not always get a profit factor of 3.0. A good line to stay in is anything from 1.75.
Average Holding Time
A holding time is a period from the purchase of an asset to the time it is sold. In simple terms, it is a time an investor keeps or holds an investment. Well, this is just a broad definition of holding time.
Holding time is usually characterized by long positions and short positions. For long positions, assets are bought with the hopes of selling them when the prices increase. Hence, the holding period for long positions refers to the duration an asset is bought to the time it is sold. For short positions, assets are borrowed and sold with the hopes of repurchasing them after their price has been reduced. Hence, the holding period for short positions refers to the duration a seller repurchases an asset till the time the position is closed by the lender. Long-term holds last for a year and above while short-term holds last for less than a year.
Holding time depends on the trading strategy, and types of investment among other factors. But the average holding time currently seems to be on the shorter side. According to The New York stock exchange, the average holding time in 2020 was 5.5 months.
The average holding time as a metric can give you an idea of the volatility and the strength of some assets in the market. It can also provide a sense of the duration an asset will last before you will have to sell it.
Investment portfolio metrics in Vestinda
The average number of positions per week
An important investment portfolio metric is the number of positions per week in an investment. Before getting deep, let’s analyze the concept of positions. A position refers to the number of properties and securities a person owns in a market. An open position is denoted by the existing securities owned by a trader. But when the securities are sold, the position is closed.
A good investment portfolio metric is accessing the number of positions that can be opened and closed in a week. Position frequencies can help to determine the strength of a series of positions in an investment portfolio and how to fair with them. In investment, diversification of portfolios is highly encouraged. This concept implies splitting your money across different assets. Portfolio diversification helps to reduce risks. It reminds traders not to put all hopes on one asset and make room for others. If one asset fails, the rest might make up for it. Portfolio diversification might be great fuel for the average number of positions made by an investor per week.
However, we must not lose sight of the ills of too many open positions at a time. It may cause more harm than good to your investment portfolio. Hence, you should ensure just the right number of positions per week.
Trading volume
A trading volume is the number of units of a particular asset exchanged between buyers and sellers over a particular period. This is an essential metric because the trading volume has a good relation to price, entry, and exit signals. It is also a good indicator of when to take action in the market.
What exactly do trading volumes tell you about an asset? High trading volume indicates the rising interest of buyers. This means that plenty of units of a particular security is being traded. High trading volume could also be an effect of news shared about an asset. The general expectation would be that high trading volume will cause great fluctuations in price. That is not always the case because very large trades would be required to have a major effect on price due to the already existing trades. However, high trading volumes followed by a price decrease should call for concern. It could signal an increase in sales but a continuous price decrease.
Trading volume could also indicate entry and exit signals. High trading volume indicates high liquidity which is a good sign for entering trades. Because there are many buyers and sellers in the market, liquidation will be easy. Low trading volume can be a signal to make way with your profits and exit a trade. This implies selling your assets due to the low units being bought and sold.
In the course of investment portfolio management, the knowledge of metrics is essential. Each metric will help you with risk control, impulsive decisions, and a better understanding of your investments. Endeavor to conduct adequate research in addition to your investment portfolio metrics for good returns.

Diana is the CTO of Vestinda.
She’s an engineer with extensive experience in the payments space, passionate about mathematics and artificial intelligence.
