
-
 Create
account -
 Build trading strategies
with no code -
 Validate
& Backtest -
 Connect exchange
& start earning
Algorithmic Strategies & Backtesting results for SPX
Here are some SPX trading strategies along with their past performance. You can validate these strategies (and many more) for free on Vestinda across thousands of assets and many years of historical data.
Algorithmic Trading Strategy: ATR Breakout Strategy on SPX
The backtesting results for a trading strategy from November 20, 2016 to November 20, 2023, indicate a profit factor of 1.24, suggesting a profitable approach. The annualized return on investment stands at 1.38%, indicating a consistent albeit modest growth rate. The average holding time for trades is approximately 9 weeks and 4 days, indicating a long-term focus. With an average of 0.05 trades per week, there seems to be a more selective approach to trading. Out of 21 closed trades, 52.38% were winners, implying a moderate success rate. Overall, the strategy has provided a return on investment of 9.89%, reinforcing its potential viability.
 SPX
SPX

Choose another period and try again.
Algorithmic Trading Strategy: Template BB RSI on SPX
Based on the backtesting results statistics for the trading strategy during the period from November 20, 2022, to November 20, 2023, it is evident that the strategy has performed moderately well. The profit factor stands at 1.6, indicating that for every unit of risk taken, the strategy generated 1.6 units of profit. The annualized return on investment (ROI) is 0.51%, suggesting a conservative but steady growth over the given timeframe. On average, trades were held for approximately 4 days and 10 hours, indicating a relatively short-term approach. With an average of 0.05 trades per week, the strategy executed a limited number of trades. Of the 3 closed trades, 66.67% were profitable, further emphasizing the strategy's success. Overall, these results reveal a modest but effective trading strategy.
SPX
Choose another period and try again.
Long-Term Investment Strategies for SPX (SPX500/USD)
Introduction
The S&P 500 (SPX), representing the top 500 companies listed in the U.S., is a cornerstone of the global financial market. Many investors view the SPX as a reliable long-term investment due to its historical growth and diversified exposure across multiple sectors. This guide will explore various long-term strategies for investing in the S&P 500, helping you build a portfolio that withstands market volatility while generating consistent returns.
Why Invest in SPX for the Long Term?
- Diversification: The S&P 500 provides broad exposure to the largest U.S. companies across industries, reducing single-stock risk.
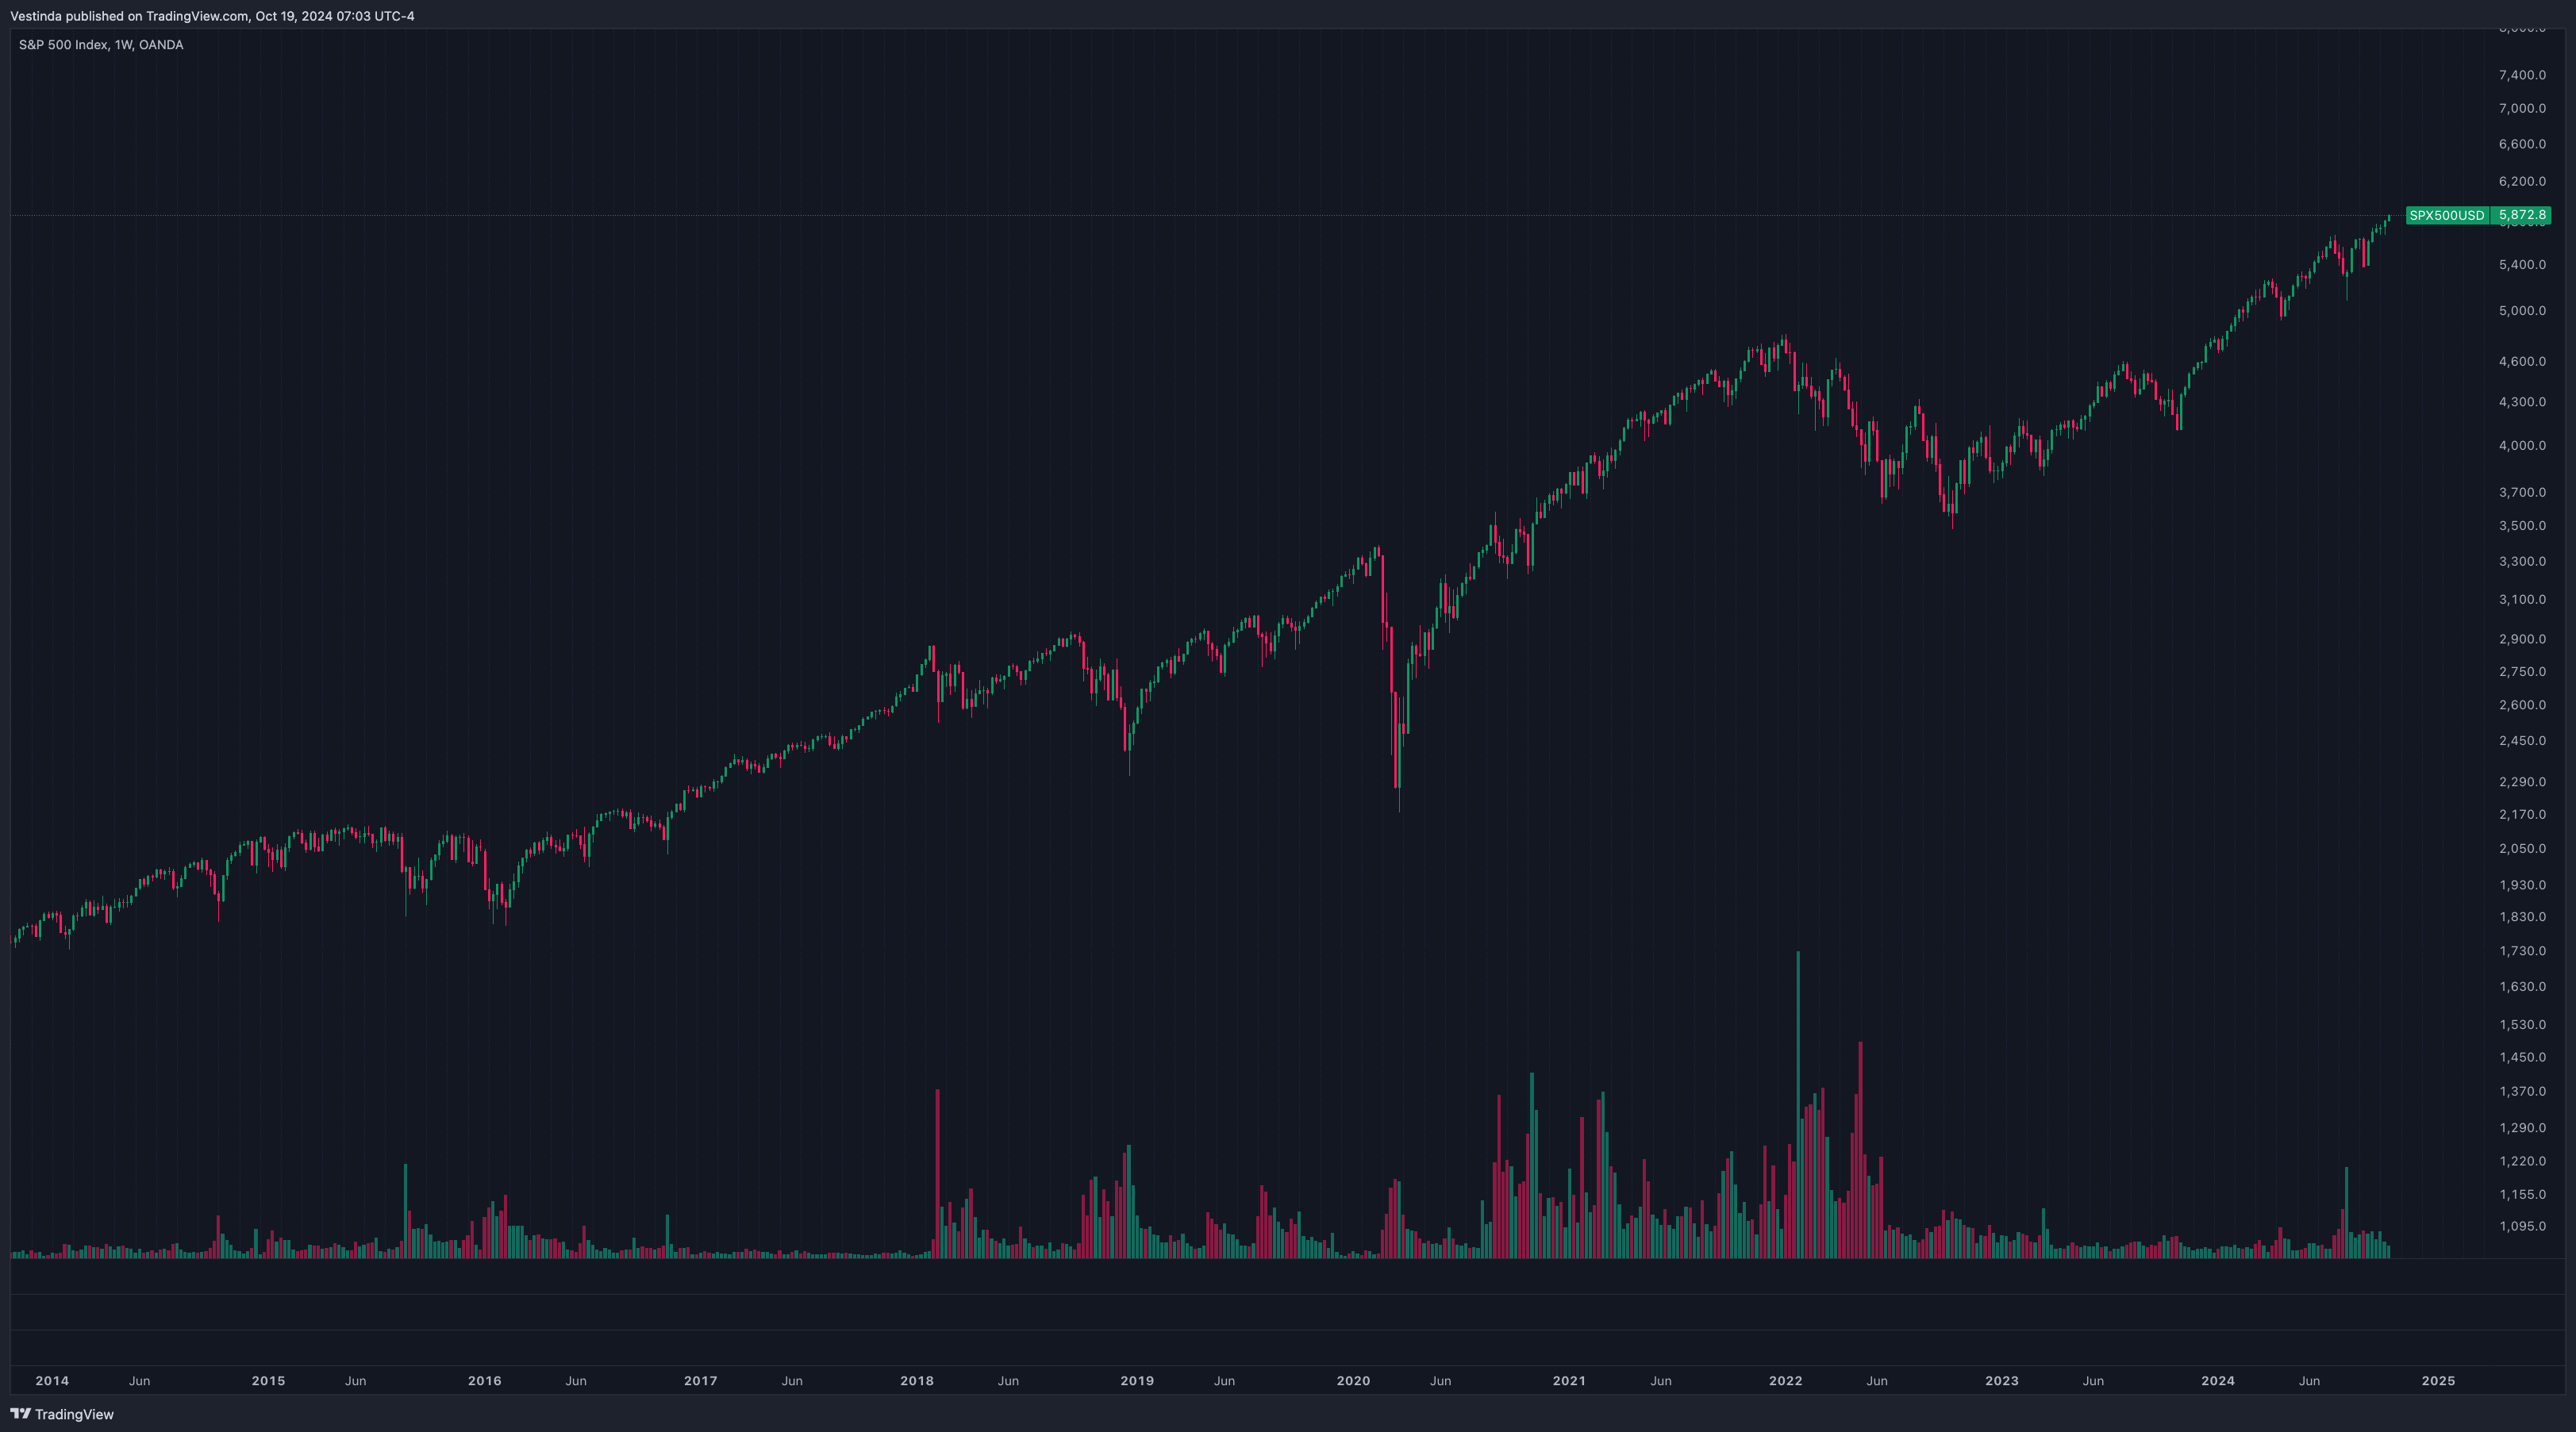
- Historical Performance: The index has delivered an average annual return of about 7-10%, making it a strong candidate for long-term growth.
- Compounding Growth: Long-term investors benefit from the power of compounding, which can significantly increase returns over time as dividends are reinvested.
Key Long-Term Investment Strategies for SPX:
Buy and Hold Strategy
Concept: The buy and hold strategy involves purchasing shares of SPX and holding them for the long term, ignoring short-term volatility.
Why It Works: Over time, the S&P 500 has shown resilience, recovering from market downturns and delivering strong returns.
How to Implement: Invest in an SPX index fund or ETF (such as SPY or VOO) and hold for a minimum of 5-10 years, reinvesting dividends to maximize compounding returns.
Tips: Stay focused on the long-term goal and avoid reacting to short-term market fluctuations.
Dollar-Cost Averaging (DCA)
Concept: Dollar-cost averaging involves regularly investing a fixed amount of money into SPX, regardless of the market price.
Why It Works: This strategy reduces the impact of market volatility by spreading purchases over time, potentially lowering the average cost of shares.
How to Implement: Set up an automatic investment plan that purchases SPX shares or ETFs monthly, quarterly, or annually.
Tips: This method is especially effective in uncertain markets, as it removes the need to time the market.
Moving Average Crossover Strategy (for Long-Term Trends)
Concept: Moving averages help smooth out price data to identify long-term trends. A moving average crossover strategy can signal potential entry and exit points based on trend changes.
Why It Works: Over time, significant moving average crossovers can signal long-term bullish or bearish trends.
How to Implement:
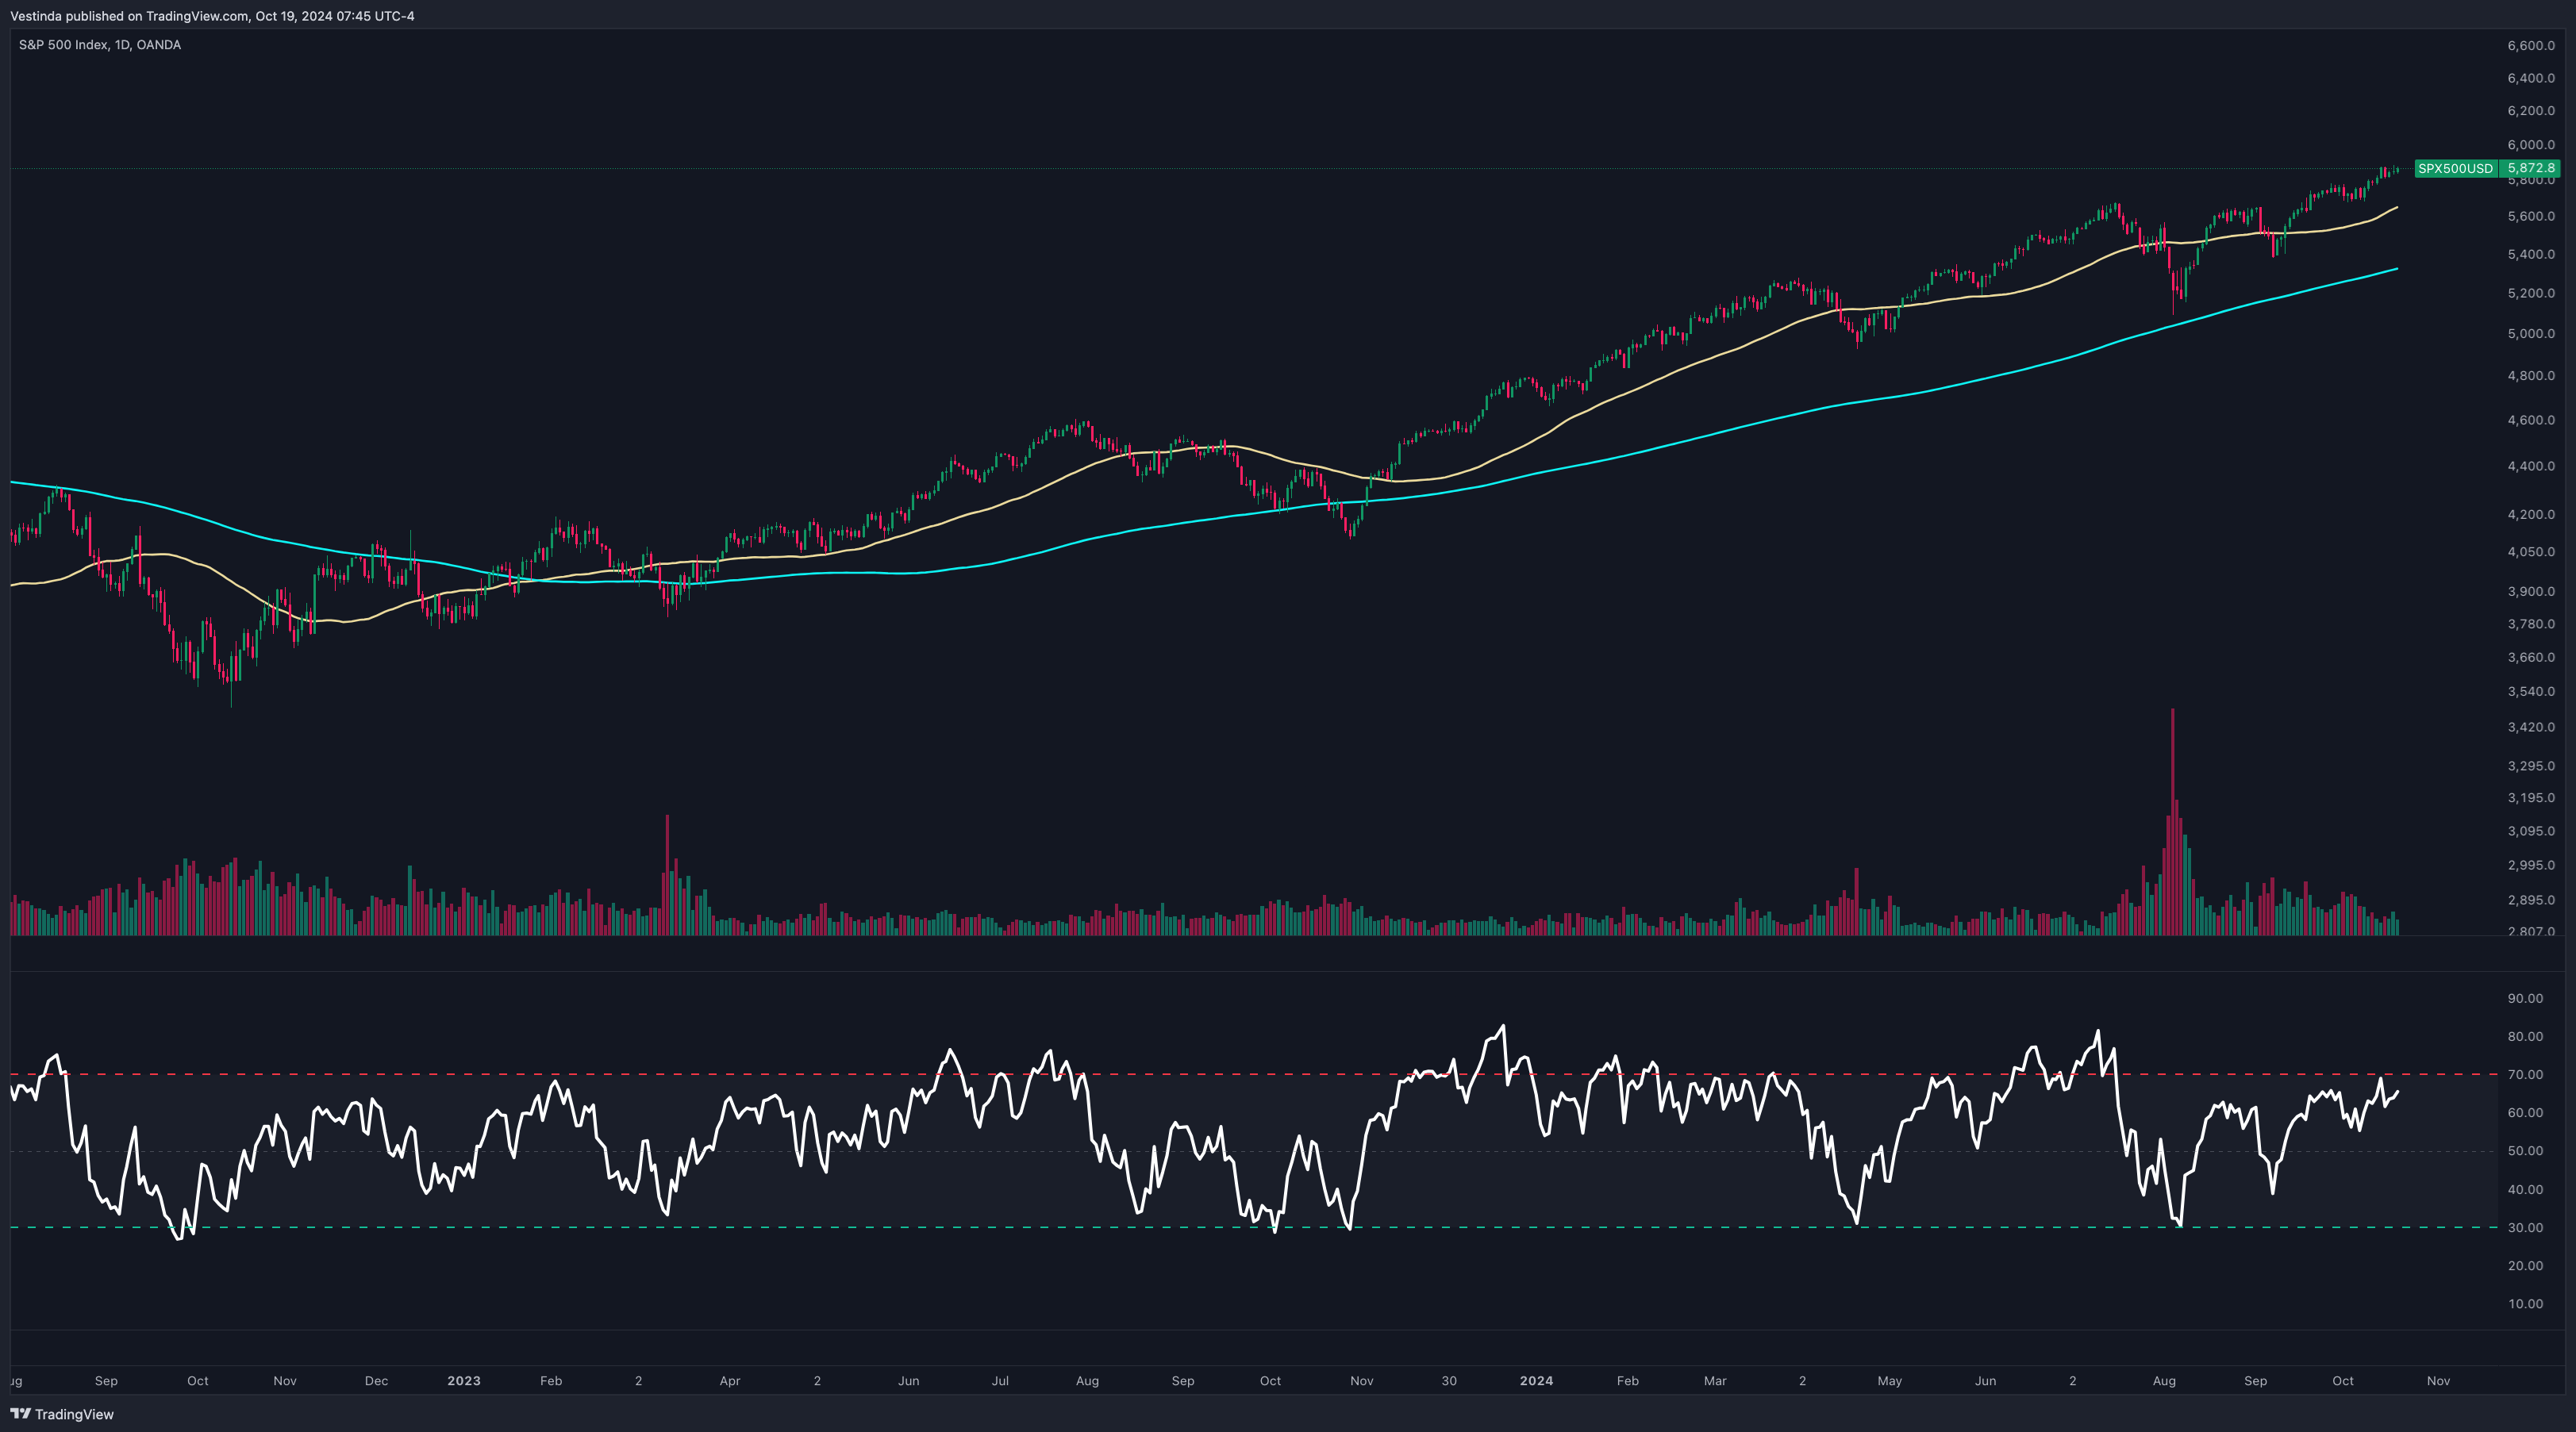
- Indicators: Use the 50-day and 200-day moving averages to detect crossovers (Golden Cross for bullish, Death Cross for bearish).
- Entry and Exit: Automate the process to buy when the 50-day MA crosses above the 200-day MA (Golden Cross) and sell when the 50-day MA crosses below the 200-day MA (Death Cross).
- Automation Tip: Program your trading bot to automatically detect crossovers and execute buy/sell orders based on these signals.
RSI (Relative Strength Index) for Long-Term Positioning
Concept: RSI is a momentum oscillator that measures the speed and change of price movements, useful for identifying overbought or oversold conditions.
Why It Works: RSI can help identify potential reversal points where the market may shift from overbought to oversold conditions, offering ideal long-term entry or exit points.
How to Implement:
- Indicators: Use RSI with a 14-period setting.
- Entry and Exit: Automate the strategy to buy when the RSI falls below 30 (oversold) and sell when RSI exceeds 70 (overbought).
- Automation Tip: Integrate the RSI with an automated trading system to open and close positions based on these signals.
Supertrend Indicator for Trend-Following
Concept: The Supertrend is a trend-following indicator that provides clear buy and sell signals based on the asset’s price direction and volatility.
Why It Works: The Supertrend excels in capturing long-term trends, reducing the noise of short-term fluctuations.
How to Implement:

- Indicators: Apply the Supertrend indicator with standard settings (ATR multiplier of 3).
- Entry and Exit: Automate your system to buy when the Supertrend turns green (bullish) and sell when it turns red (bearish).
- Automation Tip: Automate the Supertrend strategy to capture long-term trends with clear, rule-based entry and exit signals.
Risk Management for Long-Term SPX Investing:
Diversification:
Concept: While the S&P 500 is already diversified, investors can further spread risk by adding other asset classes like bonds or international equities to their portfolio.
How to Implement: Create a balanced portfolio that includes the S&P 500 alongside other investments to hedge against market downturns.
Rebalancing:
Concept: Rebalancing involves adjusting your portfolio to maintain your target asset allocation, ensuring that no single investment dominates your portfolio.
How to Implement: Regularly review and rebalance your portfolio, selling off assets that have grown beyond your target allocation and buying those that have underperformed.
Setting Investment Goals:
Concept: Define clear investment objectives, such as saving for retirement or generating passive income, to guide your long-term investment strategy.
How to Implement: Set realistic financial goals and adjust your S&P 500 investments based on your timeline and risk tolerance.
Tax-Efficient Strategies for Long-Term SPX Investors:
Use Tax-Advantaged Accounts:
Concept: Maximize tax-deferred growth by investing in the S&P 500 through accounts like IRAs or 401(k)s.
How to Implement: Contribute regularly to retirement accounts that offer tax advantages. Long-term growth in these accounts is not taxed until withdrawals are made.
Tax-Loss Harvesting:
Concept: Tax-loss harvesting involves selling losing investments to offset capital gains, reducing your tax burden.
How to Implement: If your S&P 500 investment has temporarily declined, consider selling part of your holdings to capture losses, then reinvest in similar assets to maintain exposure while reducing taxes.
Long-term investing in the S&P 500 remains a powerful way to build wealth over time. By incorporating automated strategies such as moving average crossovers, RSI signals, and the Supertrend indicator, investors can enhance their long-term portfolio performance. Combine these strategies with sound risk management and backtesting to optimize your long-term investment success.
Simplified SPX Backtesting Walkthrough
- Collect historical SPX data for the desired time period.
- Choose a backtesting platform or software that supports SPX backtesting.
- Import the collected SPX data into the backtesting software.
- Select the specific backtesting parameters, such as investment strategy and time frame.
- Run the backtest on the imported SPX data using the chosen parameters.
Backtesting the SPX allows you to evaluate the performance of investment strategies using historical data. By following these steps, you can efficiently backtest SPX and gain valuable insights for decision-making.
Assessing SPX Backtesting for Long-Term Investments
Evaluating Long-Term Investment Strategies with SPX Backtesting
Backtesting, using historical data, can assess the efficacy of long-term investment strategies concerning the S&P 500. This involves simulating trades based on specific rules from a chosen strategy and analyzing the results. By utilizing SPX backtesting, investors can evaluate the viability of their chosen strategies over time. During this procedure, historical data, including prices and dividends, is used to create a hypothetical portfolio. Various metrics, like annualized returns and drawdowns, are then calculated to gauge the performance of the strategy. Backtesting enables investors to identify potential flaws or weaknesses in their investment approach. It allows them to refine and optimize their strategies before committing capital, potentially improving long-term returns. When used appropriately, SPX backtesting can be a valuable tool in the evaluation of long-term investment strategies.
Analyzing SPX Strategy Performance Using Machine Learning
Evaluating the performance of SPX strategies has traditionally relied on statistical analysis. However, machine learning techniques offer a new way to assess strategy performance and make more accurate predictions. By training models on historical SPX data, machine learning algorithms can uncover patterns and relationships that are not easily detected by traditional methods. These algorithms can then be used to evaluate the performance of different strategies and provide insight into their risk and reward characteristics. By leveraging machine learning, investors can make more informed decisions and potentially improve their overall returns in the dynamic and complex SPX market.
Technical Analysis Integration for SPX Backtesting Success
Integrating technical analysis in SPX backtesting can enhance trading strategies and decision-making. By analyzing historical price patterns and indicators, traders can identify potential buying or selling signals. This information can be used to confirm or adjust entry and exit points, and manage risk. Technical analysis tools such as moving averages, trend lines, and oscillators can provide insights into market trends, volatility, and overbought/oversold conditions. These tools can also be used to identify support and resistance levels, helping traders to determine optimal entry and exit points. However, it is important to note that technical analysis is subjective and relies on past data, which may not accurately predict future price movements. Therefore, it's crucial to combine technical analysis with fundamental analysis and risk management techniques for more comprehensive backtesting.
Mitigating SPX Backtesting Data Quality Concerns
Addressing data quality issues in SPX backtesting is crucial for accurate results. The S&P 500, or SPX, is a widely followed index that represents the performance of 500 large companies listed on US stock exchanges. Thus, any inaccuracies in the data used for backtesting can significantly impact the validity of the results. It is important to ensure that the historical SPX data is free from errors, such as missing or incorrect values, and that it accurately reflects the intended time periods. Conducting thorough data validation and verification processes, cross-referencing with multiple reliable sources, and utilizing data cleaning techniques can help address these issues. Additionally, it is prudent to consider adjusting for any corporate actions, such as stock splits or dividends, that can affect SPX data. By ensuring data quality, one can have confidence in the reliability of the backtesting results and make better-informed investment decisions.
-
100,000 available assets New
-
years of historical data
-
practice without risking money

Frequently Asked Questions
To backtest a SPX strategy with social media sentiment, follow these steps:
1. Identify and access data sources that provide sentiment scores for social media mentions related to the SPX.
2. Collect historical sentiment data for a specific time period.
3. Combine sentiment data with historical SPX price data.
4. Define your trading strategy based on sentiment levels (e.g., buying when sentiment is positive, selling when sentiment is negative).
5. Simulate the strategy by applying it to historical data, calculating returns, and tracking performance.
6. Analyze the results to determine the efficacy of the sentiment-based strategy in relation to the SPX. Adjust and refine the strategy as necessary.
To backtest a SPX (S&P 500 Index) strategy using Monte Carlo simulations, follow these steps:
1. Define the strategy with specific rules and parameters, such as entry and exit points.
2. Collect historical price data for SPX.
3. Implement the strategy on the historical data and record the profitability.
4. Generate random scenarios using Monte Carlo simulations by randomly perturbing the historical data.
5. Apply the strategy to each simulated scenario and evaluate its performance.
6. Analyze the results to assess the strategy's potential profitability, risk, and robustness. Monte Carlo simulations help account for uncertainty and random market fluctuations, providing a more comprehensive analysis of the strategy.
No, it is not possible to trade on MT4 without a broker. MT4 (MetaTrader 4) is a popular trading platform that allows users to access various financial markets, but it requires a brokerage account to execute trades. The broker acts as an intermediary between the trader and the market, providing access to liquidity and placing trades on behalf of the user. Without a broker, it is not feasible to trade on MT4 or any other trading platform.
Creating a strategy in TradingView involves a few key steps. First, determine the trading approach and the indicators or patterns to be used. Next, specify the entry and exit rules, including stop-loss and take-profit levels. Backtest the strategy using historical data to evaluate its performance. Make necessary adjustments to optimize it. Consider the risk management plan by assigning appropriate position sizes and risk-reward ratios. Finally, implement the strategy in real-time by applying it to live market conditions. Regularly review and refine the strategy based on ongoing analysis and market dynamics.
To backtest an SPX strategy for high-frequency trading, follow these steps within a maximum of 100 words:
1. Obtain historical SPX data with high-frequency tick-level granularity.
2. Define your trading strategy, specifying entry/exit rules, stop-loss/profit targets, and position sizing.
3. Set up a backtesting platform or use programming languages like Python, R, or MATLAB.
4. Implement your strategy using the historical SPX data.
5. Simulate trades based on the defined rules and evaluate performance metrics such as returns, drawdowns, win/loss ratio, and frequency of trades.
6. Optimize the strategy parameters using different combinations to increase profitability.
7. Validate the strategy using out-of-sample data or other statistical tests.
8. Adjust and fine-tune the strategy as needed, considering transaction costs and realistic constraints.
Conclusion
In conclusion, SPX backtesting is a powerful tool for investors looking to test the effectiveness of their investment strategies. By simulating trades using historical data, investors can analyze the performance of SPX indices and individual stocks, evaluate potential returns and risks, and make data-driven decisions. Whether you're a seasoned trader or a novice investor, SPX backtesting provides valuable insights to inform your investment strategies and improve long-term returns. Integrating technical analysis and addressing data quality issues are important considerations to enhance the accuracy and effectiveness of SPX backtesting. Additionally, the application of machine learning techniques can further enhance strategy evaluation and prediction accuracy in the dynamic SPX market.

Successful traders rely on backtesting to be profitable.
Be like them with our
Free Backtesting Guide