
-
100,000 available assets New
-
years of historical data
-
practice without risking money

Quant Strategies & Backtesting results for SPX
Here are some SPX trading strategies along with their past performance. You can validate these strategies (and many more) for free on Vestinda across thousands of assets and many years of historical data.
Quant Trading Strategy: Downtrend Scalping with Keltner Channel and True Range on SPX
Based on the backtesting results statistics for the trading strategy conducted from November 20, 2022, to November 20, 2023, it is evident that the strategy did not yield favorable outcomes. The profit factor achieved was 0.98, indicating a deficiency in generating profits compared to losses. The annualized return on investment (ROI) amounted to -0.61%, signifying a negative performance for the strategy over the given timeframe. On average, trades were held for approximately 4 days and 17 hours, while the strategy produced an average of 1.26 trades per week. Out of a total of 66 closed trades, only 36.36% were profitable. Overall, the results exhibit subpar performance, highlighting the need for potential refinements or alternative strategies.
 SPX
SPX

Choose another period and try again.
Quant Trading Strategy: Buy with Smart Money Demand with SL on SPX
During the backtesting period from October 20, 2023, to November 20, 2023, the trading strategy yielded a disappointing annualized return on investment (ROI) of -3.29%. On average, the strategy held positions for approximately 3 days before closing them. Interestingly, there were only 0.22 trades per week, indicating a relatively low level of activity. Throughout this period, only 1 trade was successfully closed. Unfortunately, the return on investment for this trade amounted to -0.28%. Additionally, the strategy did not achieve any winning trades, resulting in a winning trades percentage of 0%. These statistics highlight the challenges faced by the strategy during this specified timeframe, emphasising the need for adjustments or alternative approaches.
SPX
Choose another period and try again.
Mastering Swing Trading: Achieving Profitability in SPX
Introduction
The S&P 500 Index (SPX) is a widely recognized benchmark of the U.S. stock market, comprising 500 of the largest publicly traded companies. For traders looking to capitalize on medium-term price movements, swing trading SPX can be a highly effective strategy. In this guide, we’ll explore how to master swing trading with SPX, providing key strategies, tools, and tips to help you achieve consistent profitability.
Why Swing Trade SPX?
- High Liquidity: SPX is one of the most liquid indices, ensuring tight bid-ask spreads and quick order execution.
- Market Representation: SPX offers exposure to a broad range of sectors, providing a diversified trading instrument that reflects overall market conditions.
- Consistent Performance: The S&P 500’s historical performance and trend stability make it a reliable asset for swing trading.
Key Swing Trading Strategies for SPX
Trend Following
Concept: Capture profits by trading in the direction of the prevailing trend.

How to Implement:
- Indicators: Use moving averages (e.g., 50-day and 200-day) to identify the direction of the trend.
- Entry and Exit: Enter long positions when SPX is in an uptrend, confirmed by the price staying above key moving averages. Exit when the trend shows signs of reversal, such as a moving average crossover.
Breakout Trading
Concept: Trade the breakout of key support or resistance levels to capture strong price movements.
How to Implement:
- Chart Patterns: Look for consolidation patterns like triangles, rectangles, or wedges that indicate a potential breakout.
- Volume Confirmation: Ensure the breakout is accompanied by strong volume, signaling a high probability of continuation.
- Entry and Exit: Enter the trade as soon as the price breaks out of the pattern, setting a stop-loss just below the breakout level to manage risk. Exit when the price reaches a significant resistance or support level.
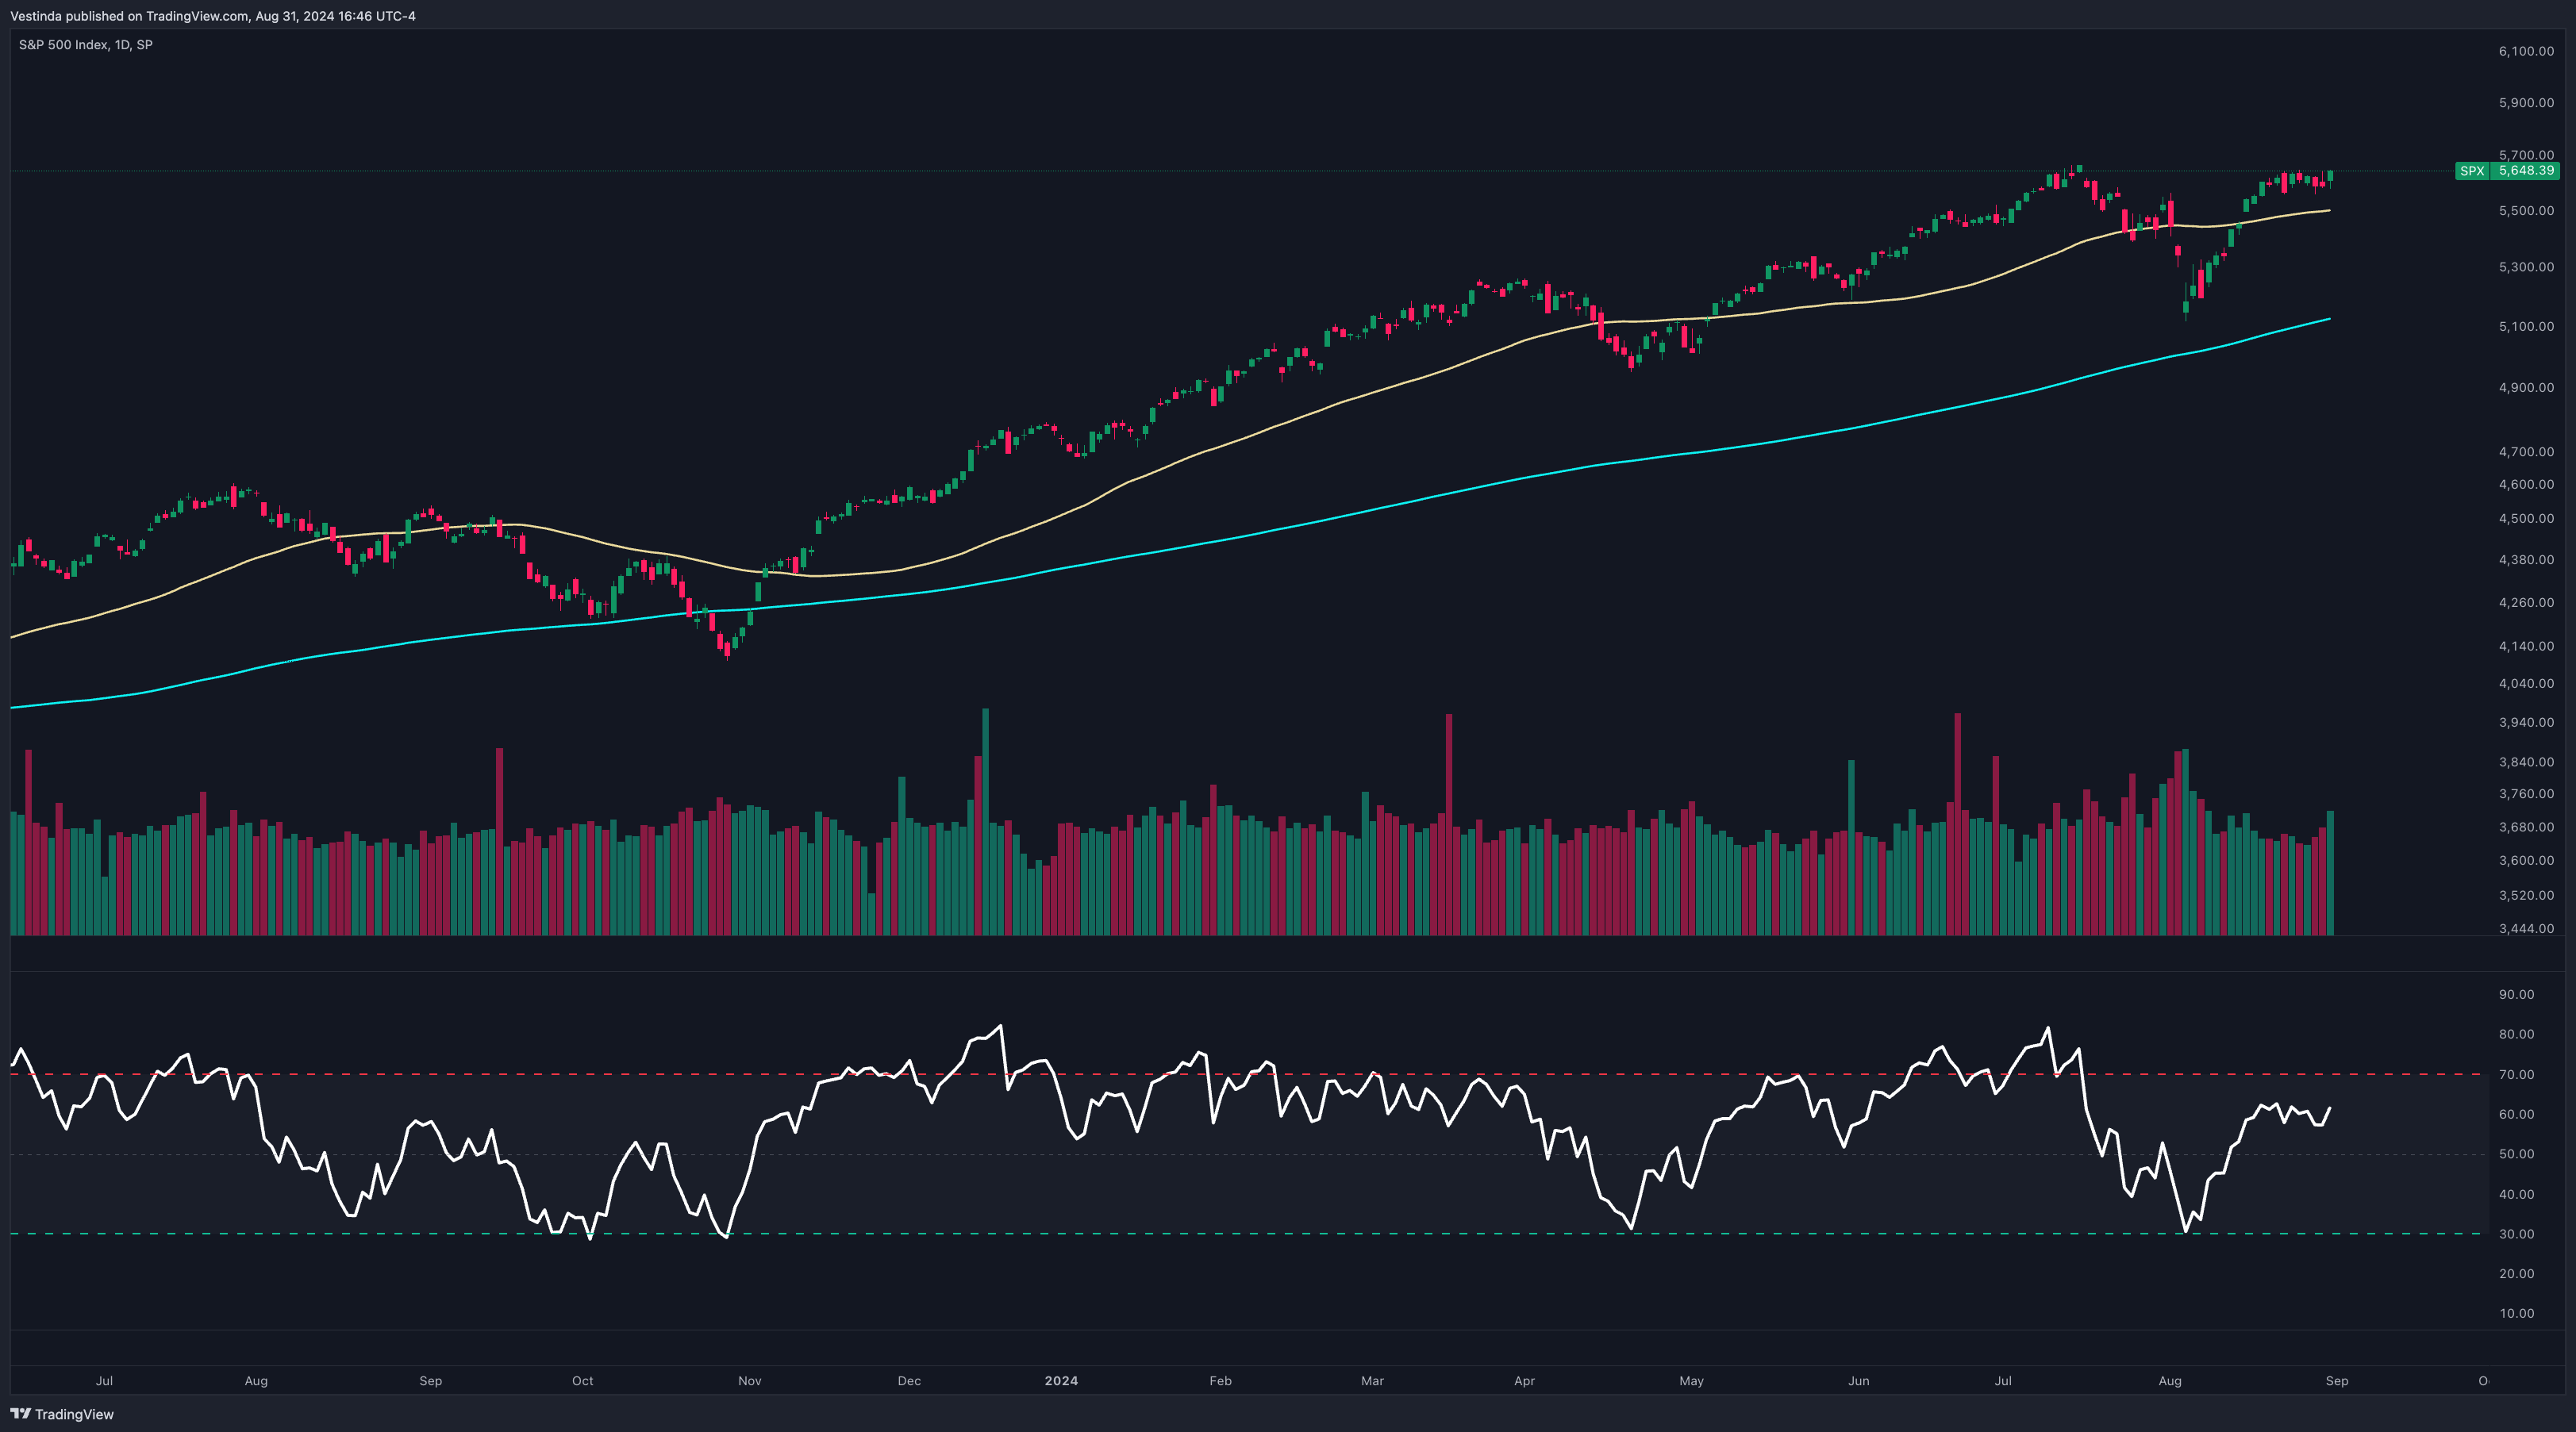
Swing Trading with RSI
Concept: Use the Relative Strength Index (RSI) to identify overbought or oversold conditions and anticipate potential reversals.
How to Implement:
- RSI Levels: Monitor RSI levels for overbought (above 70) or oversold (below 30) conditions.
- Entry and Exit: Enter long positions when RSI indicates oversold conditions and exit when RSI approaches overbought levels. For short positions, enter when RSI indicates overbought conditions and exit when RSI approaches oversold levels.
Fibonacci Retracement Strategy
Concept: Use Fibonacci retracement levels to identify potential entry points during pullbacks within a larger trend.
How to Implement:
- Fibonacci Levels: Plot Fibonacci retracement levels (e.g., 38.2%, 50%, 61.8%) on a recent price swing. These levels often act as support or resistance during pullbacks.
- Combining with Moving Averages: Use moving averages to confirm entry points when the price retraces to a Fibonacci level.
- Entry and Exit: Enter trades at or near the Fibonacci levels with a stop-loss just below the level. Exit the trade as the price approaches the previous high (in an uptrend) or low (in a downtrend).
Tools and Indicators for Successful SPX Swing Trading
Moving Averages
Why: Moving averages smooth out price data, helping you identify trends and potential entry/exit points.
How to Use: Apply the 50-day and 200-day moving averages to identify trend direction on longer timeframes. Use shorter moving averages (e.g., 9-day and 21-day) for more precise entries and exits.
Bollinger Bands
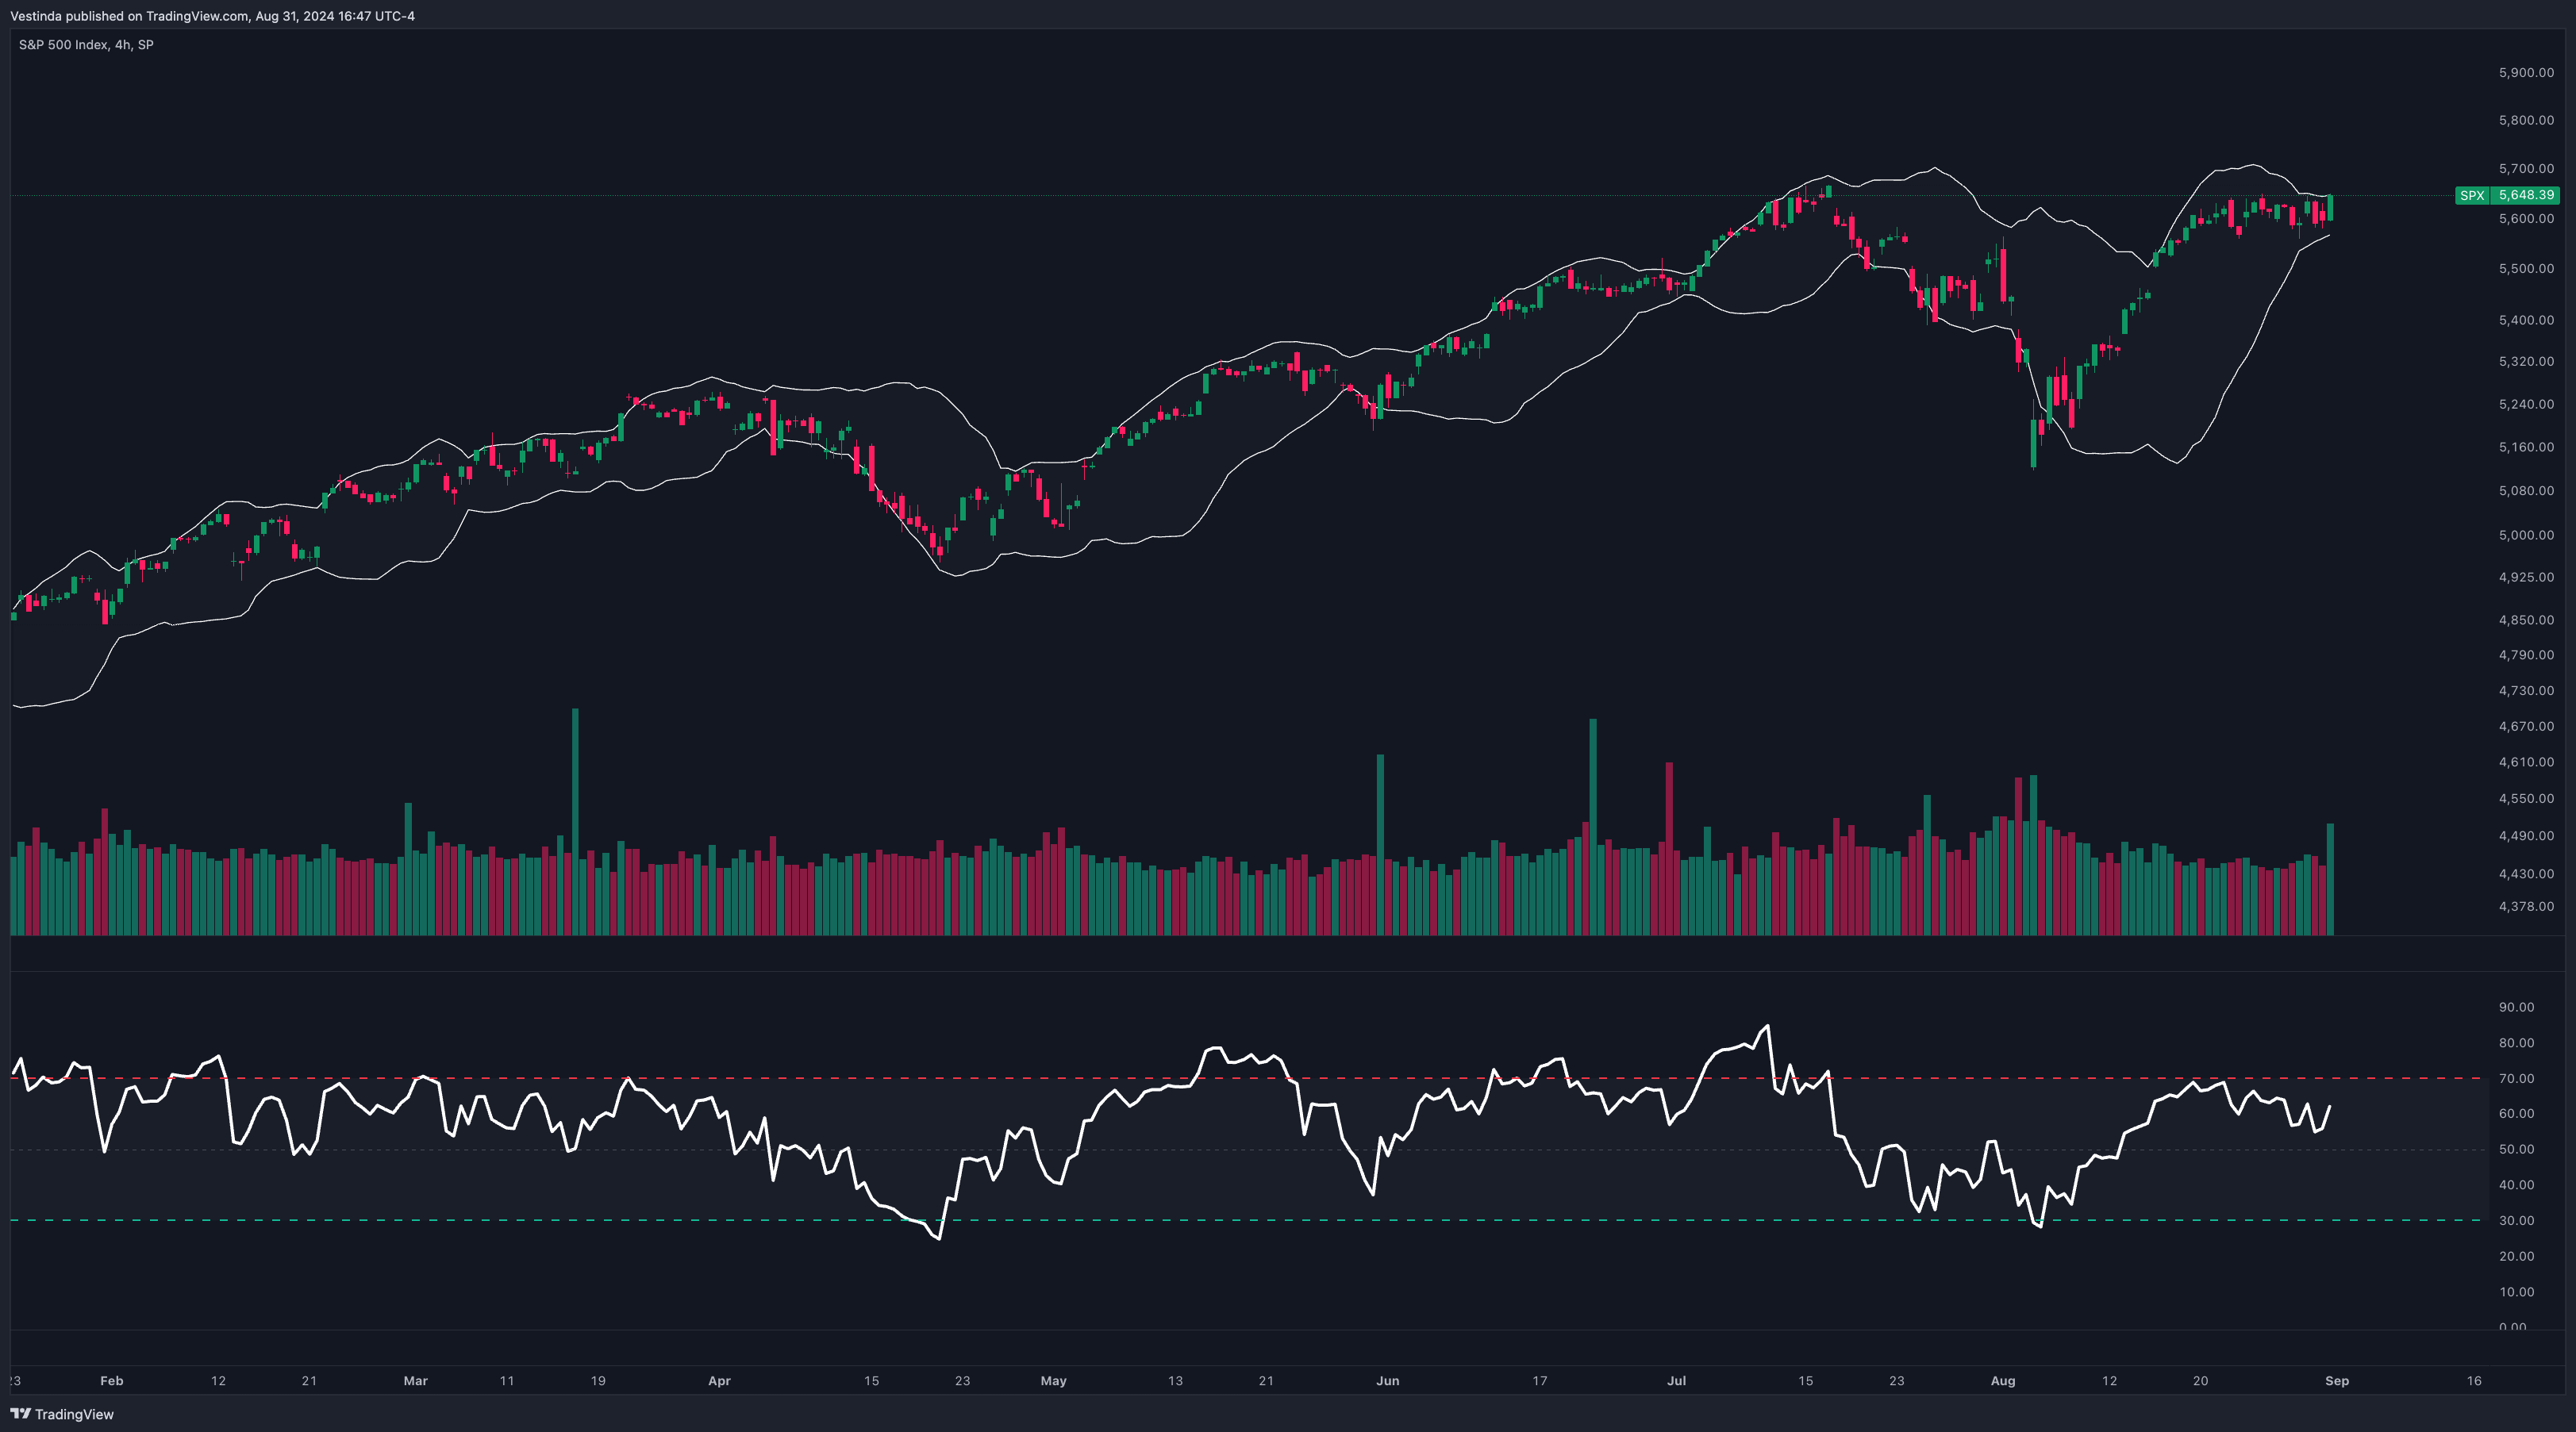
Why: Bollinger Bands help identify overbought and oversold conditions, providing entry points during periods of high volatility.
How to Use: Enter trades when the price touches the lower band in an uptrend or the upper band in a downtrend. Exit when the price moves back toward the middle band.
RSI (Relative Strength Index)
Why: RSI measures the magnitude of recent price changes to evaluate overbought or oversold conditions.
How to Use: Look for RSI levels below 30 (oversold) for potential buying opportunities, and above 70 (overbought) for potential selling opportunities.
Risk Management for SPX Swing Trading
Position Sizing
Concept: Determine the size of each trade based on your overall risk tolerance and the distance to your stop-loss level.
How to Implement: Use a percentage of your trading capital (e.g., 1-2%) for each trade, ensuring that losses are kept within manageable limits.
Stop-Loss Orders
Concept: Use stop-loss orders to protect your capital and limit potential losses.
How to Implement: Set stop-loss levels below key support levels (for long positions) or above resistance levels (for short positions) to automatically exit trades that move against you.
Take-Profit Orders
Concept: Set take-profit levels to lock in gains when the price reaches a predetermined target.
How to Implement: Place take-profit orders at significant resistance levels in an uptrend or support levels in a downtrend to secure profits before the price reverses.
Tips for Mastering SPX Swing Trading
Focus on Key Market Hours
Why: The first and last hours of the trading day often provide the most liquidity and volatility, offering the best opportunities for swing traders.
How to Implement: Concentrate your trading efforts during these peak hours to capture the most significant price movements.
Stay Informed
Why: News, economic indicators, and earnings reports can significantly impact the S&P 500 and, by extension, SPX. Staying informed allows you to anticipate market moves.
How to Implement: Monitor news sources, economic reports, and earnings announcements that may affect the broader market and SPX.
Avoid Emotional Trading
Why: Emotional decisions can lead to poor trades and increased risk. Sticking to your strategy helps maintain discipline.
How to Implement: Use a trading plan with predefined entry, exit, and risk management rules. Automate your strategy where possible to minimize emotional interference.
Swing Trading Strategies for the SPX
There are several types of swing trading strategies that traders can use to take advantage of short-term market movements. One popular type is trend-following swing trading, where traders identify and follow the overall trending direction of a particular stock or index, such as the SPX. This strategy involves entering a trade when the stock is in an uptrend or downtrend and then exiting before the trend reverses.
Another type is mean reversion swing trading, where traders take advantage of temporary price deviations from the stock's average price. This strategy involves buying when the stock is oversold and selling when it is overbought, betting on the price returning to its average.
Additionally, breakout swing trading involves identifying key levels of support or resistance and entering a trade when the price breaks out of these levels. This strategy aims to profit from significant price moves after the breakout occurs.
Overall, the type of swing trading strategy a trader chooses depends on their risk appetite and trading style.
S&P 500 Analysis using Bollinger Bands
One popular technical analysis tool is the Bollinger Bands method. Developed by John Bollinger, this method is used to analyze price volatility. Bollinger Bands consist of three lines – the upper band, the lower band, and the middle band. The middle band is a simple moving average, usually set at 20 periods. The upper and lower bands are set at two standard deviations away from the middle band. When the market is volatile, the bands expand, and during periods of low volatility, the bands contract. Traders use Bollinger Bands to identify potential buying or selling opportunities. For example, when the price touches the lower band, it may suggest that the asset is oversold and could be a buy signal. On the other hand, when the price reaches the upper band, it may indicate that the asset is overbought and a potential sell signal. Analysts commonly use Bollinger Bands to accompany other technical indicators for more accurate predictions. For instance, some traders combine Bollinger Bands with the Relative Strength Index (RSI). Overall, the Bollinger Bands method is a versatile and effective tool for analyzing price volatility and identifying potential trading opportunities.
Profit Maximization Strategies: Unlocking the SPX Potential
Taking Profits
When it comes to the stock market, one of the most important strategies for long-term success is knowing when to take profits. Timing is crucial in ensuring that you maximize your gains and avoid potential losses. As the SPX reaches new highs, it may be tempting to hold onto your winning positions in the hopes of even greater returns. However, it's essential to regularly assess your investments and consider taking profits when necessary. By regularly reviewing your portfolio and setting profit targets, you can ensure that you lock in your gains and protect yourself against market downturns. Remember, it's better to take profits while you can than to regret not doing so later. So, be proactive and make informed decisions to secure your financial future.
Swing Trading Tools: Oscillators & Indicators (SPX Analysis)
Oscillators and indicators are vital tools for swing traders. These tools help them identify potential entry and exit points during market swings. The SPX RSI (Relative Strength Index), for example, is a popular oscillator used by swing traders. It measures the speed and change of price movements. Additionally, the MACD (Moving Average Convergence Divergence) is another commonly used indicator. It shows the relationship between two moving averages and can help traders identify trend reversals. However, it's important to note that no single oscillator or indicator is foolproof. Traders should use a combination of tools and analyze them in conjunction with other market factors to make informed trading decisions.
Sophisticated backtesting is not only possession of high-esteemed hedge funds anymore.
Impressive Team and support, Backtesting engine with detailed reports, The Strategy builder.

Great purchase!
I have always manually invested in stocks and cryptocurrencies, but after studying Vestinda, I must say it has enormous potential.

Mature platform for trading
Pro: Easy to use, Nice UX, A lot of customization for strategies, Back testing is an awesome tool, can check any strategy in history.

Frequently Asked Questions
Swing trading can be considered riskier than other trading strategies due to its shorter time frame and the potential for increased volatility. As swing traders take advantage of price swings within a trend, they face the risk of sudden market reversals or unexpected news events. Additionally, swing traders typically use leverage, adding another level of risk. However, like any form of trading, risk management techniques, thorough research, and disciplined decision-making can help mitigate some of these risks. Successful swing traders focus on identifying favorable risk-reward opportunities, employing stop-loss orders, and adhering to a well-defined trading plan to minimize potential downsides.
Yes, it is possible to lose money in swing trading. Swing trading involves holding stocks for a short period of time, typically from a few days to a few weeks, to capture short-term price movements. These price fluctuations can occasionally result in losses if the trade does not go as expected. Additionally, swing trading requires a thorough understanding of technical analysis and market trends, and any miscalculations or poor judgments can lead to financial losses. Traders must practice risk management strategies, set stop-loss orders, and do thorough research to minimize the chances of losing money in swing trading.
To use moving averages in SPX swing trading, you can employ two popular ones: the 50-day and 200-day moving averages (MA). When the 50-day MA crosses above the 200-day MA, it generates a bullish signal indicating a potential uptrend, suggesting a buy. Conversely, when the 50-day MA crosses below the 200-day MA, a bearish signal arises, indicating a possible downtrend, suggesting a sell. These moving averages act as dynamic support or resistance levels and help identify key trend reversals. It is important to combine this strategy with other technical indicators and risk management techniques for a comprehensive swing trading approach in the SPX.
The choice between swing trading and day trading ultimately depends on an individual's trading style, preferences, and goals. Swing trading involves holding positions for days or weeks, taking advantage of short-term price fluctuations. It requires less intensive monitoring and allows traders to capture larger moves. On the other hand, day trading involves making multiple trades within a day, profiting from intraday price movements. It requires constant attention and quick decision-making. Both approaches have their merits, and the better choice depends on factors such as time commitment, risk tolerance, and desired profit targets.
Conclusion
In conclusion, swing trading is a popular strategy for navigating the SPX market and capitalizing on short-term fluctuations in stock prices. By gaining a solid understanding of swing trading principles and strategies, studying historical price charts, and using technical analysis indicators, traders can identify and execute profitable trades. Consistency, discipline, and continuous learning are key to success in swing trading. There are different types of swing trading strategies to choose from, depending on risk appetite and trading style. Tools such as Bollinger Bands, Relative Strength Index (RSI), and Moving Average Convergence Divergence (MACD) can help traders identify entry and exit points. Lastly, knowing when to take profits and regularly reviewing portfolio performance is crucial for long-term success in swing trading.

Successful traders rely on backtesting to be profitable.
Be like them with our
Free Backtesting Guide