
-
 Create
account -
 Build trading strategies
with no code -
 Validate
& Backtest -
 Automate
& start earning
Quantitative Strategies & Backtesting results for SOL
Here are some SOL trading strategies along with their past performance. You can validate these strategies (and many more) for free on Vestinda across thousands of assets and many years of historical data.
Quantitative Trading Strategy: Lock and keep profits on SOL
The backtesting results for the trading strategy conducted from February 26, 2021, to October 22, 2023, exhibit promising statistics. The strategy achieved a profit factor of 1.9, indicating that overall profits outweighed losses. The annualized return on investment (ROI) stood at an impressive 287.56%, affirming the strategy's profitability. On average, trades were held for six weeks and five days, indicating a medium-term approach. The strategy recorded an average of 0.05 trades per week over the given period, denoting a relatively low frequency. With a total of 8 closed trades, the strategy maintained a 50% success rate. Moreover, it outperformed the buy and hold approach, generating excess returns of 289.05%. These results suggest the trading strategy's efficacy and potential for generating substantial profits.

 SOLUSDT

Choose another period and try again.
Quantitative Trading Strategy: Follow the trend on SOL
According to the backtesting results statistics for the trading strategy, the period from November 18, 2020 to December 8, 2023 showed promising outcomes. The strategy exhibited a profit factor of 2.04, indicating a favorable return on investment. The annualized ROI stood at an impressive 949.03%, highlighting the potential for substantial gains over the long term. On average, the holding time for trades amounted to one week, reflecting a relatively short-term approach. The strategy executed an average of 0.37 trades per week, suggesting a moderate level of activity. With 60 closed trades, the system demonstrated a respectable level of participation. The return on investment reached an astonishing 2875.84%, showcasing the strategy's ability to generate exceptional profits. Notably, the winning trades percentage stood at 31.67%, underscoring the importance of risk management and further potential for improvement.
SOLUSDT
Choose another period and try again.
SOL (Solana) Chart Patterns: Mastering Trading Patterns
Introduction
Chart patterns are essential tools for traders, offering visual insights into market behavior and potential price movements. For Solana (SOL), a leading cryptocurrency with active trading volumes, mastering these patterns can help traders anticipate trends and make informed decisions. This guide delves into key SOL chart patterns, actionable strategies, and analysis tips to enhance your trading success.
Why Use Chart Patterns for SOL Trading?
- Reliable Signals: Patterns provide consistent visual cues for trend reversals and continuations.
- Applicable Across Timeframes: Useful for both short-term scalping and long-term investing.
- Easy Integration: Combine chart patterns with indicators for stronger confirmation.
Key SOL Chart Patterns to Master
1. Bullish Patterns
1. Ascending Triangle
Description: A pattern with a horizontal resistance line and ascending support line.
What It Indicates: A potential breakout above resistance.

Trading Strategy:
- Enter long when SOL breaks above resistance with increased volume.
- Place a stop-loss below the ascending trendline.
2. Double Bottom
Description: Two distinct lows at approximately the same price level, forming a "W" shape.
What It Indicates: A potential reversal from a downtrend to an uptrend.
Trading Strategy:
- Enter long after SOL closes above the neckline.
- Set a stop-loss below the second bottom.
2. Bearish Patterns
1. Head and Shoulders
Description: A peak (head) between two smaller peaks (shoulders), signaling a reversal.
What It Indicates: A potential trend reversal from bullish to bearish.

Trading Strategy:
- Short SOL when it breaks below the neckline.
- Place a stop-loss above the right shoulder.
2. Descending Triangle
Description: A horizontal support line and descending resistance line.
What It Indicates: A potential breakdown below support.
Trading Strategy:
- Enter short after SOL breaks below support with strong volume.
- Set a stop-loss above the descending trendline.
Advanced Pattern Strategies for SOL
1. Symmetrical Triangle for Breakouts
How It Works: Trade SOL as it breaks out of the converging trendlines.
Tip: Confirm the breakout direction with volume spikes.
2. Cup and Handle for Trend Continuation
How It Works: Identify a rounded bottom (cup) followed by a small consolidation (handle).
Tip: Enter long after SOL breaks above the handle with strong momentum.
3. Flags and Pennants for Momentum Trading
How It Works: Trade within the consolidation (flag or pennant) and enter in the breakout direction.
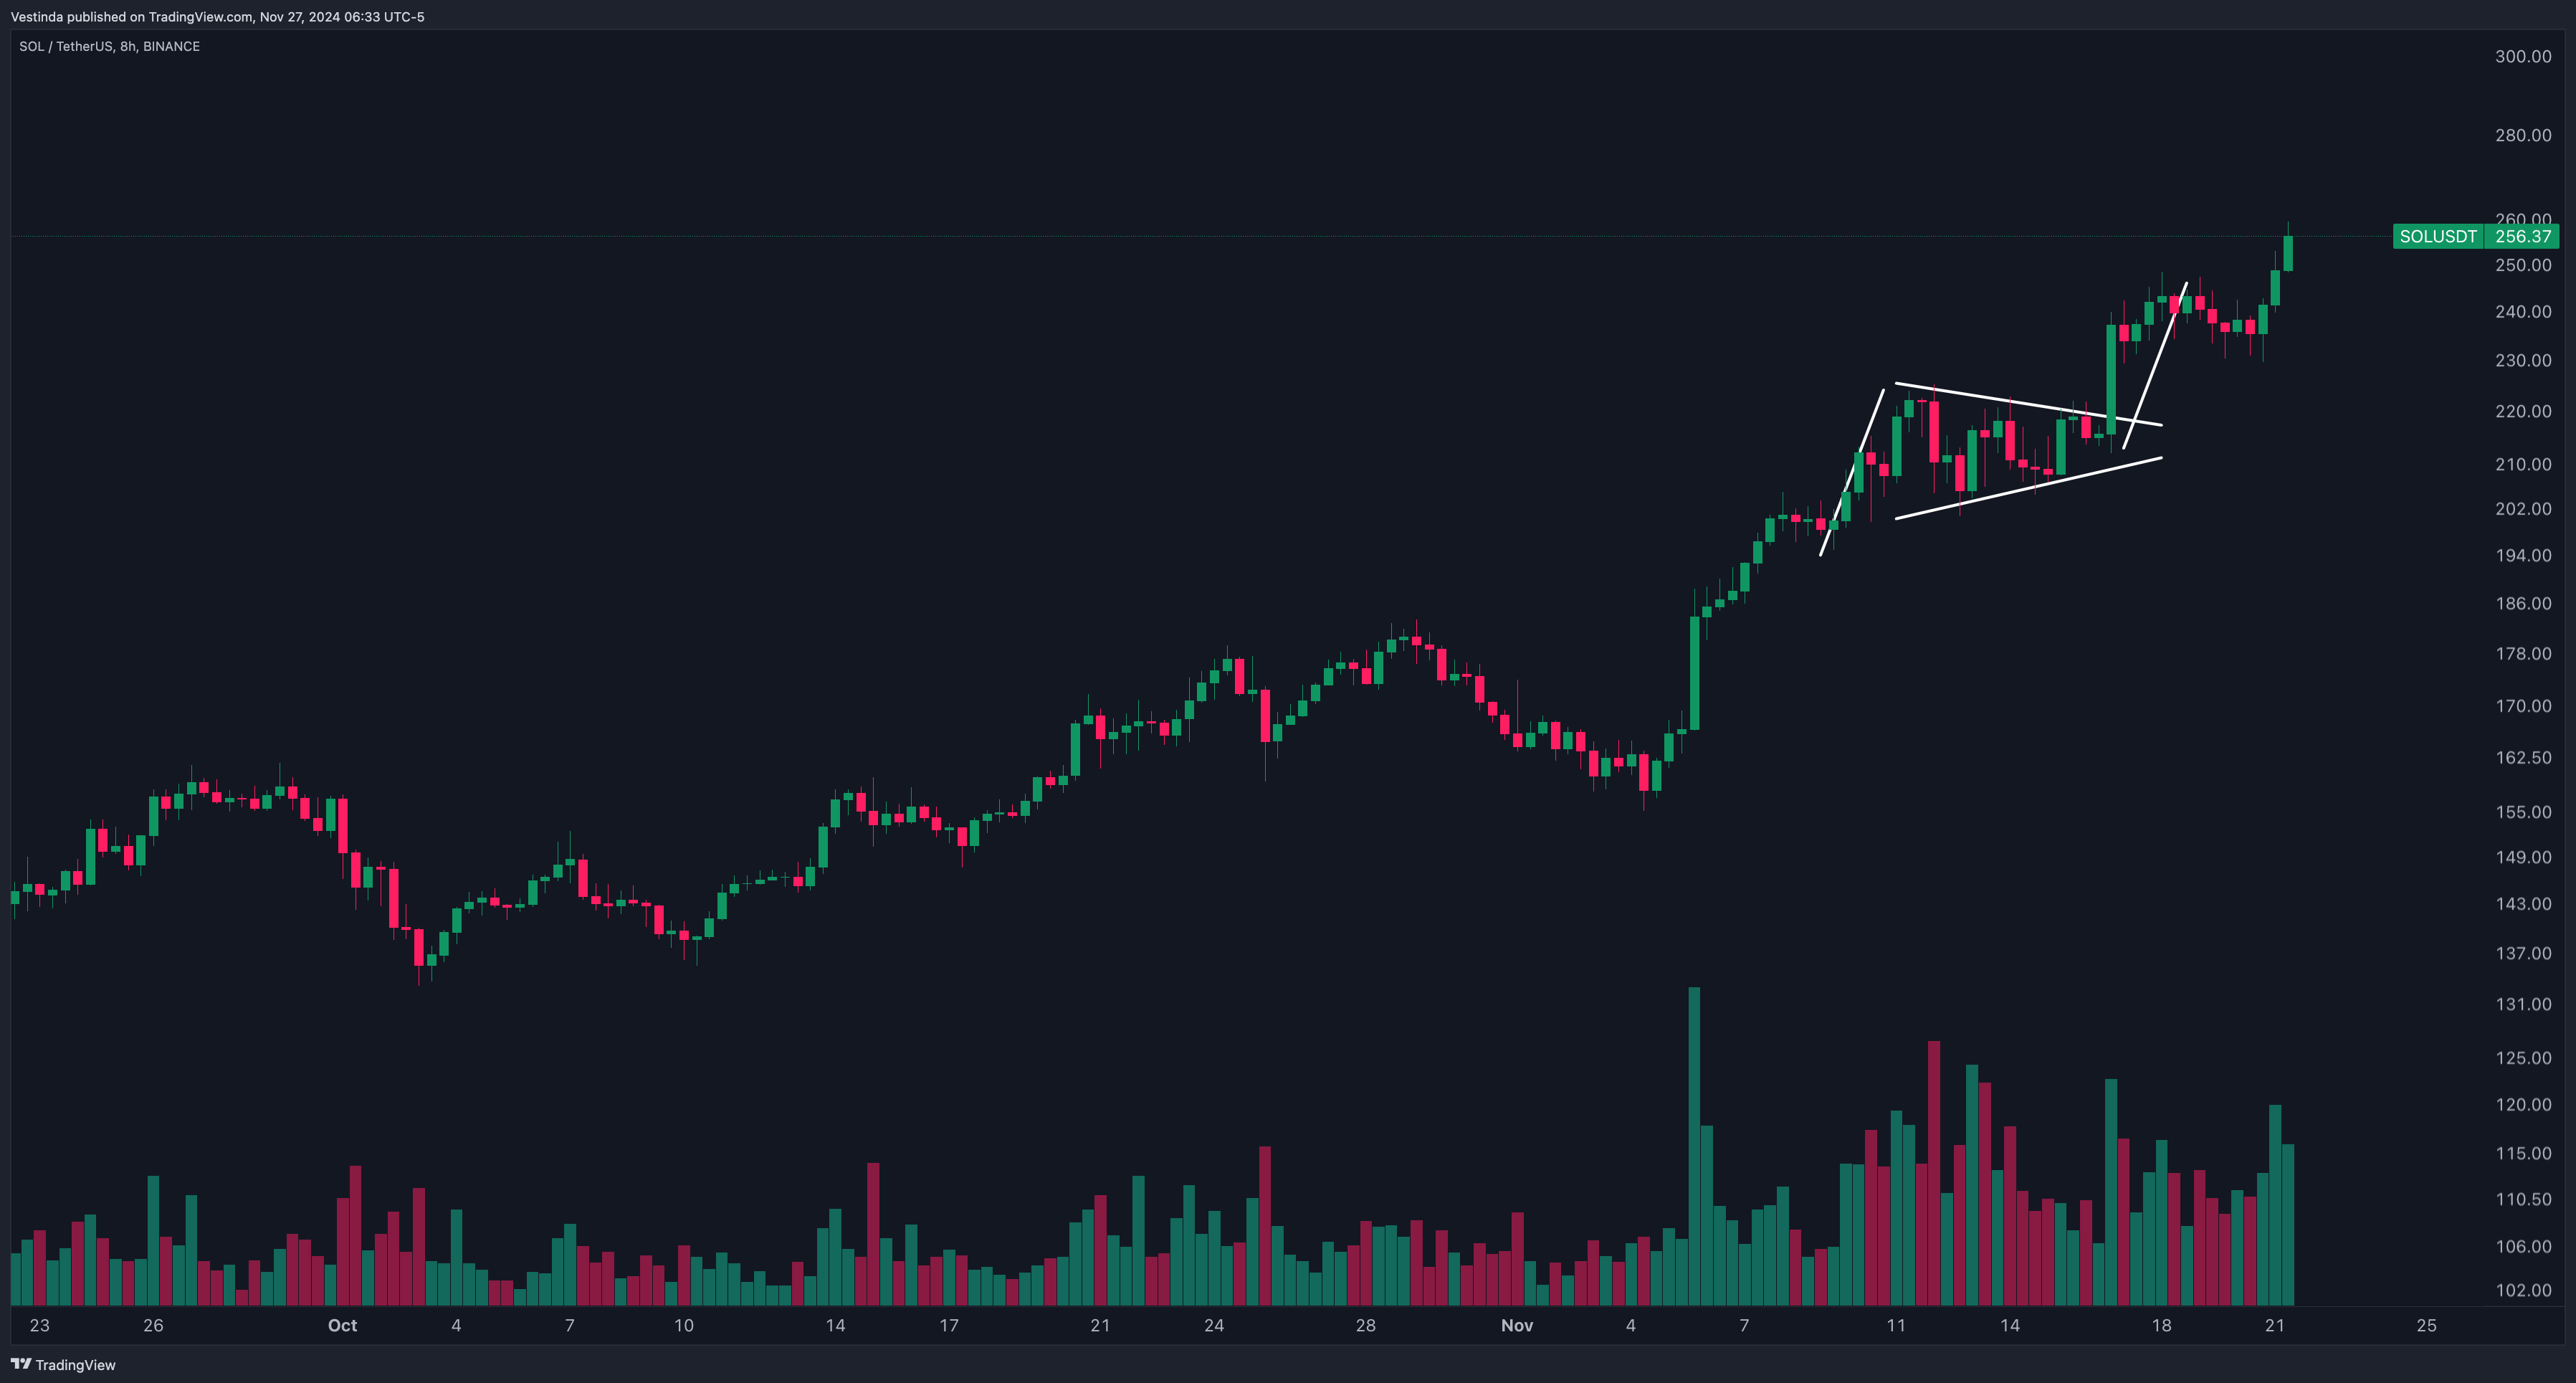
Tip: Use short timeframes for precise entries and exits.
Combining Chart Patterns with Indicators
1. RSI for Confirmation
Use RSI to confirm overbought or oversold conditions when trading reversal patterns.
Example: Combine RSI with a double bottom to validate an upward reversal.
2. MACD for Momentum Analysis
Use MACD crossovers to confirm trend direction in continuation patterns.
Example: Combine MACD with an ascending triangle breakout.
3. Volume Analysis for Validity
Monitor volume to ensure breakout patterns are supported by strong trading activity.
Practical Tips for Trading SOL Chart Patterns
- Use Multiple Timeframes: Validate patterns on longer timeframes and fine-tune entries on shorter ones.
- Combine with Support and Resistance: Look for patterns near key levels for higher accuracy.
- Avoid Overtrading: Focus on quality setups with clear breakout or reversal signals.
Backtesting SOL Chart Patterns
Why Backtest? Evaluate the effectiveness of patterns on historical SOL data.
Tools to Use:
- TradingView for manual pattern identification.
- Automated backtesting tools for analyzing performance metrics.
Conclusion
Mastering chart patterns is an invaluable skill for trading Solana (SOL). By recognizing key patterns like triangles, double bottoms, and head-and-shoulders, and combining them with indicators and volume analysis, traders can make well-informed decisions. Regular backtesting and disciplined execution ensure consistent success in Solana’s dynamic market.
Solana's Chart Patterns: Trading Insights in Focus
- Identify a bullish or bearish chart pattern on the SOL price chart.
- Confirm the pattern by analyzing the price action and volume.
- Understand the potential implications of the pattern for future price movement.
- Set entry and exit points based on the pattern and risk management principles.
- Place a trade in accordance with the identified pattern and set stop-loss levels.
- Monitor the trade and adjust stop-loss levels as necessary.
- Consider taking partial profits or trailing stop-loss levels to maximize gains.
Chart Anomalies: Uncovering Gaps in SOL's Price
Gaps in SOL Price Charts are a common phenomenon. These gaps occur when the price of SOL opens higher or lower than the previous day's closing price, resulting in a visible gap on the price chart. Gaps can happen due to various reasons, such as news announcements, market sentiment shifts, or overnight trading. Traders often pay attention to these gaps as they can provide valuable insights into price momentum and potential future trends. It is important to note that not all gaps in the price chart need to be filled. However, unfilled gaps may indicate strong price momentum, while filled gaps may suggest a potential reversal or consolidation. Traders use technical analysis tools, such as support and resistance levels, to assess the significance of these gaps and make informed trading decisions. Understanding gaps in SOL price charts can enhance a trader's ability to identify potential trading opportunities and manage risk effectively.
SOL Trading: Harnessing Technical Insights
Technical analysis is crucial in SOL trading as it helps traders make informed decisions. By analyzing historical price data, indicators, and patterns, traders can identify potential entry and exit points. Diving deeper into price charts allows traders to spot trends, support and resistance levels, and momentum shifts. This information enables them to predict future price movement and manage risk effectively. Additionally, technical analysis provides valuable insights into market sentiment, helping traders gauge market psychology and sentiment. It helps traders understand if a particular asset is overbought or oversold, allowing them to adjust their trading strategies accordingly. Without technical analysis, traders would be relying purely on luck or gut feelings, which is highly risky in the volatile world of cryptocurrency trading. Overall, technical analysis is an indispensable tool for SOL traders, providing them with a systematic and disciplined approach to decision-making.
SOL Wedge Patterns: Ascending & Descending Wedges
Wedge patterns are common in financial markets and widely used in technical analysis. A rising wedge is a bearish pattern characterized by a contracting price range, with higher highs and higher lows. Traders often interpret this as a sign of weakening momentum and a potential trend reversal. In contrast, a falling wedge is a bullish pattern with a contracting price range, featuring lower highs and lower lows. Traders may see this as a sign of impending bullish momentum and a possible trend reversal. Both wedge patterns can provide valuable insights for traders seeking to make informed decisions in the market. As SOL continues to gain popularity, identifying and analyzing these patterns can be helpful in optimizing trading strategies.
SOL Chart Patterns: Short-Term Trading Strategies
Chart patterns can be valuable tools for short-term SOL trading strategies. These patterns represent recognizable formations on price charts that indicate a potential future direction of price movement. By studying chart patterns, traders can gain insights into market sentiment and make informed decisions about when to enter or exit a trade. Some common chart patterns include triangles, head and shoulders, and double tops or bottoms. Traders can use these patterns to identify trend reversals or continuation patterns, allowing them to take advantage of potential profit opportunities. It is important to note that chart patterns should not be used as standalone indicators but should be combined with other technical analysis tools to confirm trading signals. Overall, understanding chart patterns can help traders develop successful short-term SOL trading strategies.
-
Track your
Crypto Portfolio -
Copy Crypto trading
strategies -
Build trading strategies
with no code
-
Backtest trading strategies
on Crypto, Forex, Stocks, etc. -
Demo Trading
Risk-free Paper Trading -
Automate trading strategies
with Live Trading
Frequently Asked Questions
The W symbol in trading is typically used to represent a specific pattern called a double bottom. This pattern occurs when a stock's price reaches a low point, bounces back up, forms a W-like shape, and then falls again, before ultimately reversing and beginning an uptrend. Traders often see this pattern as a bullish signal, suggesting that the stock is likely to continue its upward movement. It is important for traders to be familiar with various chart patterns, such as the W symbol, as they can provide valuable insights into potential market trends.
To identify a flag pattern, look for a strong price surge followed by a consolidation period with parallel trendlines. The price surge is the flagpole, while the consolidation forms the flag. The flag pattern is typically a continuation pattern, suggesting that the price is likely to resume its previous trend. To confirm, watch for decreasing trading volume during consolidation and a breakout in the direction of the initial surge. The flag pattern is widely used in technical analysis to anticipate potential price movements.
To recognize and interpret a cup and handle pattern, start by identifying a stock or asset that demonstrates a U-shaped cup formation, which indicates a temporary slowdown in price. Look for a subsequent small consolidation, forming the handle portion, typically showing a slight downward drift. Once the stock price breaks above the handle's resistance level, it signals a bullish continuation, making it an ideal time to consider buying. However, it is crucial to confirm the pattern with volume analysis and use additional indicators for a comprehensive analysis before making any investment decisions.
Yes, chart patterns can be used successfully for day trading SOL (ticker symbol for Solana). Day traders often rely on chart patterns such as support and resistance levels, trend lines, and candlestick patterns to identify potential entry and exit points for their trades. By studying price action and analyzing these patterns, day traders can make informed decisions and increase their chances of profitability. However, it is crucial to combine chart patterns with other technical indicators and risk management strategies to maximize success in day trading SOL.
Chart patterns are an essential tool for day trading strategies. To utilize them effectively, start by studying common patterns such as triangles, flags, and head and shoulders. These patterns help identify potential trend reversals or breakouts. Once a pattern is recognized, traders can enter a position based on the anticipated price movement. It is critical to combine chart patterns with other technical indicators and implement proper risk management. Continual practice and analysis of historical patterns will improve your ability to execute successful day trading strategies using chart patterns.
Trendlines play a crucial role in confirming SOL (Support, Obstacle, and Level) chart patterns. These lines are drawn by connecting consecutive higher lows or lower highs, providing insights into the direction of the trend. When a chart pattern, such as a bullish or bearish trend reversal, is identified, trendlines act as confirmation indicators. If the price consistently follows the trendline, it reinforces the pattern's validity, highlighting the stock's potential movement. Traders often look for price action near the trendline to strengthen their analysis and make informed decisions. By confirming chart patterns, trendlines enhance the accuracy of predictions and increase the reliability of SOL strategies.
Conclusion
In conclusion, SOL Chart Patterns are invaluable tools for traders in the SOL (Solana) cryptocurrency market. These patterns provide visual representations of price action, helping traders identify potential support and resistance levels and anticipate trend reversals. By analyzing SOL Chart Patterns, traders can make informed decisions on when to enter or exit trades, leading to increased profitability. Understanding gaps in SOL price charts and utilizing technical analysis techniques further enhance a trader's ability to identify trading opportunities and manage risk effectively. Additionally, incorporating wedge patterns and other chart patterns into short-term trading strategies can optimize trading outcomes. Overall, mastering SOL Chart Patterns is essential for successful trading in the dynamic cryptocurrency market.

Successful traders rely on backtesting to be profitable.
Be like them with our
Free Backtesting Guide