-
Track your
Crypto Portfolio -
Copy Crypto trading
strategies -
Build trading strategies
with no code
-
Backtest trading strategies
on Crypto, Forex, Stocks, etc. -
Demo Trading
Risk-free Paper Trading -
Automate trading strategies
with Live Trading
Quant Strategies & Backtesting results for NVDA
Here are some NVDA trading strategies along with their past performance. You can validate these strategies (and many more) for free on Vestinda across thousands of assets and many years of historical data.
Quant Trading Strategy: ZLEMA Crossover with Increased Price Variance on NVDA
Based on the backtesting results statistics for this trading strategy, which covers the period from December 11, 2016 to December 11, 2023, several insights emerge. The profit factor stands at an impressive 2.83, indicating a favorable return on investment. The annualized return on investment registers at 19.59%, demonstrating consistent profitability. The average holding time for trades spans approximately 2 weeks and 4 days, suggesting a medium-term strategy. The average number of trades per week is relatively low at 0.06, highlighting a selective approach. The total number of closed trades is 25, indicating a cautious trading style. Lastly, the winning trades percentage stands at 40%, showing room for improvement in executing successful trades. Overall, these backtesting results showcase a promising trading strategy with a profit potential of 139.94%.
Choose another period and try again.
Quant Trading Strategy: Awesome Oscillator Momentum Strategy on NVDA
Based on the backtesting results from December 8, 2016, to December 8, 2023, the trading strategy showcased promising outcomes. The strategy exhibited a profit factor of 4.18, indicating a favorable risk-reward ratio. The annualized return on investment stood at an impressive 385.51%, highlighting the strategy's ability to generate substantial gains. The average holding time for trades was approximately 7 weeks and 2 days, reflecting a moderately long-term approach. With an average of 0.07 trades per week, the strategy demonstrated a cautious and selective approach to market entries. Despite the relatively low winning trades percentage of 37.04%, the overall return on investment amounted to an exceptional 2753.67%.
Choose another period and try again.
Mastering Candlestick Patterns with NVIDIA: A Comprehensive Guide to Bullish and Bearish Engulfing
Candlestick patterns are essential tools for traders, providing insights into market sentiment and potential price movements. In this guide, we will explore key candlestick patterns using NVIDIA's stock price chart as our reference. We'll start with a brief introduction to the Spinning Top Black and Doji Star patterns, and then dive into detailed examples of Bullish and Bearish Engulfing patterns.
The Basics: Spinning Top Black and Doji Star Patterns
Before we delve into the specifics of Bullish and Bearish Engulfing patterns, it's important to recognize two other common candlestick formations: the Spinning Top Black and the Doji Star.
Spinning Top Black:
- Appearance: This pattern features a small body with long upper and lower shadows.
- Significance: It indicates indecision in the market, where neither the bulls nor the bears are in full control. Traders often see this as a sign to wait for further confirmation before making a move.
Doji Star:
- Appearance: The Doji Star has little to no body, appearing as a cross or plus sign.
- Significance: It signals potential reversal points and heightened market uncertainty. A Doji Star at the top of an uptrend can indicate a bearish reversal, while at the bottom of a downtrend, it can suggest a bullish reversal.

Here’s a daily timeframe chart of NVIDIA showing a Spinning Top Black, a Doji Star, and a Bearish Engulfing pattern.
Bullish Engulfing Pattern
Definition and Identification:
- A Bullish Engulfing pattern consists of two candles. The first candle is bearish, and the second candle is bullish, completely engulfing the body of the first candle.
- This pattern often indicates a potential reversal from a downtrend to an uptrend. The larger the bullish candle, the stronger the signal.
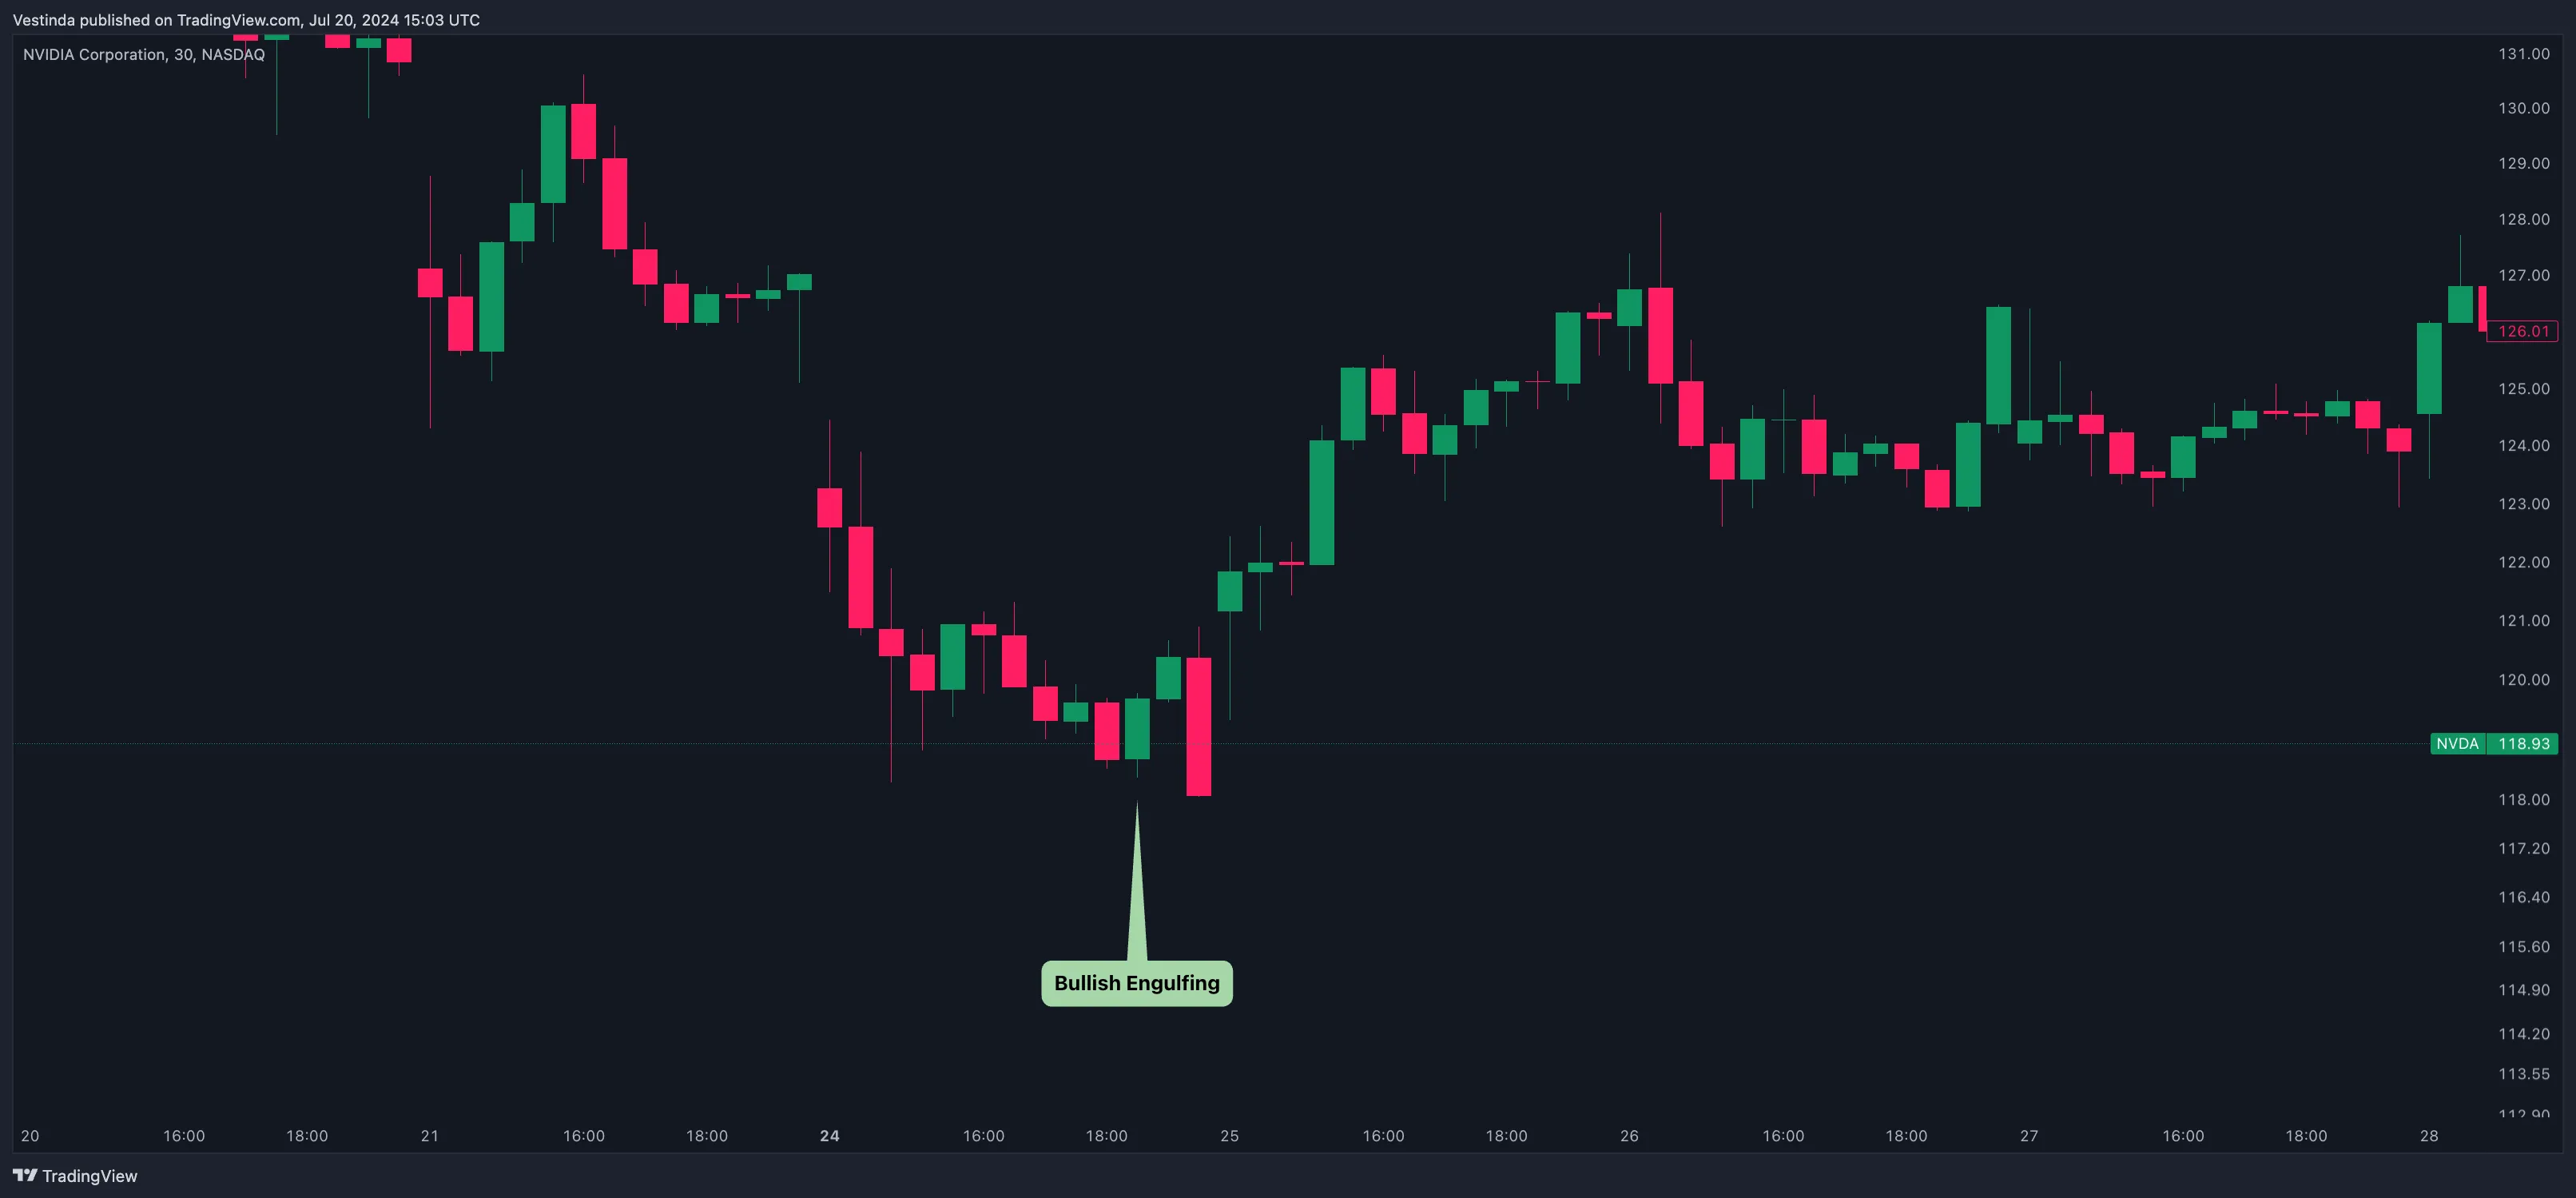
In the 30-minute timeframe of NVIDIA's stock, we can identify a clear example of a Bullish Engulfing pattern.
Interpretation and Trading Strategy:
- Interpretation: The appearance of this pattern suggests a shift in market sentiment from bearish to bullish. It indicates that buyers have taken control from sellers, potentially marking the beginning of an upward trend.
- Trading Strategy: Traders might consider entering a long position following the confirmation of the Bullish Engulfing pattern. It’s advisable to set stop-loss orders below the recent low for risk management and to lock in profits by trailing the stop as the price moves up.
Bearish Engulfing Pattern
Definition and Identification:
- A Bearish Engulfing pattern also consists of two candles. The first candle is bullish, and the second candle is bearish, completely engulfing the body of the first candle.
- This pattern typically indicates a potential reversal from an uptrend to a downtrend. The larger the bearish candle, the more significant the signal.
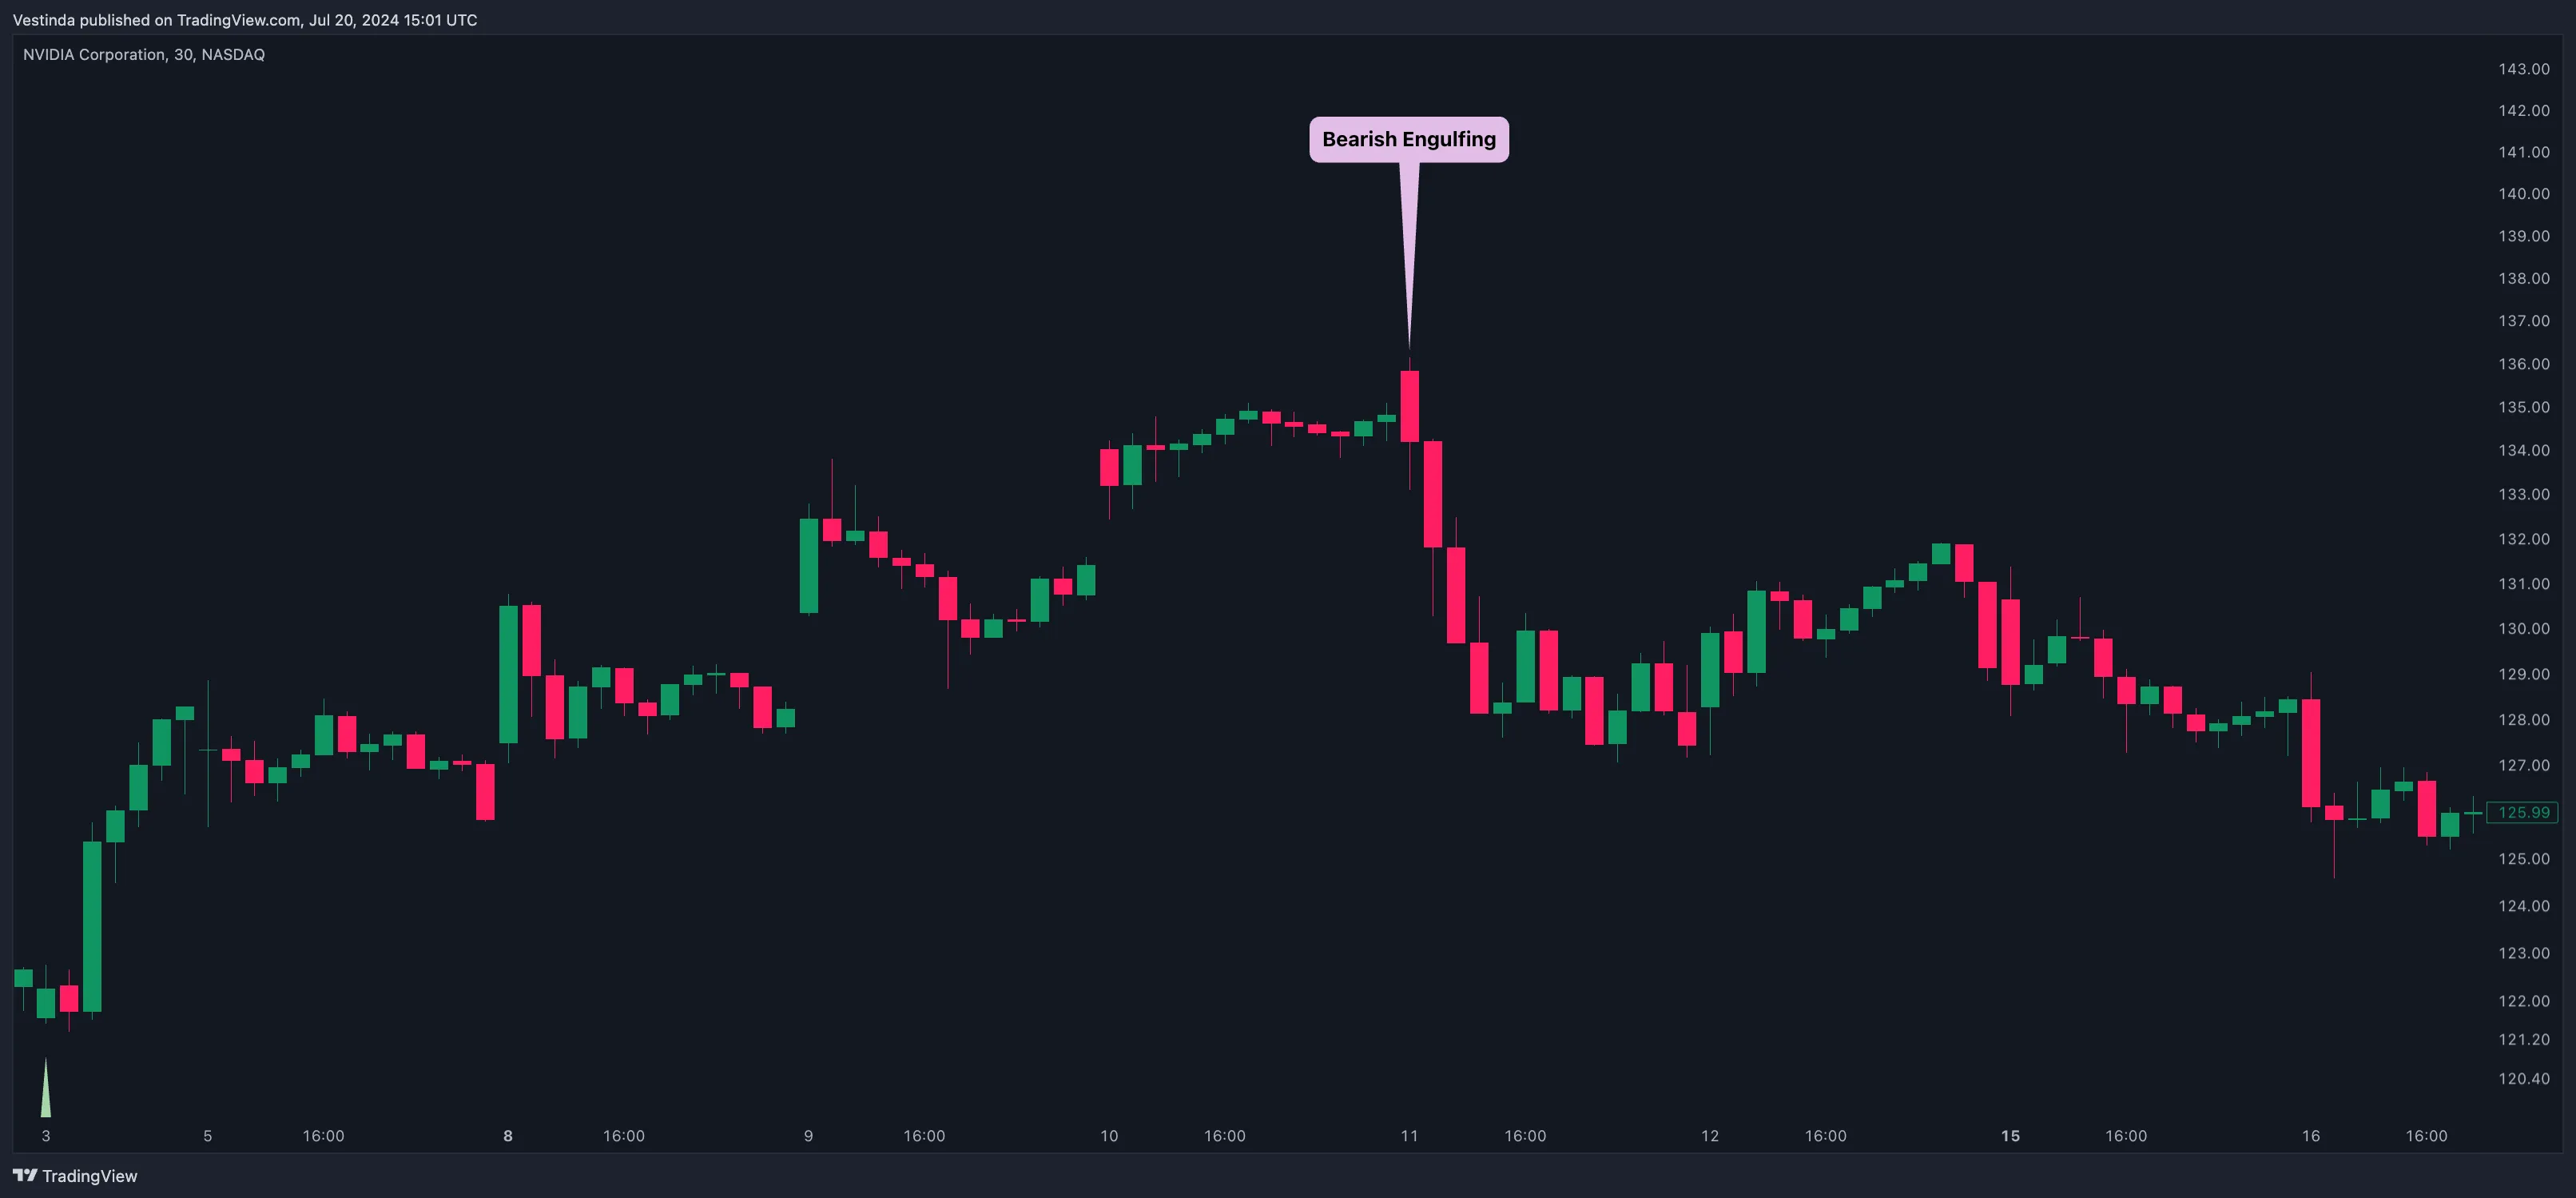
30-min timeframe chart of NVIDIA showcases a Bearish Engulfing pattern.
Interpretation and Trading Strategy:
- Interpretation: The emergence of this pattern suggests a transition in market sentiment from bullish to bearish. It indicates that sellers have overwhelmed buyers, possibly leading to a downward trend.
- Trading Strategy: Traders might consider entering a short position after confirming the Bearish Engulfing pattern. Placing stop-loss orders above the recent high helps manage risk, and trailing the stop can protect profits as the price declines.
Nvidia's Candlestick Patterns: Essential Trading Insights
- Identify the candlestick pattern on the NVDA chart.
- Confirm the pattern by analyzing the previous price action.
- Assess the pattern's bullish or bearish implications based on its characteristics.
- Wait for confirmation from other technical indicators like volume or moving averages.
- Place a trade in the direction suggested by the candlestick pattern.
- Set a stop loss to limit potential losses if the trade goes against you.
- Monitor the trade and adjust the stop loss and take profit levels accordingly.
Fluctuating Strategies: NVDA's Rise and Decline
The Rising and Falling Three Methods is a candlestick pattern that can indicate the continuation or reversal of a trend. It consists of a series of five consecutive candlesticks. In the case of a rising three methods, the first candlestick is a long bullish candle, followed by three smaller bearish candlesticks that trade within the range of the first candle. The final candlestick is a long bullish candle that closes above the high of the first candle. This pattern suggests that the previous uptrend will continue. Conversely, the falling three methods pattern occurs in a downtrend. The first candle is a long bearish candle, followed by three smaller bullish candlesticks that trade within the range of the first candle. The final candle is a long bearish candle that closes below the low of the first candle, indicating a potential continuation of the downtrend. Traders often use the Rising and Falling Three Methods as a signal to enter or exit trades in stocks like NVDA.
Nvidia's Glowing Patterns: The Shooting Star Candlestick
The Shooting Star is a bearish candlestick pattern that often signals a potential trend reversal. It appears after an uptrend and has a small body with a long upper shadow, at least twice the length of the body. The long shadow indicates that buyers drove prices higher during the session but lost control, leading to a sell-off. The pattern is named after its resemblance to a shooting star falling from the sky.
For traders, the Shooting Star suggests that bullish momentum may be waning, and a potential reversal could occur. It is seen as a warning sign to take profits or consider shorting the stock. In the context of NVDA, a Shooting Star candlestick pattern could indicate that the stock is reaching a price peak, and that a downward move may be imminent. However, traders should always look for confirmation from other technical indicators before making any trading decisions.
NVDA's Promising Evening Star Pattern Breakout
The Evening Star Pattern is a bearish reversal pattern in technical analysis. It typically appears at the end of an uptrend and consists of three candlesticks. The first candlestick is a large bullish candle, followed by a small-bodied candle. The third candlestick is a large bearish candle that closes below the midpoint of the first candle. This pattern indicates a potential change in the market sentiment from bullish to bearish. Traders often use the Evening Star Pattern as a signal to sell or take profits. It is important to note that the reliability of this pattern increases when it appears after a significant uptrend and is confirmed by other technical indicators or price action. For example, if the Evening Star Pattern appears near a key resistance level, it strengthens the bearish view. Traders should combine this pattern with other analysis tools to increase the probability of successful trades.
-
 Create
account -
 Build trading strategies
with no code -
 Validate
& Backtest -
 Connect exchange
& start earning
Frequently Asked Questions
The number of candlesticks used in a day can vary depending on individual preferences and occasions. Some people may use several candlesticks throughout the day for different purposes, such as decoration, religious rituals, or aromatherapy. Others may not use any candlesticks at all. There is no specific limit on the number of candlesticks one can use in a day, as it is a personal choice. Ultimately, it ranges from zero to however many one desires, making it impossible to determine a specific number.
The number of candlesticks required to form a trend depends on the specific timeframe and the context of the market. Generally, a trend is considered to be formed by a series of consecutive candlesticks moving in the same direction. In short-term trading, a trend may be identified with just a few candlesticks, such as three or five. However, in longer-term analysis, a trend usually requires more candlesticks to be statistically significant. Remember, it is essential to consider other technical indicators and factors alongside candlestick patterns to get a comprehensive view of a trend.
Yes, it is possible to trade without relying solely on candlestick charts. While candlestick patterns provide valuable insights into price action and market sentiment, they are not the only tool for trading. Alternative charting methods like line charts or bar charts can still provide useful information such as support and resistance levels, trendlines, and basic price movements. Additionally, traders can incorporate other technical indicators and analysis techniques to make informed decisions. Remember, successful trading is about finding a combination of tools and strategies that work best for you.
Reading candles for beginners involves understanding the basics of candlestick charts. First, identify the candle's body which represents the opening and closing prices. A bullish candle has a larger closing price than opening, while a bearish candle has a larger opening price than closing. Pay attention to the shadows or wicks, which indicate the highest and lowest prices reached during the candle's time period. Additionally, patterns, such as doji or hammer, can provide insights into potential market trends. Combine these elements to analyze a candlestick chart effectively, identifying market sentiment and making informed trading decisions.
Conclusion
In conclusion, incorporating NVDA Candlestick Patterns into your trading strategy can provide valuable insights into potential changes in NVDA's stock value. By understanding and analyzing the various candlestick patterns, traders can make more informed decisions when it comes to buying or selling NVDA shares. It is important to identify the pattern on the NVDA chart, confirm it with previous price action, assess its implications, and wait for confirmation from other technical indicators. The Rising and Falling Three Methods, Shooting Star, and Evening Star patterns are just a few examples of candlestick patterns that traders can use to enter or exit trades in NVDA or other stocks. Remember to always use these patterns in conjunction with other analysis tools for increased trading success.

Successful traders rely on backtesting to be profitable.
Be like them with our
Free Backtesting Guide