
Sophisticated backtesting is not only possession of high-esteemed hedge funds anymore.
Impressive Team and support, Backtesting engine with detailed reports, The Strategy builder.

Great purchase!
I have always manually invested in stocks and cryptocurrencies, but after studying Vestinda, I must say it has enormous potential.

Mature platform for trading
Pro: Easy to use, Nice UX, A lot of customization for strategies, Back testing is an awesome tool, can check any strategy in history.

Quantitative Strategies & Backtesting results for NSEI
Here are some NSEI trading strategies along with their past performance. You can validate these strategies (and many more) for free on Vestinda across thousands of assets and many years of historical data.
Quantitative Trading Strategy: Medium Term Investment on NSEI
Based on the backtesting results for the trading strategy conducted from October 2, 2023, to November 2, 2023, several key statistics emerged. The strategy exhibited a profit factor of 0.88, indicating a less favorable return on investment. The annualized ROI stood at -1.95%, implying a slight negative growth rate over the stated period. On average, holdings were maintained for approximately 4 days and 8 hours before being closed. The strategy produced an average of 0.45 trades per week, with a total of 2 closed trades. The return on investment was -0.17%, and the winning trades percentage was 50%. Notably, the strategy outperformed the buy and hold method, generating excess returns of 2.69%.
 NSEI
NSEI

Choose another period and try again.
Quantitative Trading Strategy: Follow the trend on NSEI
According to the backtesting results for the trading strategy from November 2, 2022, to November 2, 2023, the statistics reveal promising potential. The strategy exhibited a profit factor of 2.49, indicating that for every unit of risk, there was a significant profit generated. The annualized return on investment stood at 6.76%, suggesting a steady and consistent growth rate over the specified period. The average holding time for trades was around 6 weeks, with only 0.09 trades executed per week. Despite a relatively low number of closed trades (5), the strategy managed to yield positive results, with a winning trades percentage of 40%. Furthermore, when compared to a traditional buy and hold approach, the strategy outperformed, generating excess returns of 1.64%. These backtesting results indicate the potential viability and effectiveness of this trading strategy.
NSEI
Choose another period and try again.
NSEI (Nifty 50) Paper Trading: A Beginner's Guide
Introduction
The Nifty 50 (NSEI) is one of India’s most prominent stock indices, representing the top 50 companies listed on the National Stock Exchange (NSE). For new traders looking to gain experience without risking real money, paper trading offers the perfect solution. This beginner’s guide will walk you through how to start paper trading the Nifty 50, giving you the tools and strategies needed to hone your skills in a risk-free environment.
What is Paper Trading?
- Definition: Paper trading is the practice of simulating real trades without using actual money. It allows traders to place virtual trades, track performance, and refine strategies without the financial risk.
- Purpose: Paper trading provides a hands-on learning experience for beginners to understand how the market works, how to execute trades, and how to manage risk, all in a no-risk environment.
Why Paper Trade the Nifty 50?
- Learn Market Dynamics: The Nifty 50 represents a broad segment of the Indian stock market, making it an ideal learning ground for traders to understand market trends and behaviors.
- Practice Trading Strategies: You can test different trading strategies, such as trend following, breakout trading, or mean reversion, on a high-liquidity index.
- Risk-Free Learning: Paper trading on the Nifty 50 allows you to practice and develop your skills without the fear of losing real capital.
How to Start Paper Trading the Nifty 50:
- Choose a Paper Trading Platform:
Many trading platforms offer paper trading accounts. Look for platforms that provide real-time data for the Nifty 50, allowing you to simulate trades accurately.
Some popular platforms include TradingView, Zerodha, and Upstox, where you can access paper trading features.
- Set Up a Virtual Account:
Once you’ve chosen a platform, create a virtual trading account. You will typically start with a set amount of virtual money, which you can use to simulate trades on Nifty 50 stocks.
Treat this virtual money as if it were your real capital to develop sound trading habits.
- Familiarize Yourself with the Interface:
Take time to explore the trading interface, understanding how to place buy and sell orders, view charts, and monitor the market.
Learn how to set stop-loss and take-profit orders, which are essential tools for managing risk even in a virtual environment.
Strategies to Practice on the Nifty 50:
Moving Averages Strategy
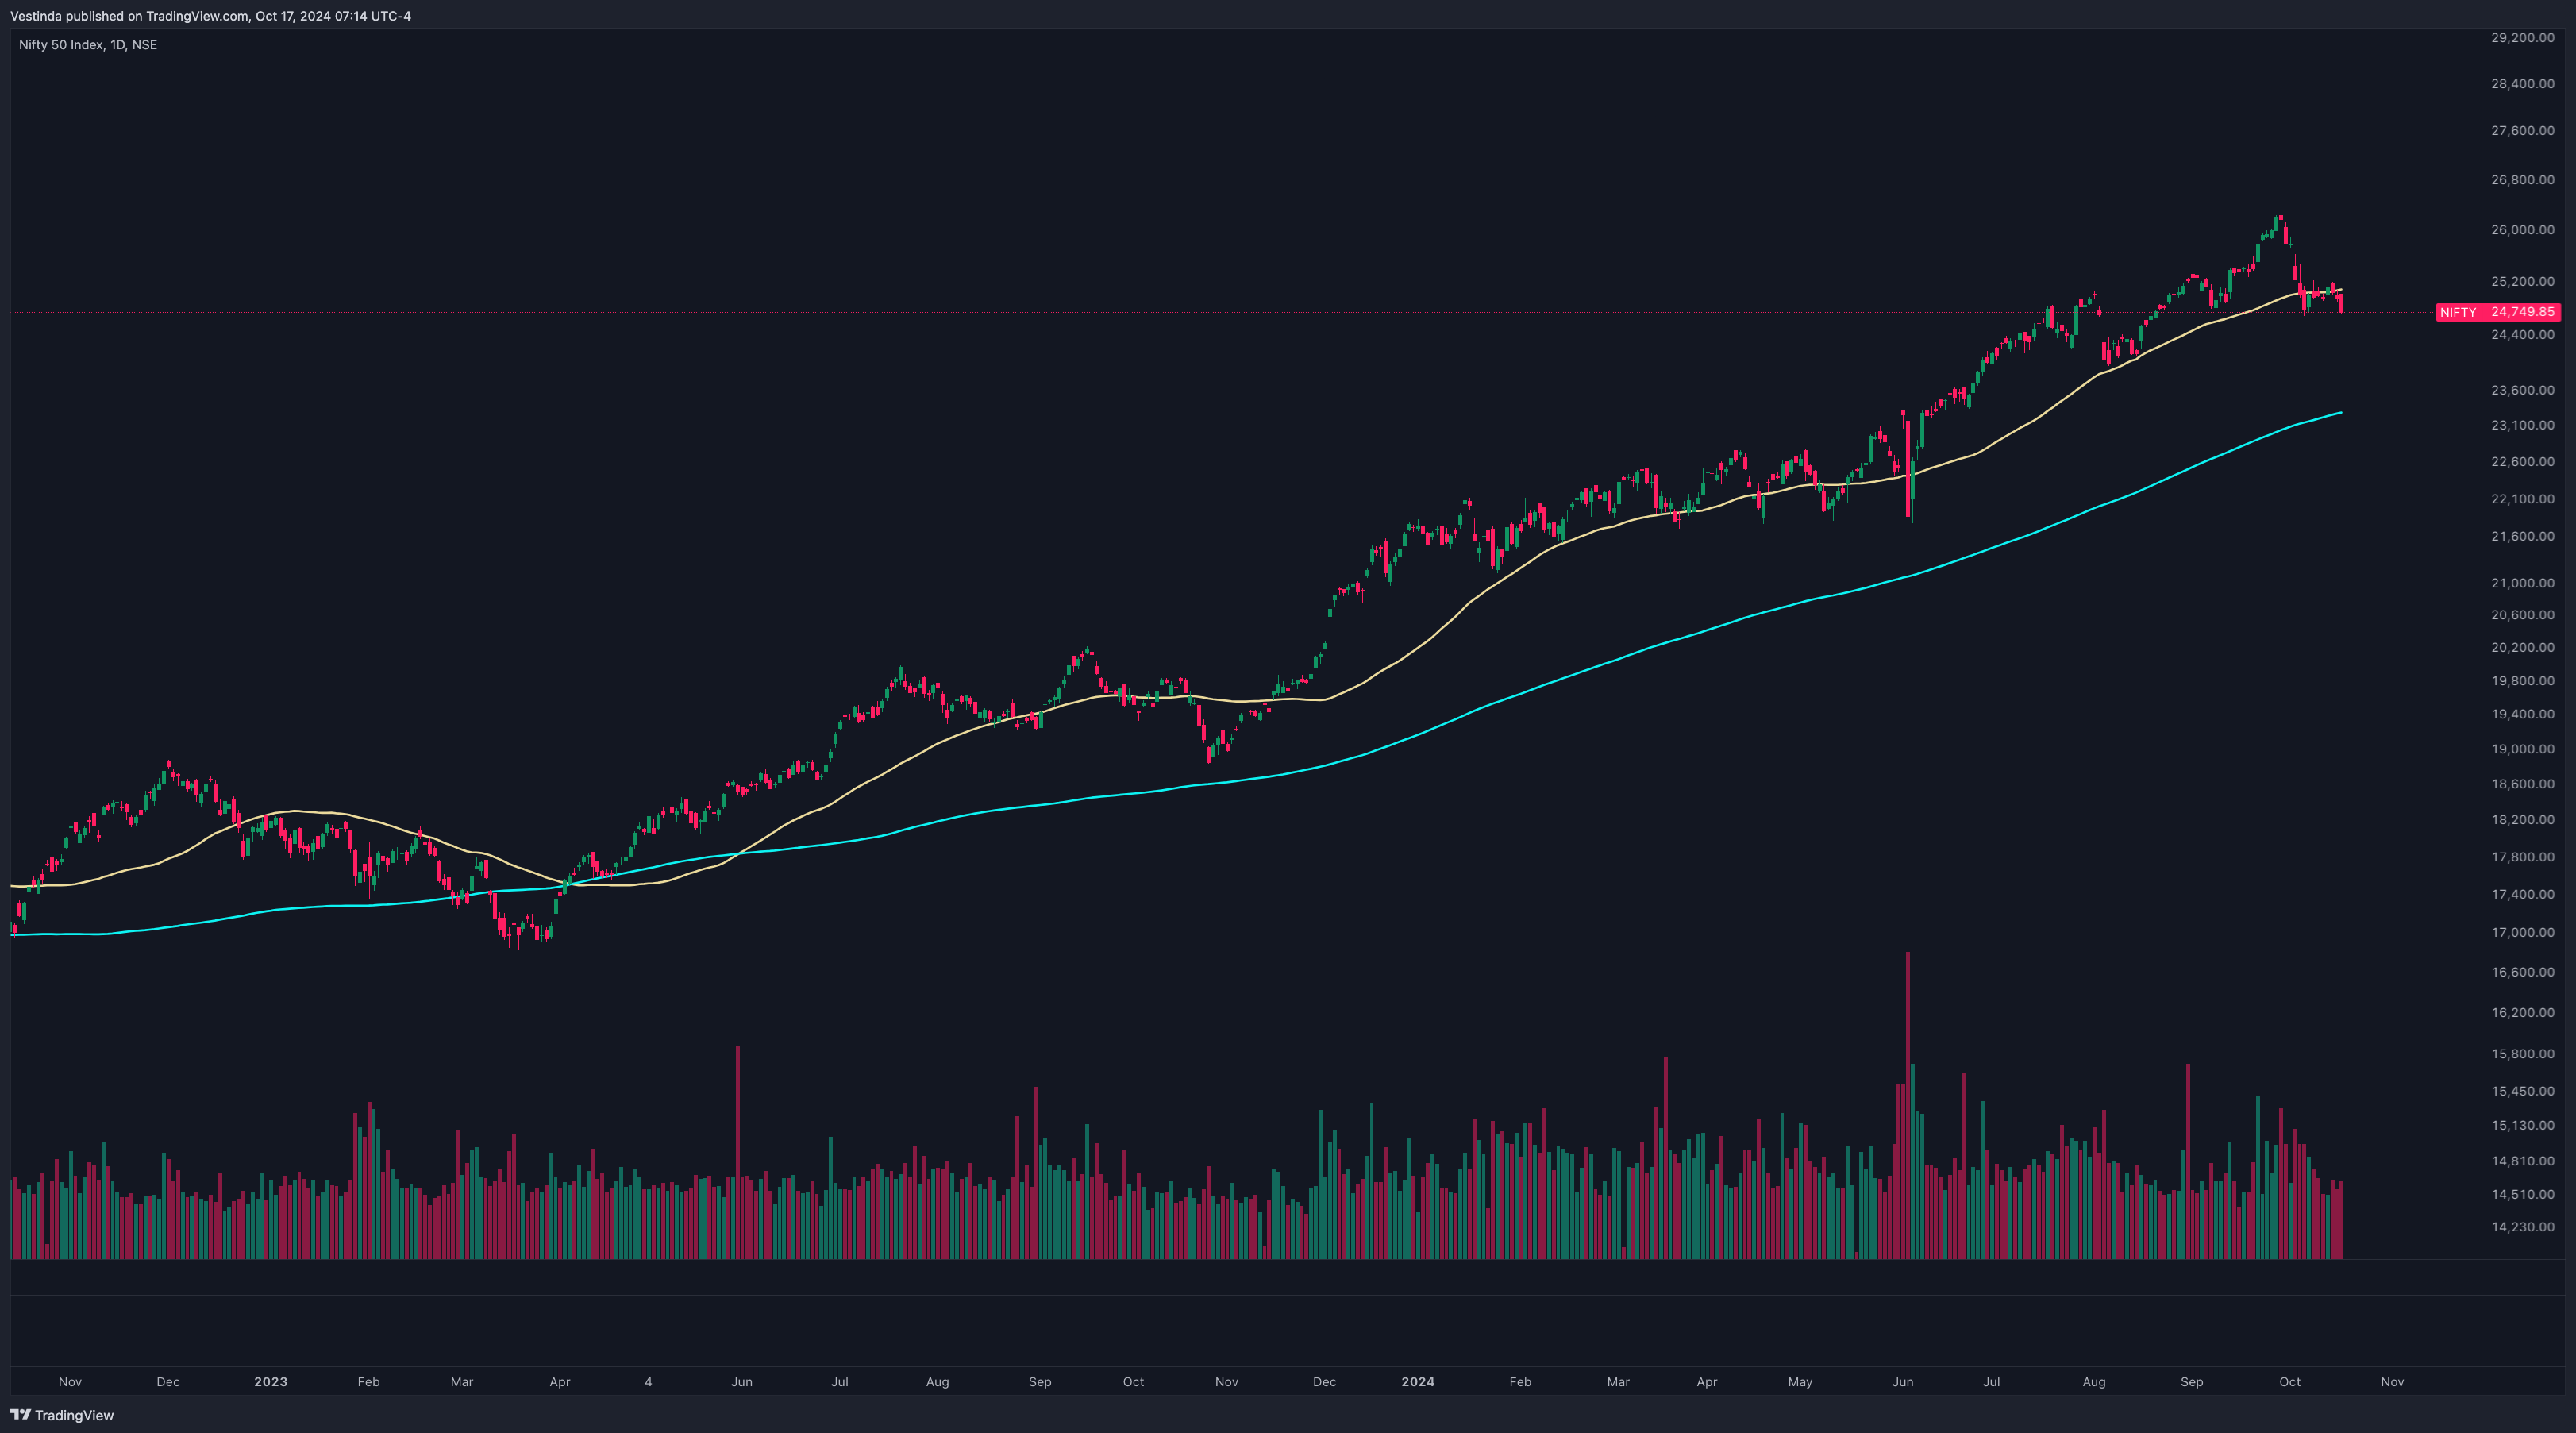
Concept: Moving averages smooth out price data, helping traders identify trends and potential reversals.
How to Practice:
Apply a 50-day and 200-day moving average to your chart. Simulate buying when the 50-day MA crosses above the 200-day (Golden Cross) and selling when the 50-day crosses below the 200-day (Death Cross).
Breakout Trading Strategy
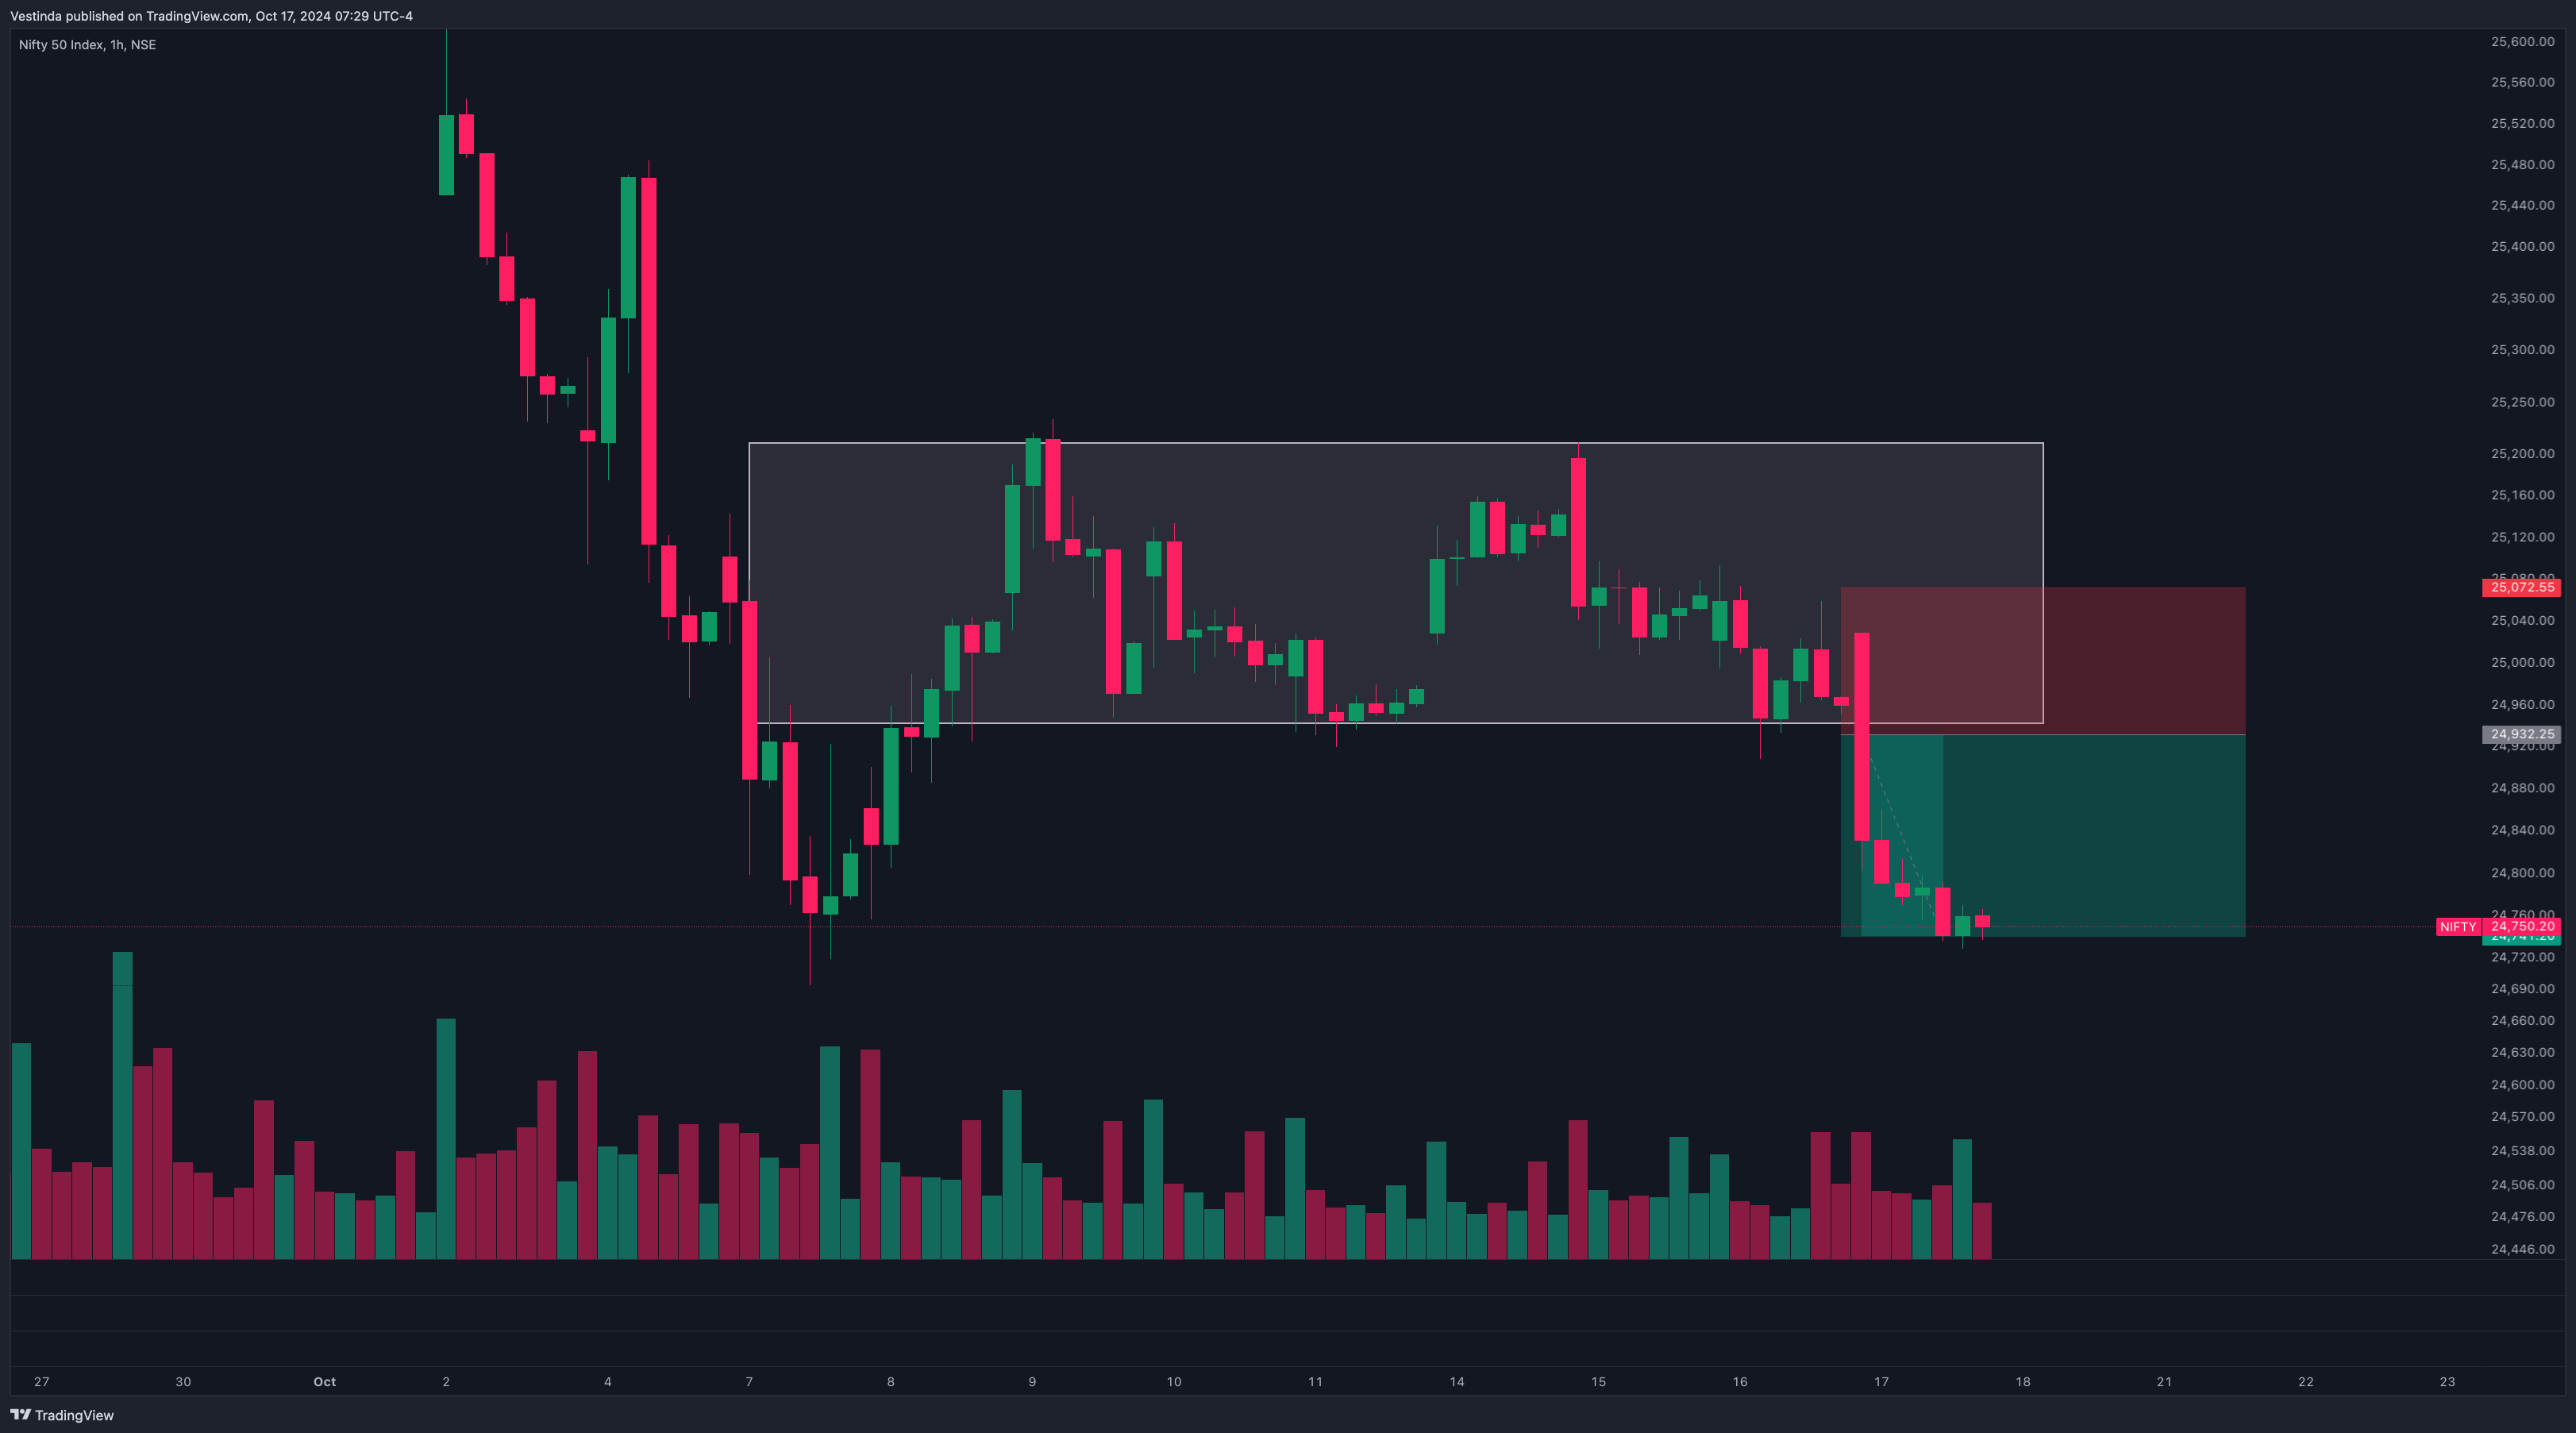
Concept: Breakout trading involves entering a trade when the price breaks through key support or resistance levels.
How to Practice:
Identify price patterns such as triangles or rectangles on the Nifty 50 chart. Enter a simulated trade when the price breaks out of the pattern with increased volume and set a stop-loss to manage risk.
RSI (Relative Strength Index) Strategy
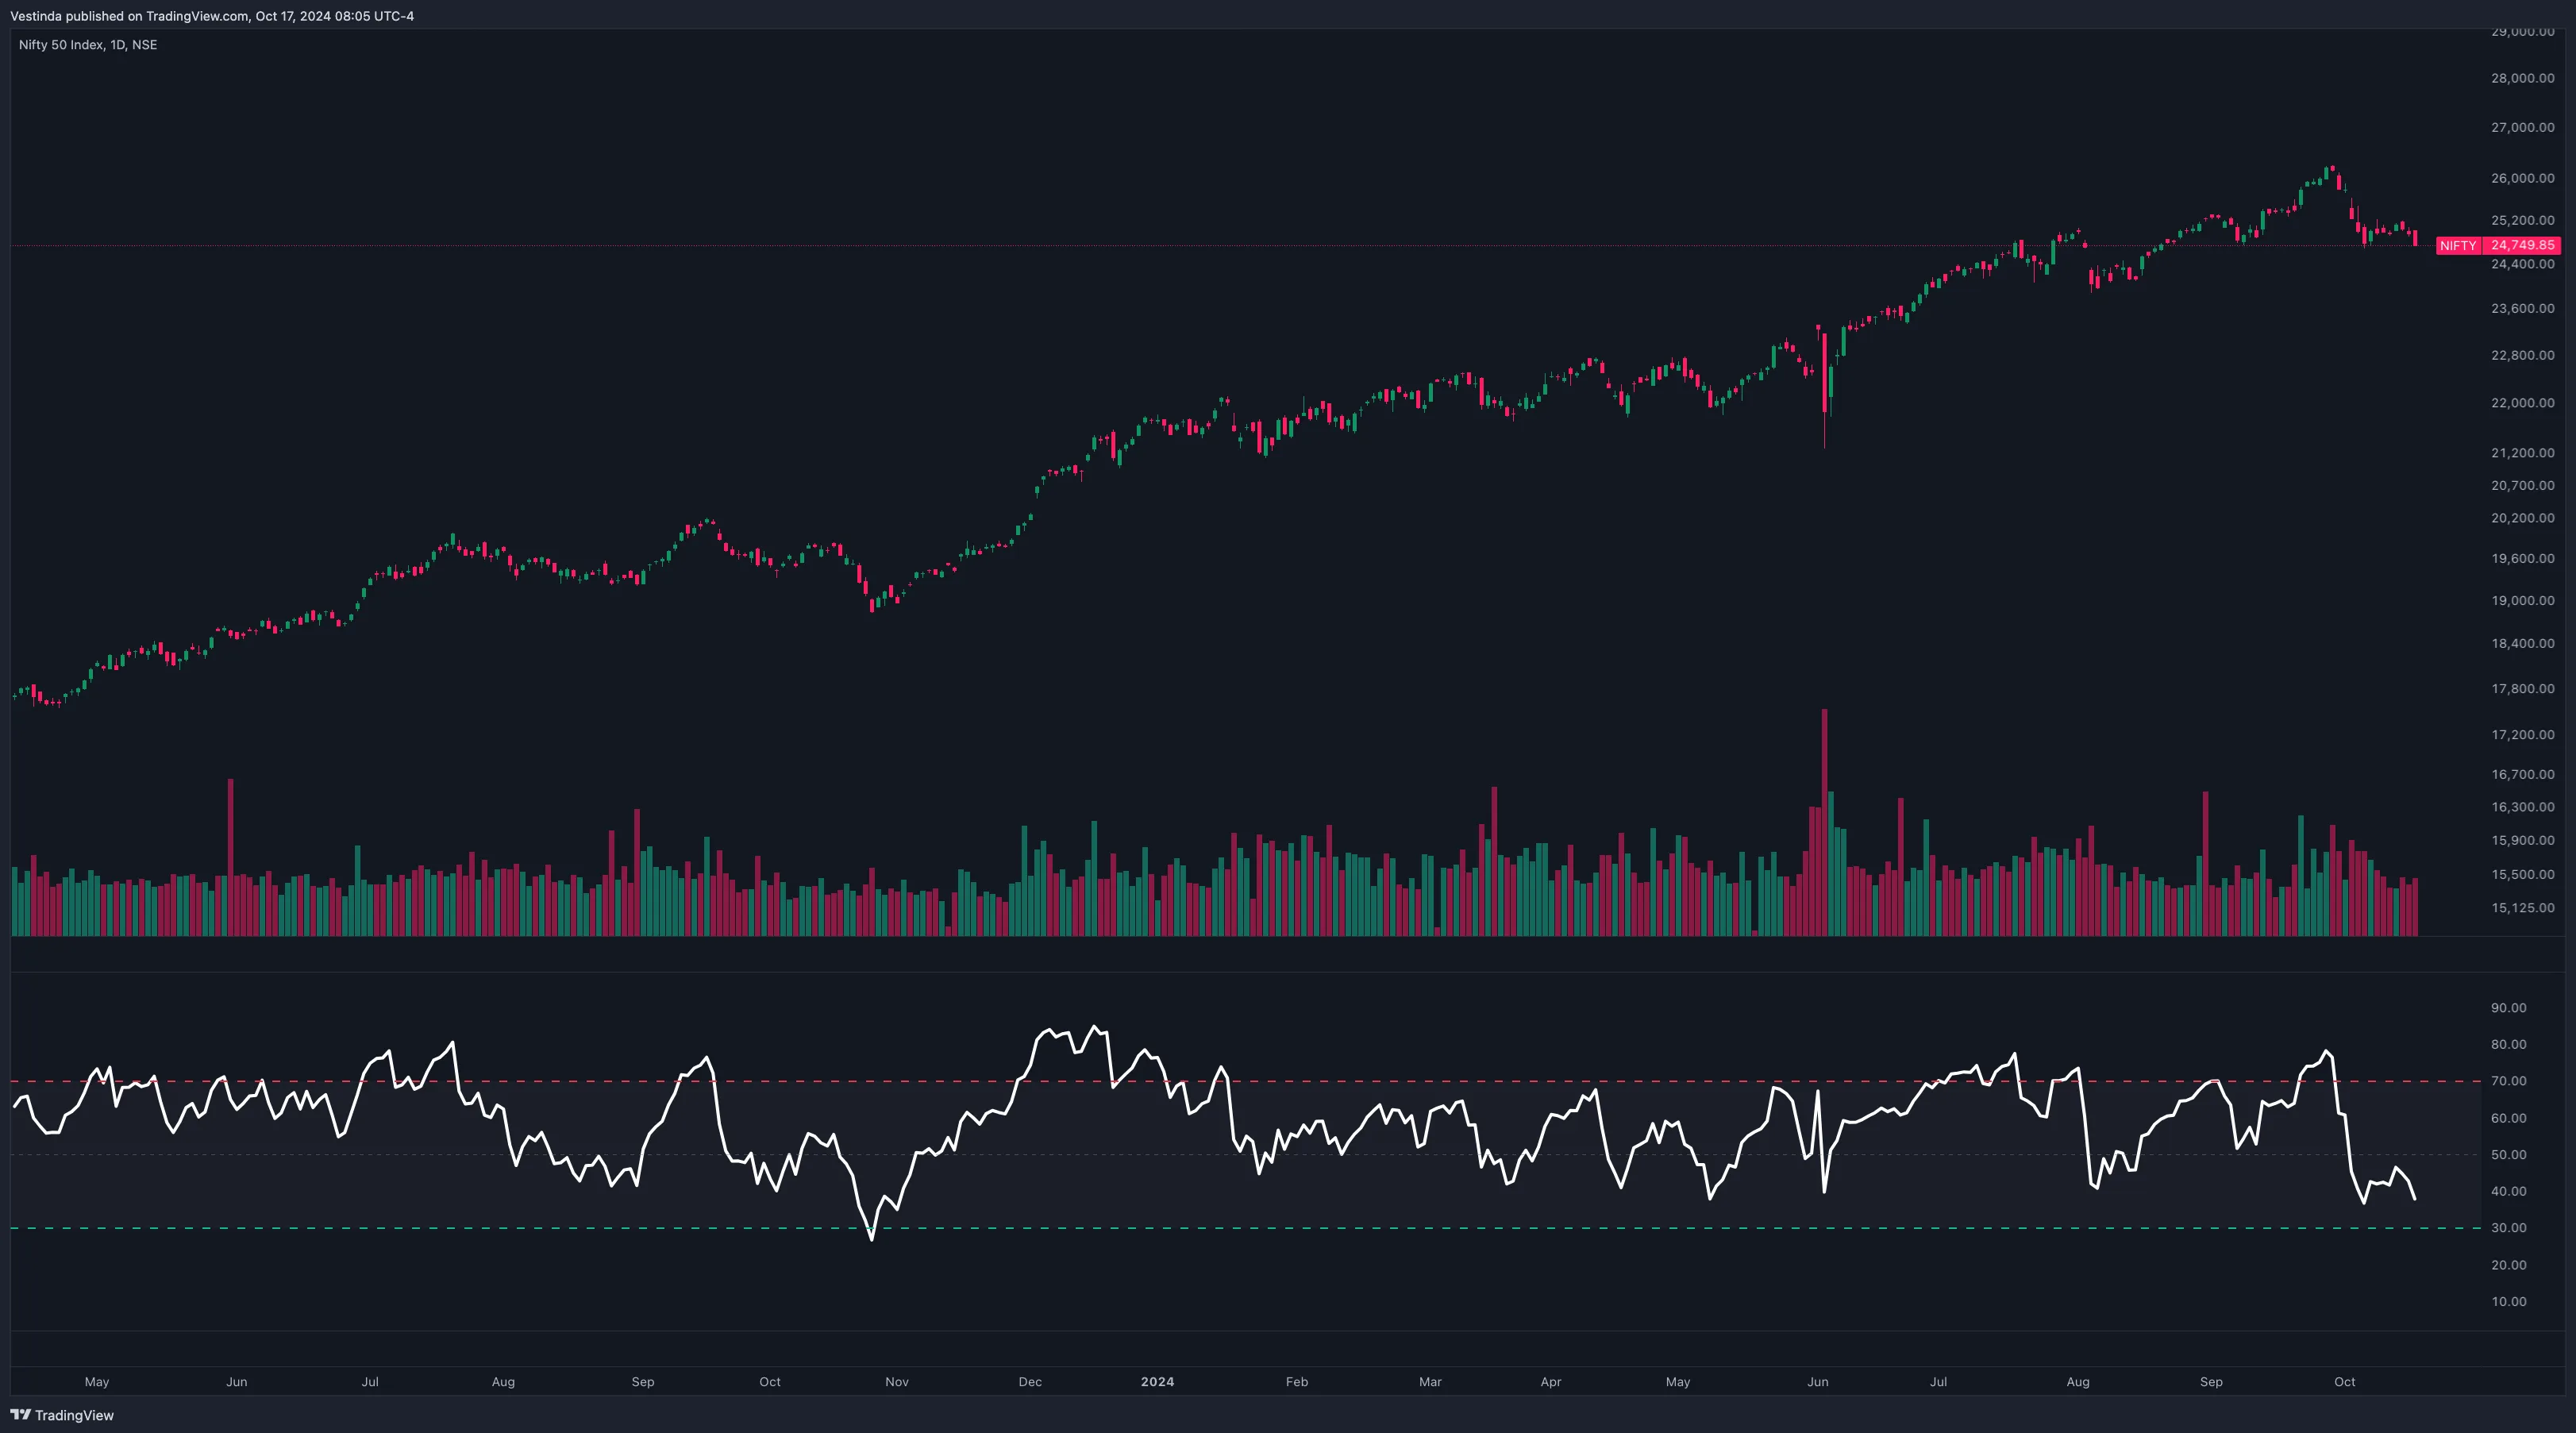
Concept: The RSI is a momentum indicator that helps traders identify overbought and oversold conditions.
How to Practice:
Use RSI to determine when the Nifty 50 might be due for a reversal. Enter long positions when the RSI falls below 30 (oversold) and sell when the RSI exceeds 70 (overbought).
Supertrend Indicator Strategy

Concept: The Supertrend indicator is useful for identifying trend direction and issuing clear buy or sell signals.
How to Practice:
Apply the Supertrend indicator to your Nifty 50 chart and simulate trades based on its buy (green) and sell (red) signals. This strategy is ideal for catching trends early and riding them as long as possible.
Risk Management in Paper Trading:
Even though paper trading doesn’t involve real money, practicing risk management is essential to developing sound trading habits.
Position Sizing:
Concept: Only risk a small percentage of your virtual capital per trade to prevent significant losses.
How to Practice: Set position sizes to 1-2% of your total virtual account value to ensure risk is controlled.
Stop-Loss and Take-Profit Orders:
Concept: Stop-loss orders protect your capital by automatically closing a position if the price moves against you, while take-profit orders lock in gains.
How to Practice: Set stop-losses at key support levels and take-profit levels at resistance zones in each simulated trade to manage risk and potential profits.
Track and Analyze Trades:
Concept: Keeping a record of your trades is essential for reviewing performance and improving your strategy.
How to Practice: After each simulated trade, review your entries, exits, and performance to identify what worked and what didn’t. Use this data to refine your strategy over time.
How to Transition From Paper Trading to Real Trading:
Build Confidence:
Paper trading allows you to gain confidence by testing strategies in a simulated environment. Once you’re consistently making profitable trades, you’ll feel more comfortable transitioning to real trading.
Start Small:
When you begin real trading, start with small amounts of capital. This will allow you to manage risk while getting accustomed to the emotions of real-money trading.
Continue Learning:
Keep learning and adapting your strategies as market conditions change. Just because a strategy works in paper trading doesn’t mean it will always work in real trading, so constant adjustment and learning are crucial.
Analyzing Paper Trading Performance in NSEI
Tracking performance metrics is crucial in paper trading NSEI (Nifty 50). It allows traders to analyze their strategies and make informed decisions. The most basic metric to track is the overall profit or loss of the paper trading account. Additionally, traders can track metrics such as the win rate, which measures the percentage of profitable trades. They can also track metrics like the average return per trade, maximum drawdown, and risk-reward ratio. These metrics provide insights into the trader's risk management and profitability. By consistently tracking performance metrics, traders can identify patterns, strengths, and weaknesses in their strategies. This knowledge can help them refine their trading approach and increase their chances of success when transitioning to live trading.
Simulated Trading of Nifty 50 Futures and Derivatives
Paper trading NSEI futures and derivatives is a valuable way to practice trading strategies. It allows investors to test their ideas and refine their techniques without risking actual capital. In the simulated trading environment, users can evaluate how their strategies perform in different market conditions and gain valuable experience. Additionally, paper trading NSEI futures and derivatives can help investors familiarize themselves with the intricacies of the market, such as how trades are executed and the effects of leverage. It is an ideal platform for beginners to gain confidence and learn from their mistakes without the fear of incurring significant losses. By regularly paper trading, investors can enhance their skills and improve their chances of success when trading NSEI futures and derivatives in real-world scenarios.
Optimal Platforms for NSEI Paper Trading
When it comes to paper trading NSEI, it is important to choose the right platform. A good platform should provide a realistic trading experience and offer a wide range of features. It should have an easy-to-use interface that allows you to place trades quickly and efficiently. Look for a platform that offers real-time market data and a variety of trading tools. It should also have a built-in portfolio tracker, allowing you to monitor your positions and track your performance. Additionally, consider the platform's customer support and educational resources. Make sure the platform is reliable and secure, as you will be entrusting it with your trading activities. Overall, take the time to research and compare different platforms before making a decision. Choosing the right platform will greatly enhance your paper trading experience.
Quantitative Analysis: Enhancing Nifty 50 Paper Trading
The Role of Quantitative Analysis in NSEI Paper Trading
Quantitative analysis plays a crucial role in NSEI paper trading for several reasons. First and foremost, it allows traders to gain insights into market trends and make data-driven decisions. By analyzing historical and real-time data, traders can identify patterns and correlations that can inform their trading strategies.
Additionally, quantitative analysis helps traders manage risk and minimize losses. Through statistical modeling and backtesting, traders can assess the risk-reward profile of potential trades and adjust their positions accordingly. This helps in optimizing their portfolio and maximizing returns.
Moreover, quantitative analysis provides a systematic approach to trading, ensuring consistency and objectivity in decision-making. By using mathematical models and algorithms, traders can remove emotions from their trading, reducing the impact of biases and market noise.
Overall, quantitative analysis empowers traders in NSEI paper trading by enabling them to make informed decisions based on data, manage risks effectively, and maintain discipline in their trading approach.
-
Track your
Crypto Portfolio -
Copy Crypto trading
strategies -
Build trading strategies
with no code
-
Backtest trading strategies
on Crypto, Forex, Stocks, etc. -
Demo Trading
Risk-free Paper Trading -
Automate trading strategies
with Live Trading
Frequently Asked Questions
Yes, you can test automated trading strategies with paper trading on NSEI (National Stock Exchange of India). Paper trading allows you to simulate real trades without using actual money. It enables you to refine and validate your strategies in a risk-free environment before implementing them in live trading. By utilizing historical data and market conditions, you can assess the effectiveness and profitability of your automated strategies, test different parameters, and make necessary adjustments. Paper trading on NSEI is an excellent tool for strategy development, analysis, and enhancing trading skills before venturing into live trading.
News and events can have a significant impact on paper trading NSEI indices. Market sentiment plays a crucial role in paper trading, and news can influence investor sentiment, leading to fluctuations in index prices. Positive news such as economic growth reports or corporate earnings can drive up index values, while negative news such as geopolitical tensions or economic slowdowns can lead to a decline. Additionally, major events like policy changes or natural disasters can have a profound effect on market sentiment and subsequently affect paper trading NSEI indices, making them highly responsive to current news and events.
Paper trading typically does not cost money as it is a simulated form of trading where individuals practice buying and selling securities without actually using real money. It allows investors to gain experience and test different strategies without risking any capital. Paper trading platforms often provide virtual accounts with virtual money, allowing users to trade with these simulated funds. However, it is important to note that while paper trading does not involve real money, the results and outcomes may not accurately reflect actual market conditions and trading performance.
Yes, there is a difference between paper trading and live trading NSEI indices. Paper trading involves simulated trading without actually investing real money, allowing traders to practice their strategies and understand market dynamics. It is a risk-free environment, enabling beginners to gain experience. On the other hand, live trading involves real funds and actual market conditions, with potential profits and losses. Live trading requires careful analysis, risk management, and emotional control. While paper trading provides a learning platform, it may not accurately replicate the psychological aspects of live trading, such as fear, greed, and market fluctuations. Thus, live trading involves real-world consequences and requires practical skills.
To track your performance in paper trading NSEI, you can follow a few steps. Firstly, maintain a detailed record of your trades, including entry and exit points, quantity, and reasoning. Calculate your overall profit/loss by subtracting costs, including brokerage fees. Analyze your trades to identify patterns, strengths, and weaknesses. Consider maintaining a trading journal to document your emotions and decision-making process. Create a performance metric, such as a risk-reward ratio, win rate, or average profit per trade, to assess your progress. Regularly review your trades and adjust strategies accordingly. Utilize paper trading platforms that offer performance tracking features for convenience.
Conclusion
In conclusion, NSEI paper trading is a valuable tool for investors to practice trading strategies and gain experience in the stock market without risking real money. By utilizing a paper trading app, investors can simulate trading on the Nifty 50 index and test their investment theories. Tracking performance metrics is essential in paper trading NSEI, as it allows traders to analyze their strategies and make informed decisions. Choosing the right platform is also crucial, as it can enhance the paper trading experience. Additionally, quantitative analysis plays a significant role in NSEI paper trading by providing insights into market trends and helping traders manage risk. It ensures consistency and objectivity in decision-making, leading to more successful trading strategies.

Successful traders rely on backtesting to be profitable.
Be like them with our
Free Backtesting Guide