
Sophisticated backtesting is not only possession of high-esteemed hedge funds anymore.
Impressive Team and support, Backtesting engine with detailed reports, The Strategy builder.

Great purchase!
I have always manually invested in stocks and cryptocurrencies, but after studying Vestinda, I must say it has enormous potential.

Mature platform for trading
Pro: Easy to use, Nice UX, A lot of customization for strategies, Back testing is an awesome tool, can check any strategy in history.

Quant Strategies & Backtesting results for ETH
Here are some ETH trading strategies along with their past performance. You can validate these strategies (and many more) for free on Vestinda across thousands of assets and many years of historical data.
Quant Trading Strategy: VWAP and KAMA Confirmation on ETH
The backtesting results statistics for the trading strategy from November 20, 2018, to November 20, 2023, reveal several significant findings. The profit factor stands at 1.38, indicating that the strategy generated 38% more profit than loss overall. The annualized return on investment (ROI) is an impressive 192.68%, revealing the strategy's ability to generate substantial profits over the tested period. On average, the holding time for trades was one week, and a total of 108 trades were closed within this timeframe. The strategy yielded a weekly average of 0.41 trades, showcasing a moderate activity level. The winning trades percentage was 34.26%, implying that the strategy's success rate was relatively low. Nonetheless, the overall return on investment reached an impressive 963.41%.

 ETHUSDT

Choose another period and try again.
Quant Trading Strategy: ATR Breakout Strategy on ETH
Based on the backtesting results statistics for a trading strategy spanning from November 20, 2018, to November 20, 2023, several key insights can be drawn. The strategy demonstrates a profit factor of 1.77, indicating that for every dollar risked, a profit of $1.77 was generated. The annualized return on investment (ROI) stands at an impressive 207.82%, suggesting significant profitability over the evaluated period. The average holding time for trades within this strategy is approximately 6 weeks and 5 days, reflecting a longer-term approach. With an average of 0.06 trades per week, this represents a relatively low frequency of trading. Out of a total of 18 closed trades, 61.11% were successful, showcasing a favorable winning trades percentage. Finally, the return on investment reached an astonishing 1039.12%.
ETHUSDT
Choose another period and try again.
ETH (Ethereum) Golden Cross Trading: Best Strategies and Tips
Introduction
The Golden Cross is a widely recognized bullish signal in technical analysis, often used to identify long-term uptrends. This strategy, when applied to Ethereum (ETH), can guide traders to pinpoint optimal entry points for profitable trades. In this guide, we explore how to effectively trade Ethereum using the Golden Cross, along with actionable strategies and tips.
What is the Golden Cross?
- Definition: A Golden Cross occurs when a short-term moving average (e.g., 50-period EMA) crosses above a long-term moving average (e.g., 200-period EMA), signaling potential bullish momentum.
- Key Components:
- Short-Term Moving Average (Fast): Reflects recent price trends.
- Long-Term Moving Average (Slow): Represents broader market sentiment.
Why Use the Golden Cross for Ethereum?
- Trend Confirmation: Validates the start of a sustained uptrend.
- Reliability: Historically effective across various assets, including cryptocurrencies.
- Ease of Use: Simple to implement and interpret.
How to Identify a Golden Cross in Ethereum:
- Apply Moving Averages:
- Use a 50-period EMA for short-term trends.
- Use a 200-period EMA for long-term trends.
- Spot the Crossover: A Golden Cross is formed when the 50 EMA crosses above the 200 EMA.
Golden Cross Trading Strategies for Ethereum:
1. Pure Golden Cross Strategy:
- Concept: Enter trades based solely on the occurrence of a Golden Cross.
- Setup:
- Apply 50 EMA and 200 EMA to Ethereum’s price chart.
- Execution Rules:
- Buy Signal: Enter long when the 50 EMA crosses above the 200 EMA.
- Sell Signal: Exit when the 50 EMA crosses back below the 200 EMA.
- Risk Management: Place a stop-loss below the nearest swing low.

2. Golden Cross with RSI Confirmation:
- Concept: Combine the Golden Cross with RSI to filter high-probability trades.
- Setup:
- Add RSI (14) to confirm momentum strength.
- Execution Rules:
- Buy Signal: Enter long when the Golden Cross occurs, and RSI is above 50.
- Sell Signal: Exit when RSI drops below 50 or the moving averages cross bearish.
- Enhancement: Use RSI divergence to anticipate trend reversals.
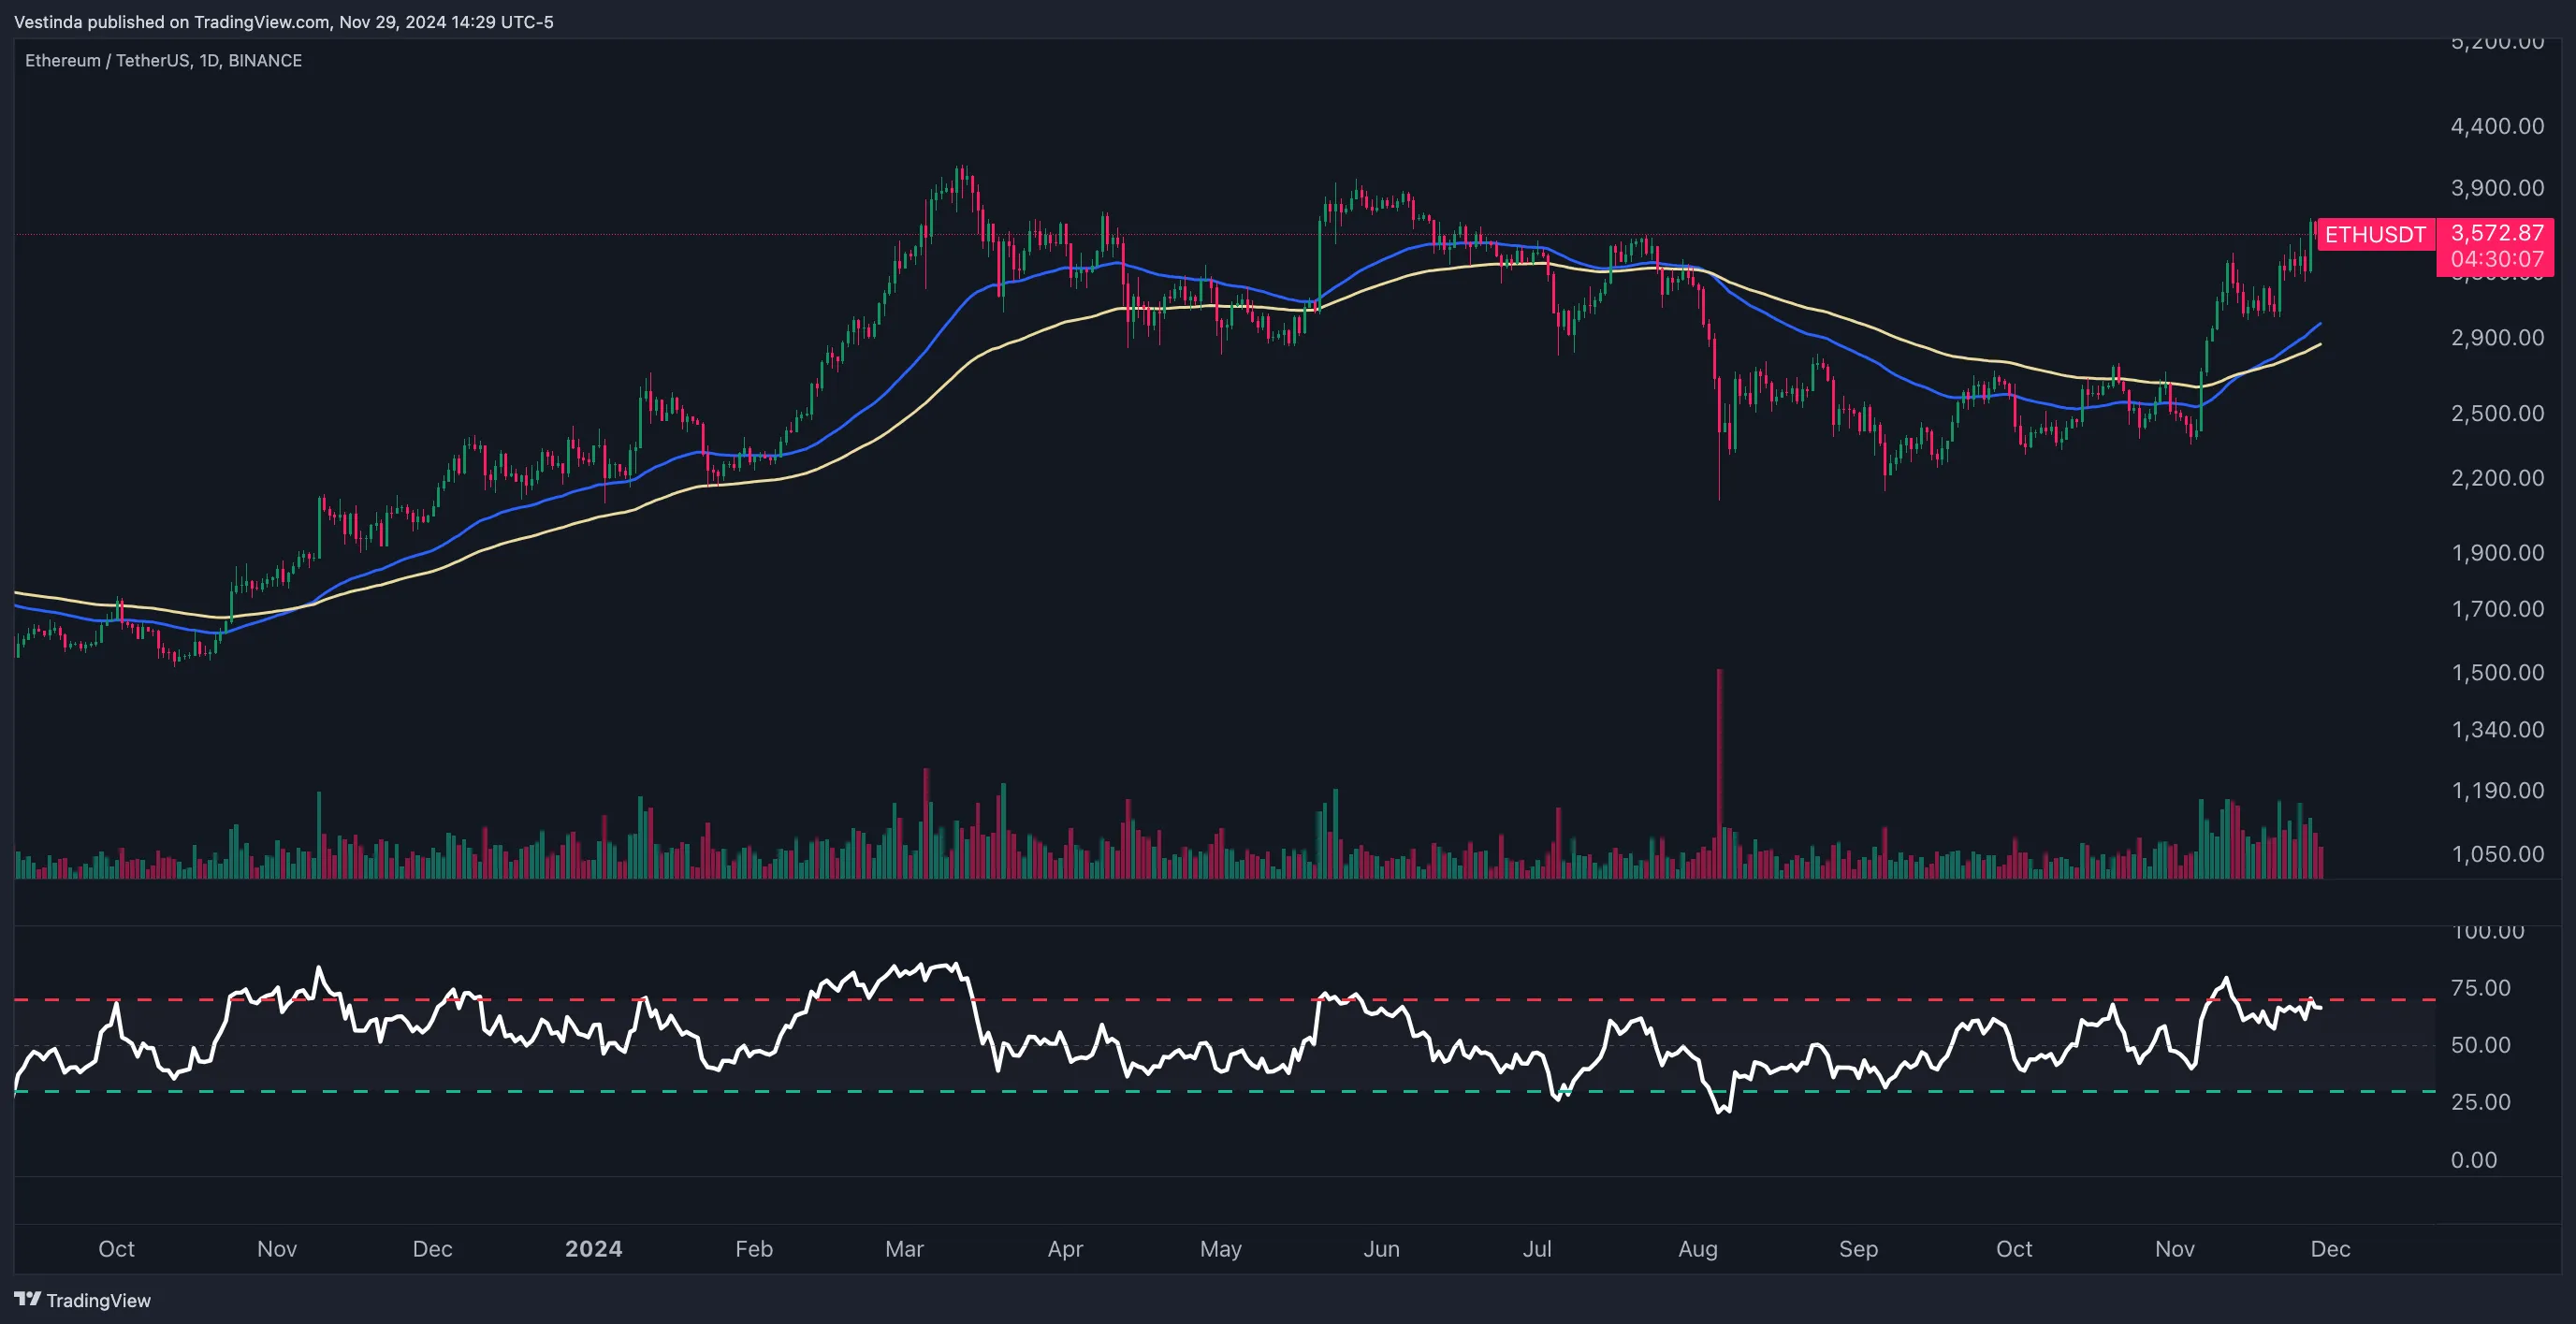
3. Breakout Trading with Golden Cross and Volume:
- Concept: Validate Golden Cross signals with breakout volume analysis.
- Setup:
- Add a volume indicator or VWMA (Volume Weighted Moving Average) to your chart.
- Execution Rules:
- Buy Signal: Enter long when the Golden Cross occurs with a volume spike above its average.
- Sell Signal: Exit when volume decreases significantly during an uptrend or price reaches key resistance.
- Risk Management: Use ATR (Average True Range) to set dynamic stop-loss levels.
4. Swing Trading with Support and Resistance:
- Concept: Trade ETH’s price swings near key levels after a Golden Cross.
- Setup:
- Identify horizontal support and resistance levels.
- Execution Rules:
- Buy Signal: Enter long when the Golden Cross forms, and price retraces to a support level with bullish confirmation.
- Sell Signal: Exit near the next resistance level.
- Enhancement: Combine with Fibonacci retracements for precise entries.
Tips for Trading Ethereum with the Golden Cross:
- Focus on Higher Timeframes: Golden Cross signals on daily or 4-hour charts are more reliable than shorter timeframes.
- Combine with Other Indicators: Use Supertrend or MACD to confirm bullish momentum.
- Monitor Volume: Ensure strong volume accompanies the crossover for higher signal validity.
- Set Realistic Targets: Use prior highs or Fibonacci extensions to define profit targets.
- Backtest and Optimize: Test the Golden Cross strategy on historical Ethereum data to refine parameters.
Common Mistakes to Avoid:
- Ignoring Market Context: Avoid trading Golden Crosses during sideways markets or low volatility.
- Overreliance on the Signal: Use additional indicators to confirm the signal and reduce false positives.
- Neglecting Risk Management: Always define your risk per trade and adhere to it.
Example (Without Specific Prices):
- Scenario: Ethereum is forming a Golden Cross on the daily chart.
- Strategy:
- Confirm with RSI showing bullish momentum above 50.
- Enter long after the crossover with a stop-loss below the last swing low.
- Target the next resistance level or use a trailing stop to capture extended gains.
Conclusion:
The Golden Cross is a robust and straightforward strategy for trading Ethereum. When combined with indicators like RSI, volume, or support and resistance levels, it becomes a powerful tool for identifying profitable opportunities. Discipline, backtesting, and risk management are key to maximizing the potential of this strategy.
Mastering ETH's Golden Cross Trading Strategy
- Access a chart of the ETH price to identify a Golden Cross formation.
- Observe the 50-day moving average (MA) line crossing above the 200-day MA line.
- Confirm this signal by studying the price action and overall market conditions.
- Potentially open a long position, anticipating a bullish price trend for ETH.
- Place a stop-loss order to limit potential losses if the trend reverses abruptly.
- Monitor the price closely to evaluate the efficacy of the Golden Cross strategy.
- Consider taking profits when the price seems to stall or exhibit signs of reversal.
Volume's Signal Confirmation Power: Unleashing ETH Potential
When it comes to confirming signals in trading, volume plays a crucial role. A sudden surge in volume indicates strong buying or selling pressure, providing validation to a price move. High volume confirms the strength of a trend, making it more reliable. For example, if the price of ETH starts rising, but the volume remains low, it may indicate weak demand and a potential price reversal. On the other hand, if both price and volume increase together, it suggests a strong uptrend and reinforces the bullish signal. Conversely, a decline in volume during a price rise or fall can be a warning sign of a weakening trend, indicating that the price move may not be sustainable. Therefore, analyzing volume alongside price action can help traders make more informed decisions and increase their probability of success.
Profitable ETH Investments: Harnessing the Golden Cross
The golden cross, a widely used technical indicator in stock trading, can also be applied to Ethereum (ETH) investment decisions. The golden cross occurs when the 50-day moving average crosses above the 200-day moving average, signaling a bullish trend. Traders and investors often interpret this as a buy signal, suggesting that the price is likely to rise. However, it is important to note that the golden cross is not foolproof and should be used in conjunction with other indicators and analysis methods. Additionally, historical performance does not guarantee future results, so caution is advised when making investment decisions based solely on this indicator. Ultimately, it is crucial to do thorough research and consider various factors before making any investment decisions involving ETH or any other asset.
ETH Volatility & Risk Mitigation Strategies
Volatility and risk management are crucial in the world of cryptocurrency investing. With the ETH market experiencing frequent price fluctuations, understanding volatility is essential. Volatility refers to the rapid and significant changes in price within a short period. Such volatility can result in substantial losses if not efficiently managed. Implementing effective risk management strategies is necessary to mitigate potential losses. This involves diversifying one's portfolio by investing in different assets and setting stop-loss orders to limit downside risks. Investors should also stay updated on market trends and news that may impact ETH prices. By closely monitoring market conditions and applying risk management techniques, investors can navigate the volatile ETH market with more confidence.
ETH: Spotting the Lucrative Golden Cross
Identifying a Golden Cross on ETH Charts can indicate a bullish trend change. A Golden Cross occurs when the 50-day moving average (MA) crosses above the 200-day MA. This crossover is seen as a strong buy signal by many traders and investors. It suggests that the short-term momentum is improving and that the longer-term trend is becoming more positive. The 50-day MA is a measure of recent price movements, while the 200-day MA represents a longer-term average. When these two MAs intersect, it indicates a shift in sentiment and a potential trend reversal. Traders often look for confirmation from other technical indicators and price action before making trading decisions based on a Golden Cross, but it can be a valuable tool in identifying potential buying opportunities in ETH.






Frequently Asked Questions
During periods of high market volatility for ETH, the Golden Cross can be a useful indicator. It occurs when the 50-day moving average (MA) crosses above the 200-day MA, indicating a bullish signal. This can help investors identify potential uptrends in the price of ETH. However, it's important to note that during high volatility periods, the market can be unpredictable and the Golden Cross may not always provide accurate signals. It is recommended to use this indicator in conjunction with other technical and fundamental analysis tools to make well-informed investment decisions.
Yes, the Golden Cross is a technical analysis signal that occurs when a shorter-term moving average crosses above a longer-term moving average. This bullish signal suggests a potential trend reversal or continuation. However, it does not specifically indicate trend exhaustion. To determine trend exhaustion in ETH, other technical indicators, such as RSI or MACD divergence, volume analysis, or price patterns, should be considered in conjunction with the Golden Cross signal.
A Golden Cross is a bullish technical pattern in Ethereum (ETH) trading. It occurs when the short-term moving average, typically the 50-day moving average, crosses above the long-term moving average, usually the 200-day moving average. This crossover indicates a potential upward trend and is often seen as a buy signal by traders. The Golden Cross suggests that the ETH price may continue rising in the near future, prompting investors to enter long positions. However, traders must consider other factors and indicators to confirm the reliability of this pattern before making any investment decisions.
Yes, the Golden Cross pattern can often indicate a potential double bottom or double top in ETH. This pattern occurs when the short-term moving average (such as the 50-day moving average) crosses above the long-term moving average (such as the 200-day moving average). It suggests a bullish trend and can signal the end of a downtrend or the start of an uptrend. However, it is important to consider other technical indicators and analyze the market conditions thoroughly before making any trading decisions.
Conclusion
In conclusion, ETH Golden Cross Trading is a popular strategy among cryptocurrency traders looking to capitalize on the potential growth of Ethereum. The EMA golden cross, where the EMA 50 crosses above the EMA 200, indicates a potential upward trend in the price of ETH. Traders use charts to identify this pattern and make informed trading decisions. Confirming signals in trading is crucial, and volume plays a significant role in validating price moves. Additionally, implementing risk management strategies and understanding volatility are crucial when investing in the volatile ETH market. Overall, identifying a Golden Cross on ETH charts can indicate a bullish trend change and present potential buying opportunities for traders.

Successful traders rely on backtesting to be profitable.
Be like them with our
Free Backtesting Guide