-
Track your
Crypto Portfolio -
Copy Crypto trading
strategies -
Build trading strategies
with no code
-
Backtest trading strategies
on Crypto, Forex, Stocks, etc. -
Demo Trading
Risk-free Paper Trading -
Automate trading strategies
with Live Trading
Quant Strategies & Backtesting results for APA
Here are some APA trading strategies along with their past performance. You can validate these strategies (and many more) for free on Vestinda across thousands of assets and many years of historical data.
Quant Trading Strategy: Three White Soldiers and Three Black Crows with Trailing SL on APA
The backtesting results for the trading strategy during the period from November 3, 2022, to November 3, 2023, reveal some interesting statistics. The profit factor stands at 1.23, indicating that for every dollar risked, the strategy generated $1.23 in profit. The annualized return on investment (ROI) was measured at 2.62%, implying a modest yet consistent growth rate. The average holding time for trades was approximately 1 day and 6 hours, suggesting a short-term trading approach. With an average of 0.26 trades per week, it appears to be a relatively low-frequency strategy. Out of the 14 closed trades, 42.86% were winners. Moreover, the strategy outperformed the buy and hold approach, generating excess returns of 20.17%.
 APA
APA

Choose another period and try again.
Quant Trading Strategy: Template - Moving Momentum Trend following and MACD Cross on APA
During the backtesting period from October 3, 2023, to November 3, 2023, the trading strategy yielded some concerning statistics. The annualized return on investment (ROI) stood at -47.03%, indicating significant losses over the period. On average, positions were held for approximately 2 weeks and 3 days, suggesting a relatively short-term trading approach. Furthermore, the strategy only executed an average of 0.22 trades per week, indicating limited trading activity. The number of closed trades amounted to only 1, which demonstrates a low level of engagement. Additionally, the return on investment for the period amounted to -4%, further highlighting the poor performance. Lastly, the winning trades percentage was 0%, signifying that none of the trades executed during the period resulted in profits. These results indicate the need for rigorous evaluation and potential adjustments to enhance the strategy's profitability.
APA
Choose another period and try again.
Golden Cross: APA Usage Step-By-Step
- Understand the concept of the Golden Cross as a bullish trend signal.
- Identify the two moving averages to use, typically the 50-day and 200-day moving averages.
- Plot the moving averages on a stock chart to visually observe the crossover.
- Observe when the 50-day moving average crosses above the 200-day moving average.
- Confirm the Golden Cross signal by analyzing other technical indicators and market conditions.
- Consider taking a long position or increasing current holdings in the stock.
- Set stop loss levels to manage potential downside risks.
Mastering APA Corporation (APA) Golden Cross Trading: How the EMA 50/200 Strategy Can Enhance Your Stock Market Gains
Introduction
APA Corporation (APA) is a prominent player in the stock market, making it an attractive target for traders looking to capitalize on market movements. One of the most popular and effective trading strategies for APA is the Golden Cross, specifically using the 50-day and 200-day Exponential Moving Averages (EMA). This article will guide you through the fundamentals of the APA Golden Cross Trading strategy and how to use it to spot potential buying opportunities.
What is the Golden Cross?
Definition: A Golden Cross occurs when a shorter-term moving average (in this case, the 50-day EMA) crosses above a longer-term moving average (the 200-day EMA). This crossover is seen as a bullish signal, indicating a potential upward trend.

Why EMA? The Exponential Moving Average (EMA) gives more weight to recent price data, making it more responsive to market changes compared to the Simple Moving Average (SMA).
Why Use the EMA 50/200 Cross for APA?
- Historical Success: The EMA 50/200 cross has been widely used by traders to identify long-term trends in stocks like APA.
- Simplicity and Reliability: This strategy is easy to implement and has a strong track record of signaling sustainable upward momentum.
Setting Up the APA Golden Cross Trading Strategy
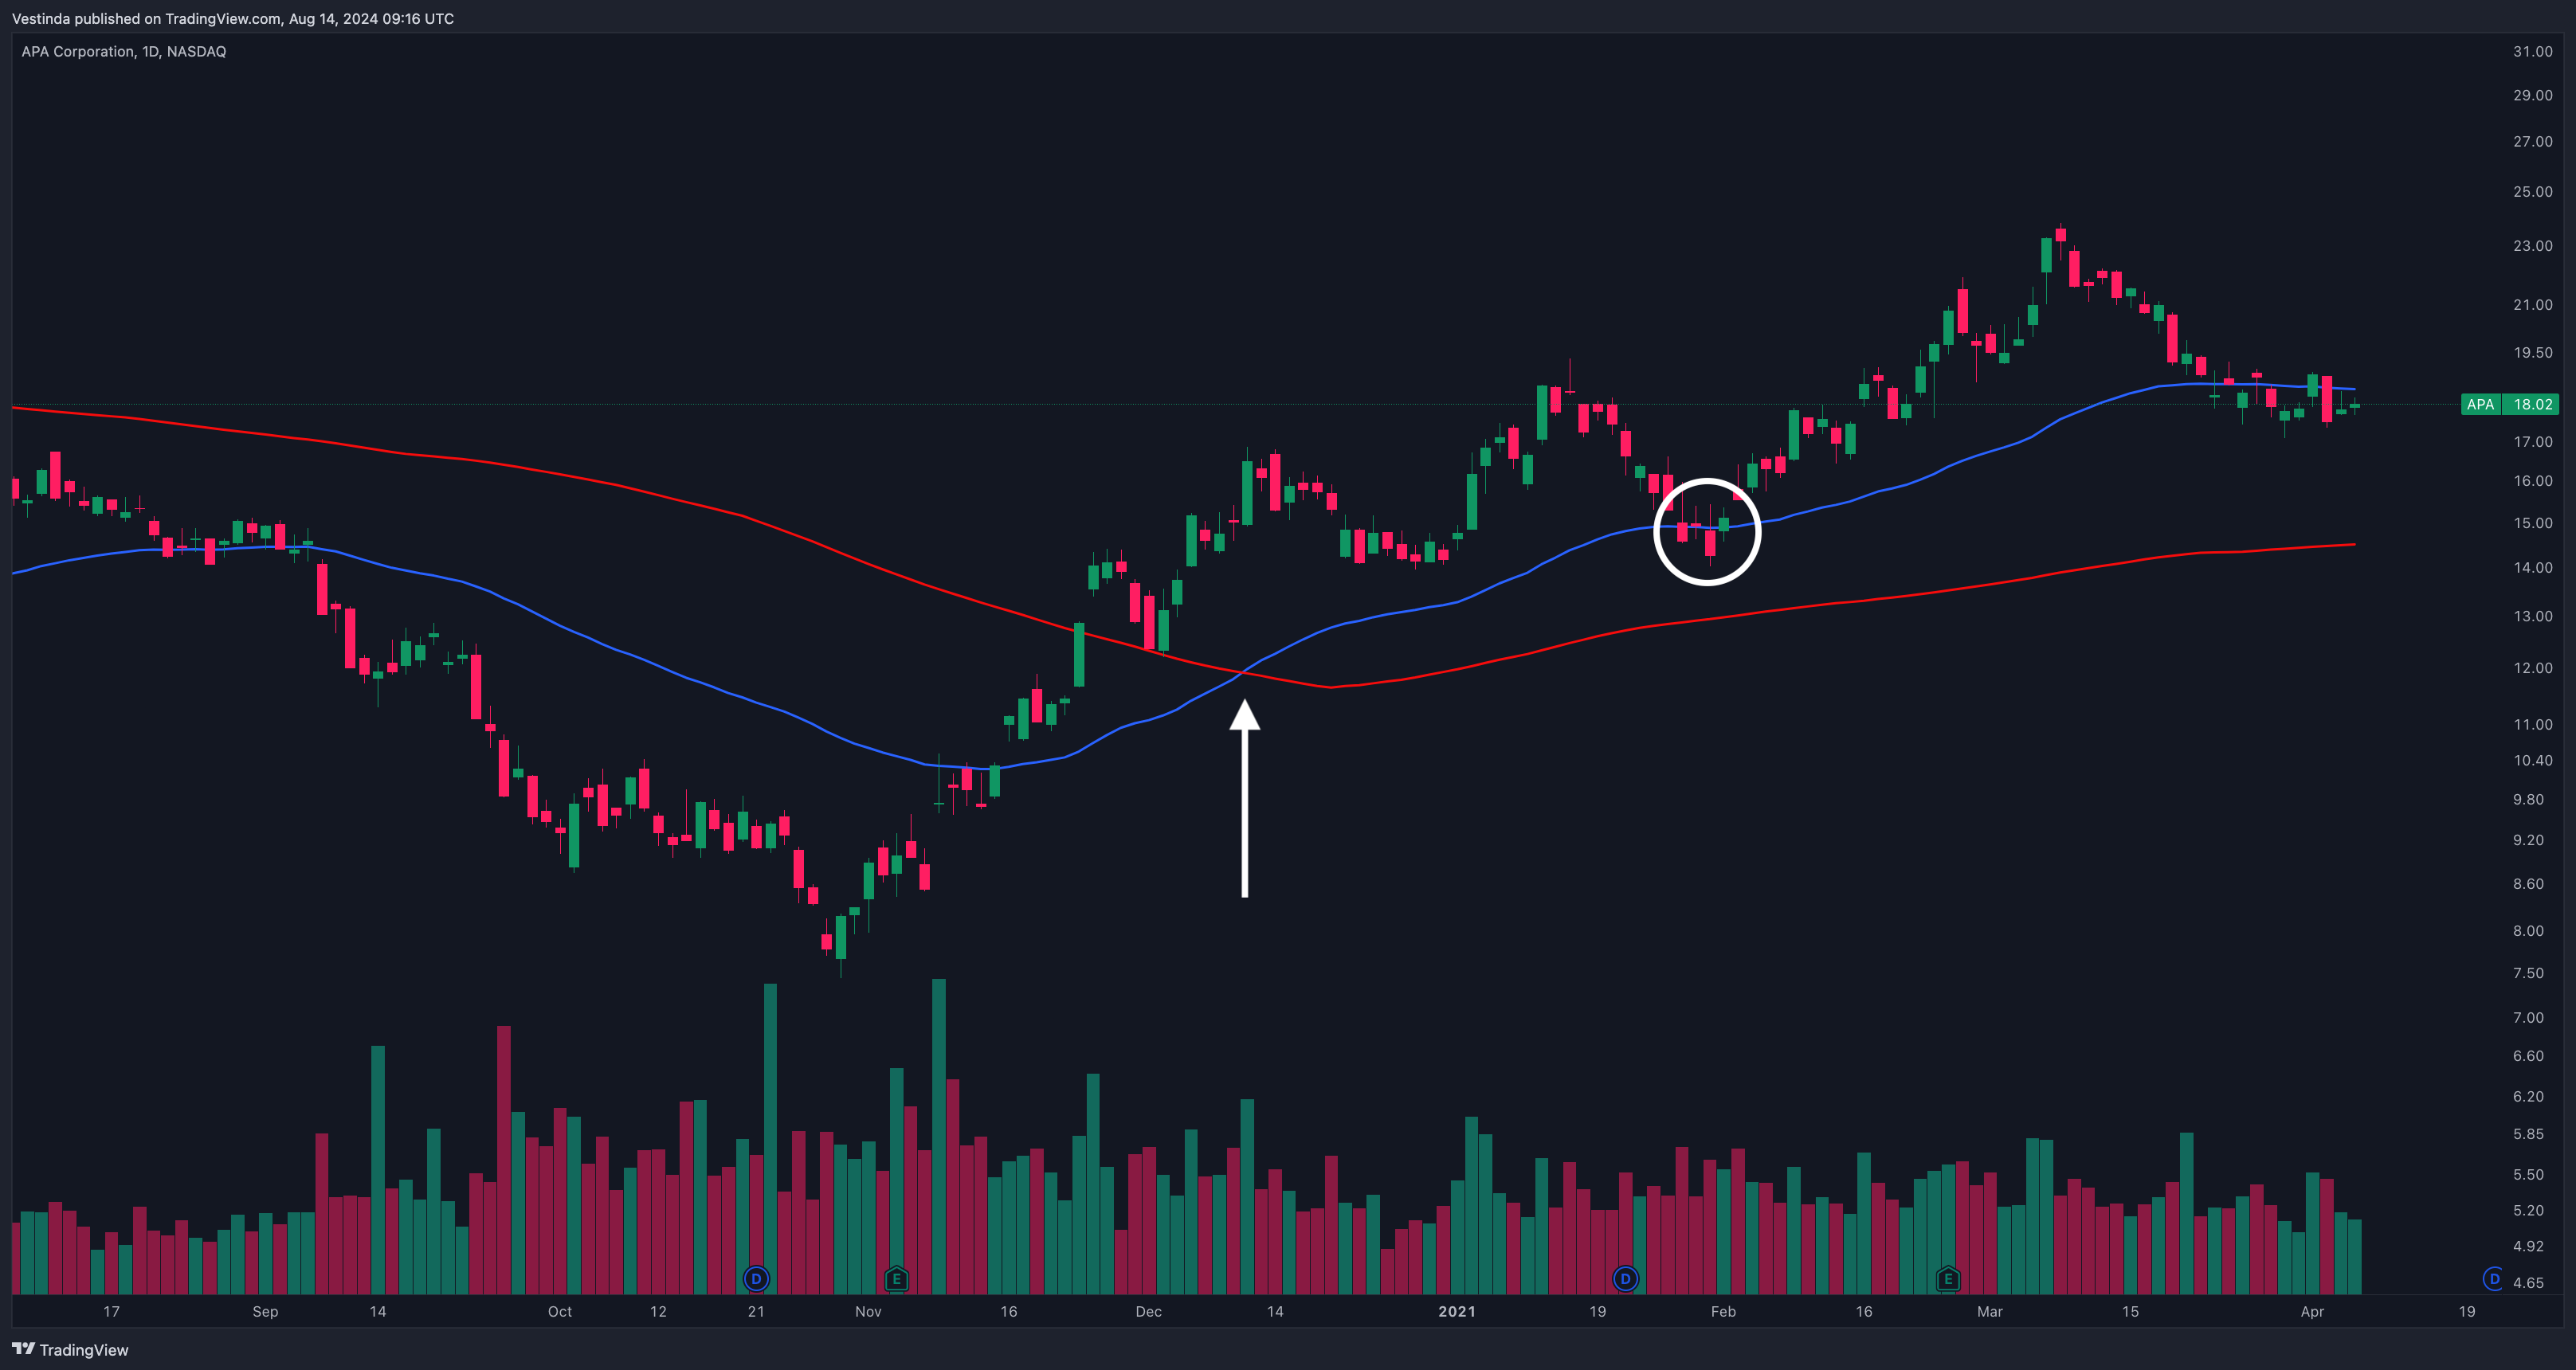
- Plot the EMAs: On your trading platform, plot the 50-day and 200-day EMAs on the APA Corporation (APA) stock chart.
- Identify the Cross: Watch for the 50-day EMA to cross above the 200-day EMA. This crossover is your signal to consider entering a buy position.
- Confirmation: Before entering a trade, confirm the signal with additional technical indicators or chart patterns to increase your confidence in the trade.
Using Vestinda to Implement and Backtest the Strategy
- Automate Your Strategy: Vestinda allows you to automate the APA Golden Cross Trading strategy, so you don't miss any trading opportunities.
- Backtest Your Approach: Utilize Vestinda’s backtesting feature to test the effectiveness of the EMA 50/200 cross on APA's historical data. This helps you fine-tune the strategy before applying it in a live trading environment.

Potential Risks and Considerations
- False Signals: While the Golden Cross is a strong indicator, no strategy is foolproof. Be mindful of potential false signals, especially during choppy or sideways markets.
- Market Conditions: The success of this strategy can depend on broader market conditions. It’s essential to be aware of macroeconomic factors that might influence APA's stock price.
Conclusion
The APA (Apa Corporation) Golden Cross Trading strategy using the EMA 50/200 cross is a powerful tool for identifying bullish trends. By implementing this strategy and utilizing Vestinda's backtesting capabilities, traders can increase their chances of making profitable trades. Remember, while the Golden Cross is a robust signal, it's always prudent to confirm with additional analysis and to continually refine your strategy based on backtesting results.
Enhancing Golden Cross Strategy with Complementary Indicators
Combining the Golden Cross with other indicators can provide stronger confirmation for potential market movements. For example, traders often use the Moving Average Convergence Divergence (MACD) indicator alongside the Golden Cross to identify potential entry and exit points. The MACD measures the relationship between two moving averages, providing insights into market momentum. Another indicator that can complement the Golden Cross is the Relative Strength Index (RSI), which measures the velocity and magnitude of price movements. By using a combination of indicators, traders can reduce the likelihood of false signals and increase the accuracy of their trading decisions. APA, being a leading corporation, understands the significance of incorporating multiple indicators for more effective market analysis and decision-making.
Cross Comparison: Golden vs. Death Crosses
The Golden Cross and the Death Cross are two common technical analysis patterns used in stock trading. The Golden Cross occurs when a short-term moving average crosses above a long-term moving average, signaling a potential bullish trend. On the other hand, the Death Cross occurs when a short-term moving average crosses below a long-term moving average, indicating a potential bearish trend. Both patterns are widely watched by traders as they can provide insights into market trends and potential entry or exit points. APA Corporation is a leading provider of gas exploration and production services, and its stock performance can be analyzed using these patterns. By understanding the differences between the Golden Cross and the Death Cross, traders can make informed decisions when it comes to investing in APA Corporation.
-
100,000 available assets New
-
years of historical data
-
practice without risking money

Frequently Asked Questions
During periods of high market volatility, the Golden Cross trading strategy may not perform as effectively for APA (Apache Corporation) due to frequent and unpredictable price fluctuations. The Golden Cross strategy relies on the 50-day moving average crossing above the 200-day moving average as a signal to buy. However, during volatile market conditions, these moving averages may cross over multiple times, generating false signals and leading to potential losses. Traders should be cautious when applying the Golden Cross strategy to APA during periods of high market volatility and consider utilizing additional technical indicators or adjusting their trading strategy accordingly.
Yes, there are several Golden Cross trading courses and tutorials available for APA (All-Purpose Annuity) enthusiasts. These resources provide comprehensive training on how to identify and utilize the Golden Cross trading strategy specifically for APA investments. They cover topics such as chart analysis, risk management, and entry/exit points, empowering enthusiasts to make informed investment decisions. These courses and tutorials can be found online through various educational platforms and financial websites, offering the opportunity for APA enthusiasts to enhance their trading skills and capitalize on the Golden Cross strategy.
Yes, the Golden Cross can be used for automated trading strategies in APA (All Publicly Available) markets. The Golden Cross is a technical indicator that occurs when a short-term moving average crosses above a long-term moving average. It is commonly used to identify bullish market trends. By programming automated systems to trigger buy signals when a Golden Cross is detected, traders can capitalize on potential upward price movements. However, it is important to note that no trading strategy is foolproof, and careful consideration of other factors is recommended for successful automated trading.
The Golden Cross, a technical analysis indicator that occurs when a short-term moving average crosses above a long-term moving average, is primarily used for identifying bullish trends in trading. While it can be a useful tool for entry and exit points, it is not specifically designed for risk management. Risk management in APA (Automated Portfolio Allocation) trading typically involves employing techniques such as stop-loss orders, diversification, position sizing, and risk-reward analysis. These methods focus on reducing potential losses and maximizing profits, whereas the Golden Cross is more suited for trend identification.
The Golden Cross, a technical analysis indicator, may not necessarily show strong performance during APA flash crashes. Flash crashes refer to sudden, extreme market declines followed by rapid recovery. The Golden Cross, which occurs when a short-term moving average crosses above a long-term moving average, focuses on longer-term trends. During flash crashes, short-term price movements can be highly volatile and may not adhere to the longer-term trends analyzed by the Golden Cross. Therefore, its effectiveness in predicting or mitigating flash crashes may be limited.
Conclusion
In conclusion, APA (Apa Corporation) Golden Cross Trading is a popular strategy that utilizes the EMA golden cross to identify potential buying opportunities in the stock market. Traders plot the Golden Cross Trading charts and look for bullish signals when the 50-day EMA crosses above the 200-day EMA. However, it's important to be aware of false signals and limitations of the golden cross, as it is not a foolproof indicator. Combining the golden cross with other indicators like MACD and RSI can provide stronger confirmation for potential market movements. APA Corporation understands the significance of incorporating multiple indicators for more effective market analysis and decision-making. Overall, the Golden Cross Trading strategy can be a useful tool for traders, including those interested in investing in APA Corporation.

Successful traders rely on backtesting to be profitable.
Be like them with our
Free Backtesting Guide