
-
 Create
account -
 Build trading strategies
with no code -
 Validate
& Backtest -
 Connect exchange
& start earning
Algorithmic Strategies & Backtesting results for ADA
Here are some ADA trading strategies along with their past performance. You can validate these strategies (and many more) for free on Vestinda across thousands of assets and many years of historical data.
Algorithmic Trading Strategy: Keltner Channel and ZLEMA Trend-Following on ADA
The backtesting results for the trading strategy during the period from November 20, 2018, to November 20, 2023, have produced promising statistics. The profit factor stands at 1.43, indicating a positive return on investment. The annualized ROI is an impressive 108.81%, showcasing the strategy's potential for generating substantial profits over time. On average, the holding time for trades is approximately 1 week and 4 days, suggesting a balanced approach between short-term and longer-term investments. Moreover, the average number of trades executed per week is 0.18, implying a conservative and calculated trading approach. During the testing period, a total of 48 trades were closed, with a remarkable return on investment of 544.07%. However, the winning trades percentage seems to be relatively low at 25%, which might indicate room for improvement in terms of trade selection or risk management. Overall, these backtesting results demonstrate the potential effectiveness and profitability of the trading strategy.

 ADAUSDT

Choose another period and try again.
Algorithmic Trading Strategy: ATR Breakout Strategy on ADA
Based on the backtesting results statistics for the trading strategy from November 20, 2018, to November 20, 2023, the strategy has shown promising performance. The profit factor stands at 1.23, indicating that for every dollar invested, a profit of $1.23 was generated. The annualized return on investment (ROI) stands considerably high at 231.25%, implying significant profitability over the tested period. The average holding time for trades was found to be 16 weeks, with an average of 0.03 trades per week. A total of 10 trades were closed within the given timeframe. The strategy resulted in a 50% winning trades percentage. Moreover, the strategy outperformed the buy and hold approach, generating excess returns of 55.11%. These results showcase the strategy's potential for generating substantial profits and surpassing the market's performance.
ADAUSDT
Choose another period and try again.
ADA (Cardano) Backtesting: Unlocking Evidence-Based Insights for Success
Introduction
Backtesting is a crucial step in developing successful trading strategies, enabling traders to evaluate their methods using historical data. For a volatile and highly traded asset like Cardano (ADA), backtesting provides evidence-based insights into strategy performance, risk management, and potential profitability. This guide explores the importance of backtesting, tools, and best practices to optimize your ADA trading strategies.
What is Backtesting?
- Definition: Backtesting involves applying a trading strategy to historical price data to evaluate its performance under past market conditions.
- Purpose: Identifies strengths and weaknesses in strategies before deploying them in live markets, saving time and money.
- Key Benefit: Provides statistical confidence in your approach, helping refine decision-making and execution.
Why Backtest ADA Trading Strategies?
- Validate Strategy Effectiveness: Ensure your trading approach works consistently across different market conditions.
- Optimize Indicator Settings: Fine-tune parameters like EMA periods, RSI thresholds, or MACD crossovers for ADA’s unique price behavior.
- Risk Management Testing: Assess stop-loss, take-profit, and position-sizing rules to minimize drawdowns and maximize returns.
Core Steps to Backtest ADA Strategies
1. Define Your Trading Strategy
Example: Use a moving average crossover strategy with a 20-period EMA and a 50-period EMA for trend following.
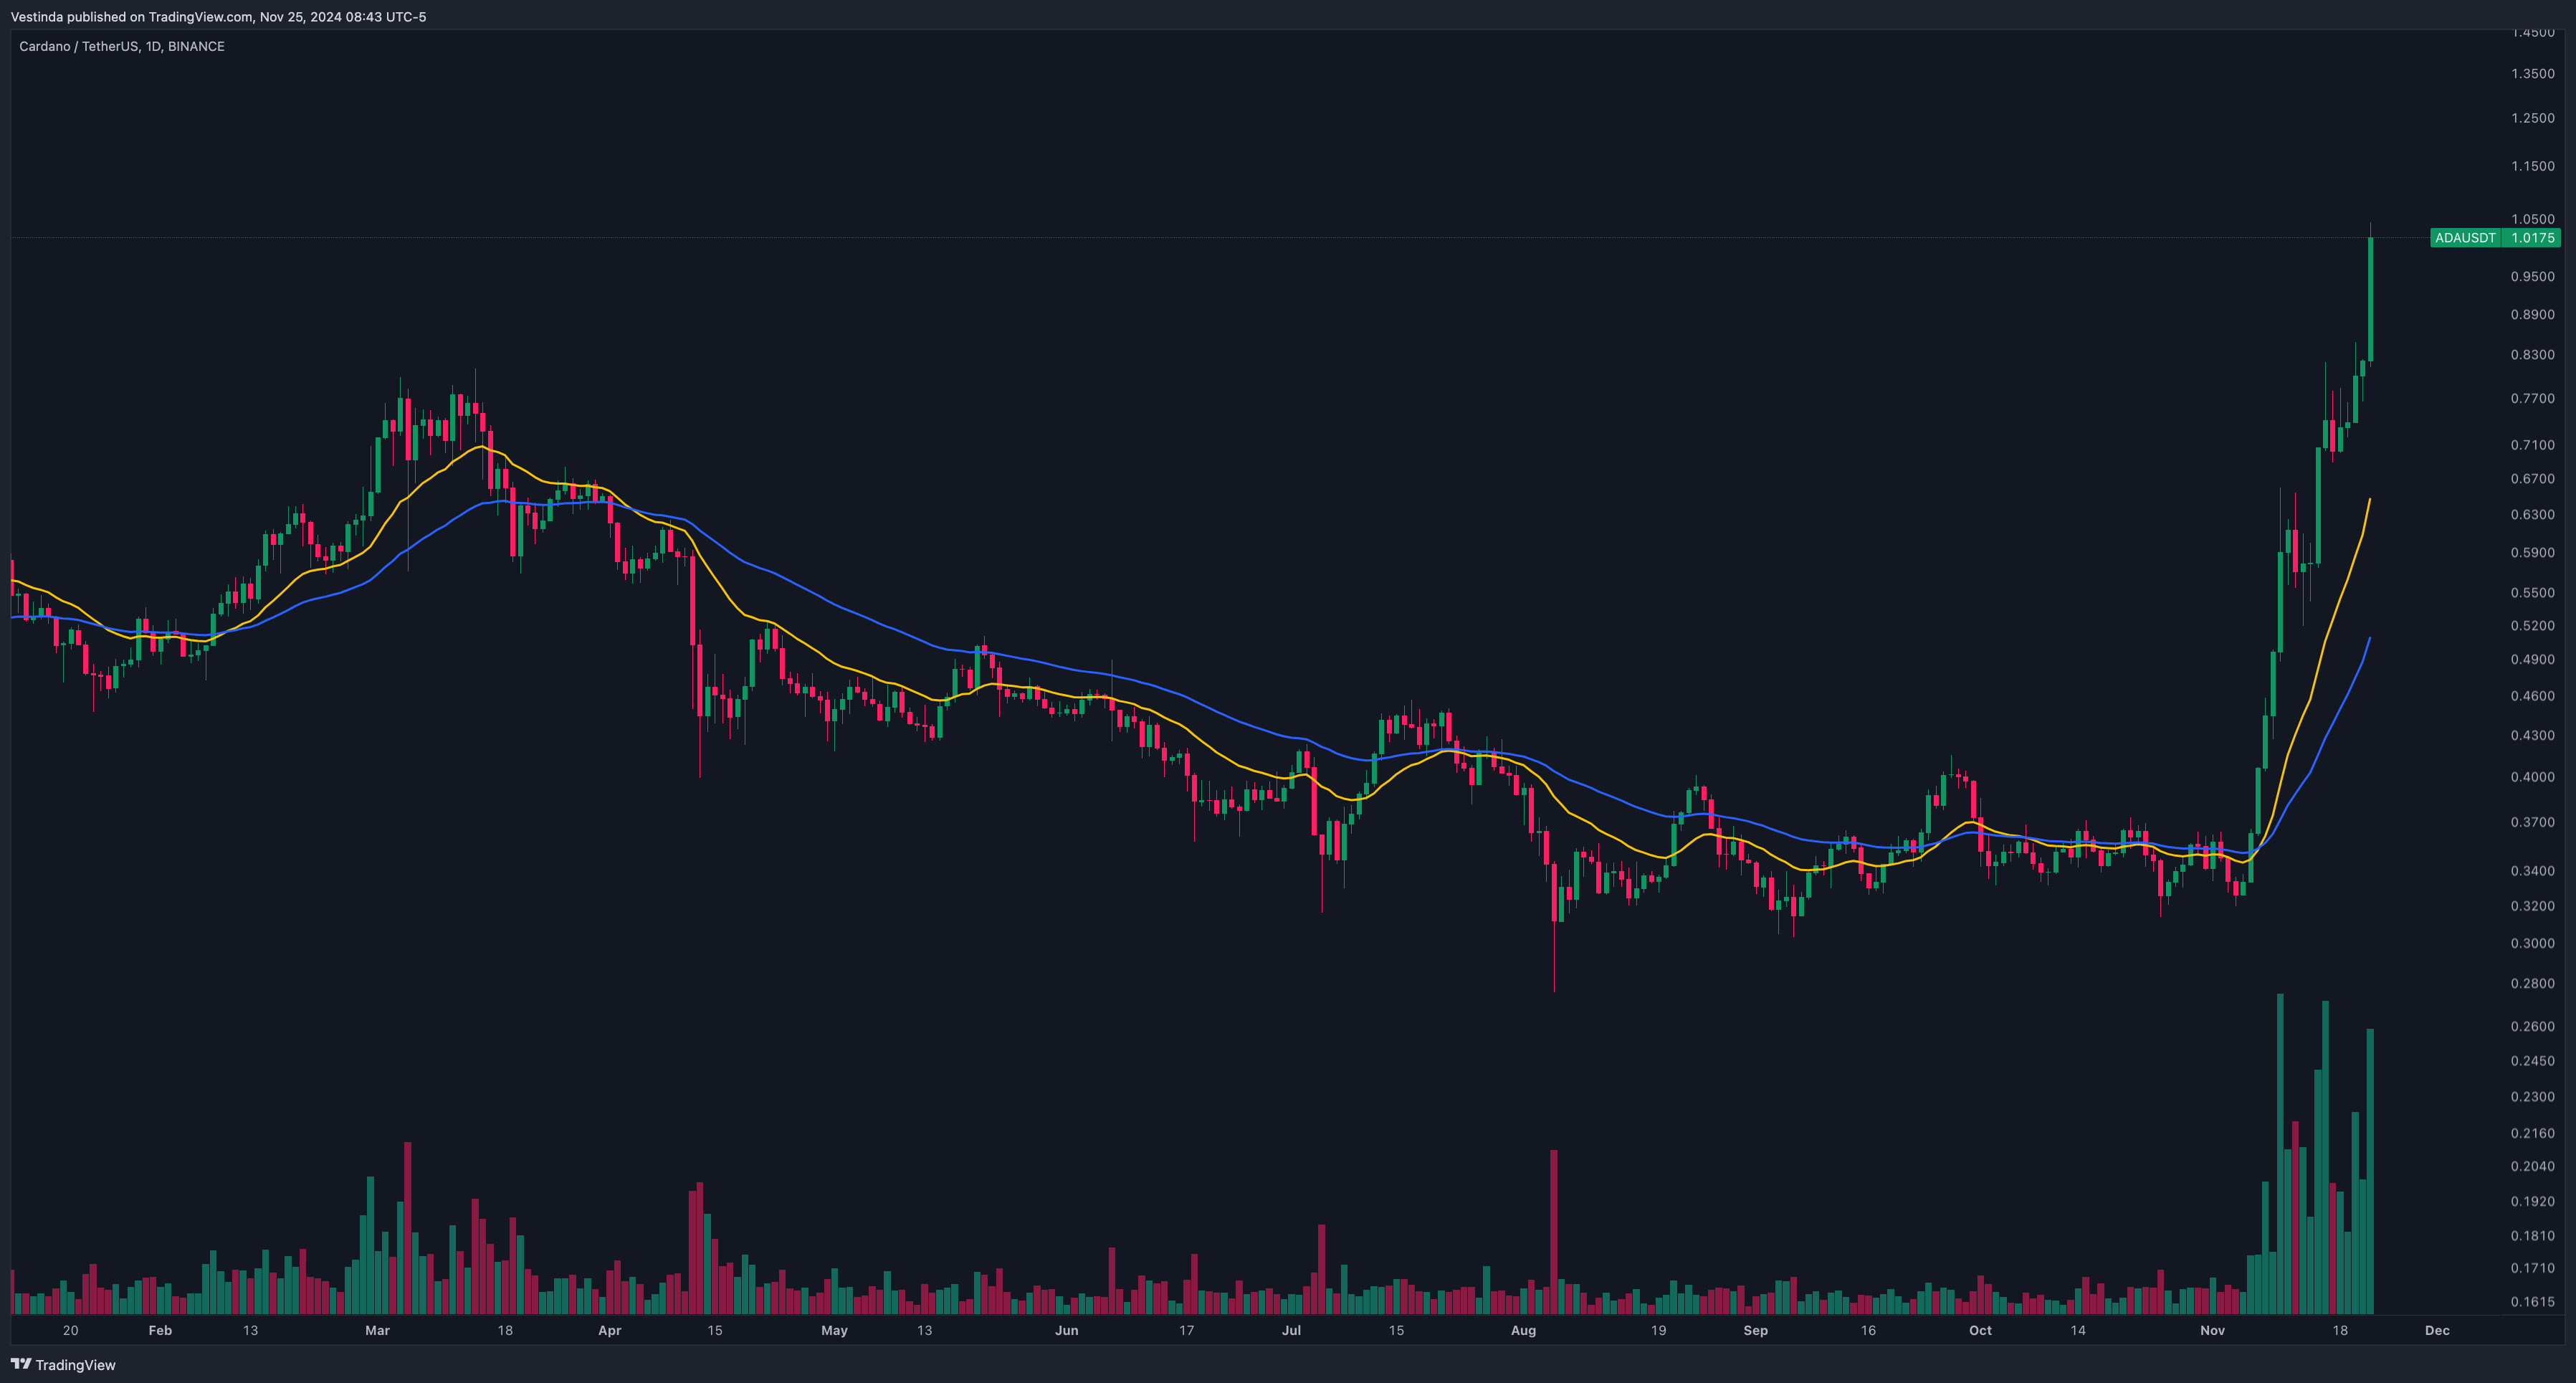
Entry/Exit Rules: Enter long when the 20 EMA crosses above the 50 EMA; exit when it crosses below.
2. Select Backtesting Tools
- Manual Backtesting: Use platforms like TradingView to simulate trades on historical ADA price charts.
- Automated Backtesting: Leverage algorithmic tools or software to test strategies efficiently over large datasets.
3. Analyze Historical Data
Use ADA’s historical price data from various timeframes (e.g., 1H, 4H, Daily) to simulate trades and evaluate performance.
4. Record Results
- Win Rate: Percentage of profitable trades.
- Average Return Per Trade: Average profit or loss for each trade.
- Maximum Drawdown: Largest percentage drop in portfolio value during testing.
Key Strategies to Backtest with ADA
1. Trend-Following with MACD
Setup: Use the MACD indicator (12, 26, 9) to identify trend momentum.
Entry/Exit Rules: Enter long on bullish MACD crossovers; exit or short on bearish crossovers.
Backtesting Tip: Analyze performance on 4H and Daily timeframes for better trend clarity.
2. RSI-Based Reversal Strategy
Setup: Apply RSI with a 14-period to detect overbought (above 70) and oversold (below 30) conditions.
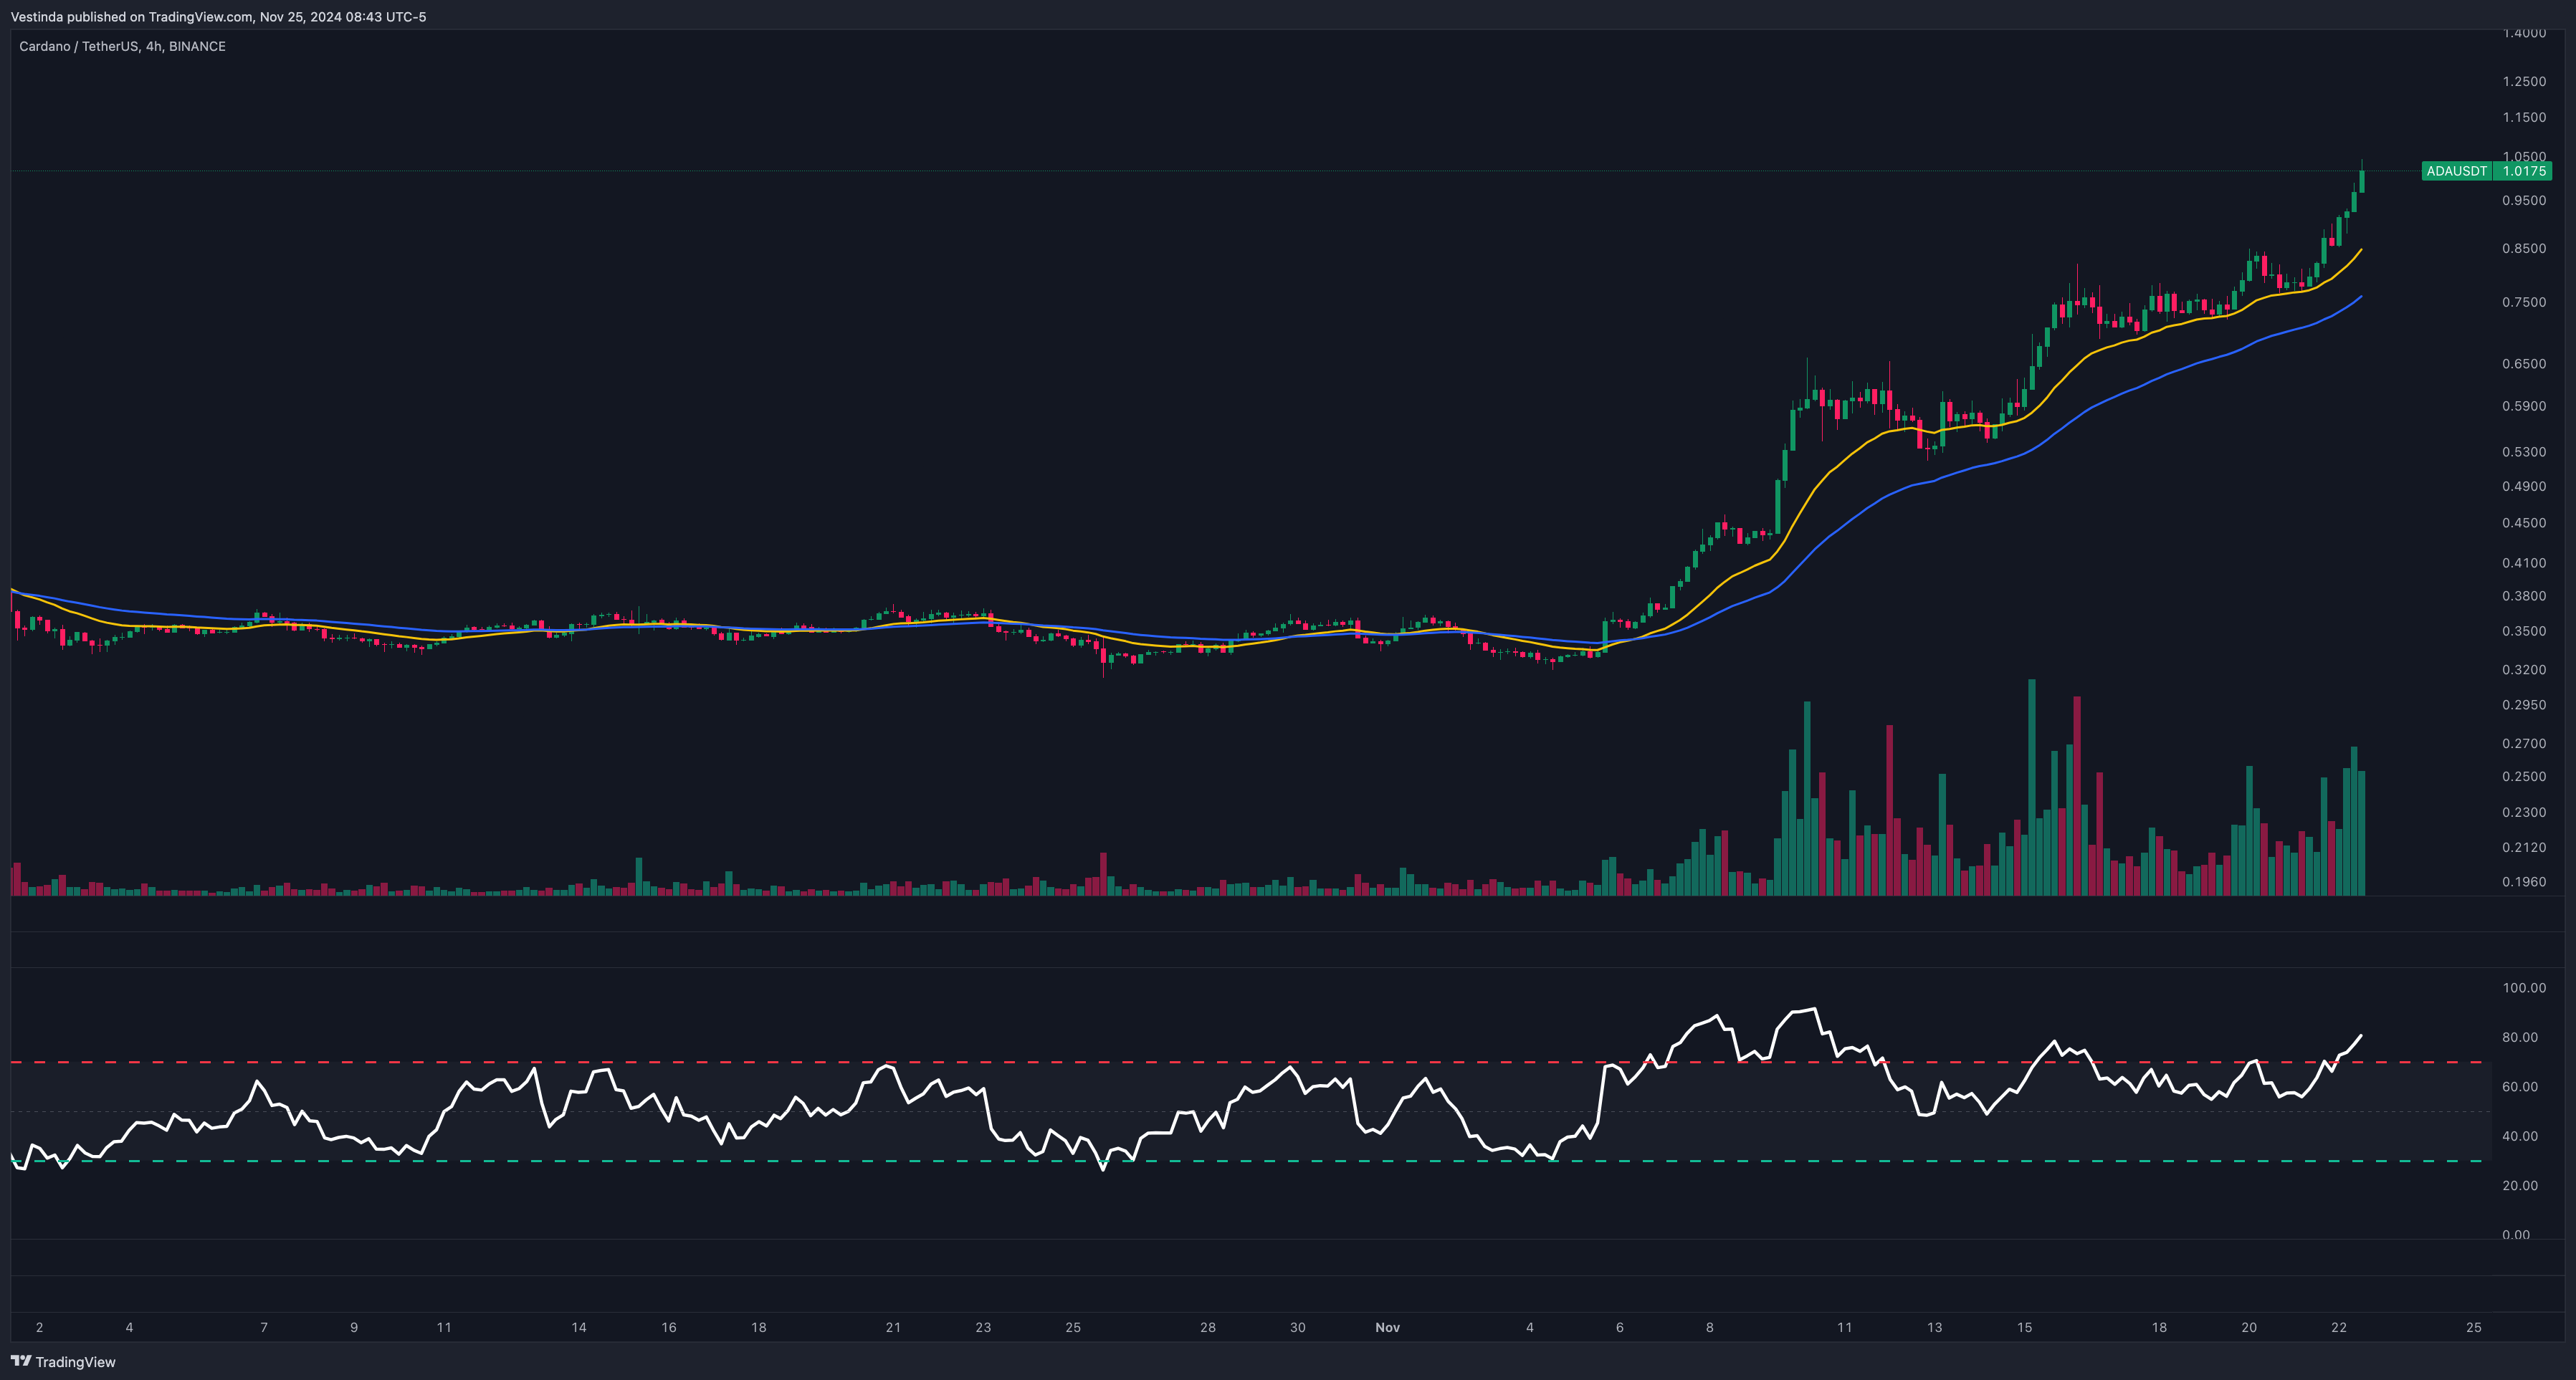
Entry/Exit Rules: Enter long when RSI drops below 30 and rises back above it; short when RSI crosses below 70 from above.
Backtesting Tip: Combine RSI signals with candlestick patterns for added precision.
3. Bollinger Bands for Range Trading
Setup: Use Bollinger Bands (20-period SMA, 2 standard deviations) to trade ADA within a range.
Entry/Exit Rules: Buy at the lower band and sell at the upper band; short at the upper band and cover at the lower band.
Backtesting Tip: Focus on low-volatility periods for this strategy.
Best Practices for Effective Backtesting
1. Test Across Different Market Conditions
Evaluate strategy performance during bull, bear, and sideways markets to ensure robustness.
2. Use Sufficient Data
Backtest over at least six months of historical data to capture diverse market scenarios.
3. Incorporate Transaction Costs
Factor in trading fees and slippage to reflect real-world conditions.
4. Track Key Metrics
Analyze Sharpe Ratio, profit factor, and other performance indicators to gauge strategy effectiveness.
Tools for Backtesting ADA Strategies
1. TradingView
Ideal for manual backtesting with customizable charts and indicators.
2. Algorithmic Platforms
Use tools like MetaTrader, NinjaTrader, or Python-based libraries (e.g., Backtrader) for automated testing.
3. Crypto-Specific Platforms
Consider CoinMarketCap or CryptoCompare for ADA-specific historical data.
Conclusion
Backtesting is a powerful way to refine your ADA trading strategies, offering data-driven insights to improve performance and reduce risk. By combining trend-following methods, RSI-based reversals, and Bollinger Band strategies with robust backtesting techniques, traders can confidently approach the dynamic Cardano market. Regular optimization ensures strategies remain effective, helping traders stay ahead in this competitive space.
Backtesting ADA: A Simple Step-by-Step Guide
- Obtain historical price data for ADA from a reliable cryptocurrency data source.
- Select a timeframe for the backtest, such as the past year or a specific period.
- Choose a backtesting platform or software that supports ADA. Examples include TradingView or custom scripts.
- Develop a backtesting strategy by defining entry and exit conditions using technical indicators and/or price action analysis.
- Implement the backtesting strategy on the chosen platform, specifying the start and end dates.
Effective ADA Options Backtesting Strategies
Backtesting strategies for ADA options trading is crucial for success in the marketplace. By backtesting, traders can evaluate their trading ideas and see how they would have performed in the past. This helps traders understand the potential profitability and risk associated with their strategies.
To backtest ADA options trading strategies, traders can use historical price data to simulate trades and analyze the outcome. This allows them to identify patterns, trends, and potential trading opportunities.
Traders can also adjust parameters and variables within their strategies to see how they would have performed under different market conditions. This enables them to fine-tune their strategies and optimize their trading approach.
Overall, backtesting strategies for ADA options trading helps traders make informed decisions based on historical data, reducing the element of guesswork and increasing the likelihood of success.
ADA Backtesting: Unraveling Common Misconceptions
One common misconception about ADA backtesting is that it guarantees future success. ADA backtesting involves simulating trades using historical data to assess the performance of a trading strategy. However, it does not guarantee that the strategy will be profitable in the future. The market conditions and dynamics can change, rendering the backtest results less relevant. Another misconception is that backtesting can accurately predict future market behavior. While ADA backtesting can help identify patterns and trends, it cannot predict future price movements with certainty. The market is influenced by various factors, including news, market sentiment, and economic events, which cannot be accurately captured in a backtest. It is essential to use backtesting as a tool for strategy evaluation and improvement, but it should not be solely relied upon for making trading decisions.
Cardano Options Spreads: Effective Backtesting Techniques
Backtesting strategies for ADA options spreads is crucial for proper risk management and decision-making. By simulating trade scenarios using historical data, it helps traders gauge the effectiveness and profitability of their chosen strategies. During this process, traders should consider factors such as entry and exit points, position sizing, and various market conditions. Incorporating backtesting tools and platforms allows for the evaluation of the strategy's performance, assessing potential risk-reward ratios, and refining the approach. It is important to note that backtesting is not a guarantee of future results, but it can provide valuable insights to inform trading decisions. ADA options spreads backtesting provides a systematic and data-driven approach to optimize trading strategies effectively.
Long-Term ADA Historical Backtesting Assessment
When evaluating long-term historical trends in ADA backtesting, it is crucial to consider multiple factors. Firstly, analyzing price movements and volatility over extended periods provides insights into market behavior. Furthermore, understanding Cardano's technological advancements and developments enables a comprehensive evaluation. Examining ADA's historical performance in relation to other cryptocurrencies may identify underlying patterns or correlations. It is important to consider how external factors, such as regulatory changes or global economic events, may have influenced ADA's price. Additionally, evaluating long-term historical trends helps identify market cycles and potential forecasting indicators. By combining both quantitative and qualitative analyses, investors can gain a more accurate understanding of ADA's long-term performance and make informed investment decisions.






Frequently Asked Questions
Yes, backtesting can be performed on different time frames for ADA (Cardano). Backtesting involves analyzing historical data to evaluate the performance of a trading strategy. Traders can use various time frames like daily, weekly, or even intraday intervals to assess the effectiveness of their strategies on different scales. By testing strategies across different time frames, individuals can gain insights into ADA's price movements and develop more reliable trading approaches tailored to their preferred time frame.
To backtest an ADA trading algorithm using Python, start by obtaining historical ADA price data. Import the necessary libraries such as pandas and numpy. Develop the trading algorithm using technical indicators and trading rules. Execute the algorithm by iterating through the historical data. Track portfolio performance, calculate profits/losses, and evaluate risk metrics. Finally, analyze and optimize the algorithm based on backtesting results. Ensure to handle issues like transaction fees and slippage. Python's matplotlib can be utilized for visualizing the backtest results.
To perform backtesting in MT5, follow these steps. Firstly, open the Strategy Tester panel by clicking on View -> Strategy Tester or pressing Ctrl + R. Select the Expert Advisor (EA) you want to test, choose the trading instrument and timeframe, and set the desired test parameters. Then click Start to begin the backtest. After completion, view the results including equity curves, trade statistics, and other relevant data. MT5's Strategy Tester also allows for advanced testing using different optimization parameters and visualization modes to assess the performance of EAs on historical data.
To backtest a low-latency trading strategy for ADA, consider the following steps. Firstly, gather historical ADA price data and relevant market indicators. Next, develop a strategy based on specific criteria, such as technical analysis or fundamental factors. Apply the strategy to the historical data, simulating trades and tracking performance. Assess important metrics like profit/loss ratio, win rate, and risk management. Finally, analyze the results to evaluate the strategy's effectiveness and refine it if necessary. Remember to account for transaction costs, slippage, and other real-world factors.
Conclusion
In conclusion, ADA (Cardano) backtesting is a powerful tool that allows traders to evaluate the performance of their trading strategies using historical market data. By simulating trades and analyzing the results, traders can gain valuable insights into the potential profitability and risk associated with their strategies. However, it is important to remember that backtesting does not guarantee future success or accurately predict market behavior. It should be used as a tool for strategy evaluation and improvement, alongside other factors such as market conditions and news events. By incorporating backtesting into their trading arsenal, traders can make more informed decisions and optimize their trading approach for ADA (Cardano).

Successful traders rely on backtesting to be profitable.
Be like them with our
Free Backtesting Guide