
Navigate the world of active buying and selling in financial markets. Explore various trading styles, risk management, and market psychology crucial for successful trading endeavors.

Have you ever wondered if order blocks can unlock the key to trading success? In this article, “Order blocks in trading: Are they profitable?” We’ll explore the potential of this intriguing trading concept. Order blocks are clusters of orders that can influence price movements and reveal market sentiment. Understanding their formation and impact could provide traders with a strategic edge.

We’ll get into the basics of order blocks, examine their effectiveness, and analyze their profitability in various market conditions. By the end, you’ll have a clearer picture of whether incorporating order blocks into your trading strategy is worth the effort. Join us as we uncover the mysteries behind this powerful trading tool and its potential to boost your trading performance.

What are order blocks in trading?

Order blocks in trading are significant clusters of orders that accumulate at specific price levels, reflecting the activity of large institutional traders. These blocks often mark areas where substantial buying or selling interest exists, which can influence price movements and act as key support or resistance levels. By identifying order blocks, traders can gain insights into market sentiment and potential price reversals or continuations.

Order Blocks Examples:

How to Order Blocks in Trading

Order blocks represent areas where large orders from institutional traders are placed, causing significant changes in price direction. These blocks are crucial as they indicate areas of high liquidity and strong market interest, often aligning with support and resistance levels.

These blocks are typically formed when institutions execute large orders in chunks to avoid significant market impact. Understanding and leveraging order blocks can provide traders with strategic entry and exit points, enhancing their ability to predict market movements and make informed trading decisions. This approach requires keen observation and analysis of price action and volume data to identify these critical zones.

How do order blocks work?

Order blocks work by reflecting the accumulation of large buy or sell orders at specific price levels, typically placed by institutional traders. These large players, such as hedge funds and banks, execute their substantial trades in chunks to avoid creating significant market impact, thus forming order blocks. When these blocks are identified, they indicate strong areas of support or resistance. Traders can use this information to anticipate potential price movements.

When price approaches an order block, it may either bounce back, indicating a reversal, or break through, signaling a continuation. This happens because order blocks represent significant liquidity zones where the balance between supply and demand is temporarily disrupted. If there is more buying interest, the price is likely to rise; if there is more selling interest, the price may drop. By analyzing the behavior of price around these blocks, traders can make informed decisions about their trades.

The identification of order blocks requires a thorough understanding of price action and volume analysis. Traders look for areas where the price has previously stalled or reversed, often marked by high trading volumes. These are the potential order blocks. Once identified, these blocks can serve as strategic points for placing trades.

For instance, a trader might place a buy order near a bullish order block, expecting the price to rise from that support level, or a sell order near a bearish order block, anticipating a decline. In summary, order blocks serve as critical tools for traders to gauge market sentiment and predict price movements, providing strategic entry and exit points based on the accumulation of large institutional orders. This approach enhances the trader’s ability to align with the underlying market forces.

Types of order block

Order blocks in trading can be categorized into various types based on their directional bias and significance in the market. Firstly, there are bullish order blocks, which form when there is a substantial accumulation of buy orders at a specific price level. These blocks indicate strong buying interest from institutional traders and often create support zones.

Bullish Order Block Example:

Bullish Order Blocks on Bitcoin Chart

In this chart, the bullish order block is highlighted, showing where significant buy orders have pushed the price up. This area can act as a strong support level in future price movements.

Traders identify bullish order blocks by observing areas on the chart where the price has previously paused or reversed upwards with notable trading volumes. Conversely, bearish order blocks represent a significant accumulation of sell orders at a particular price level. These blocks signal strong selling interest from institutional traders and typically create resistance zones.

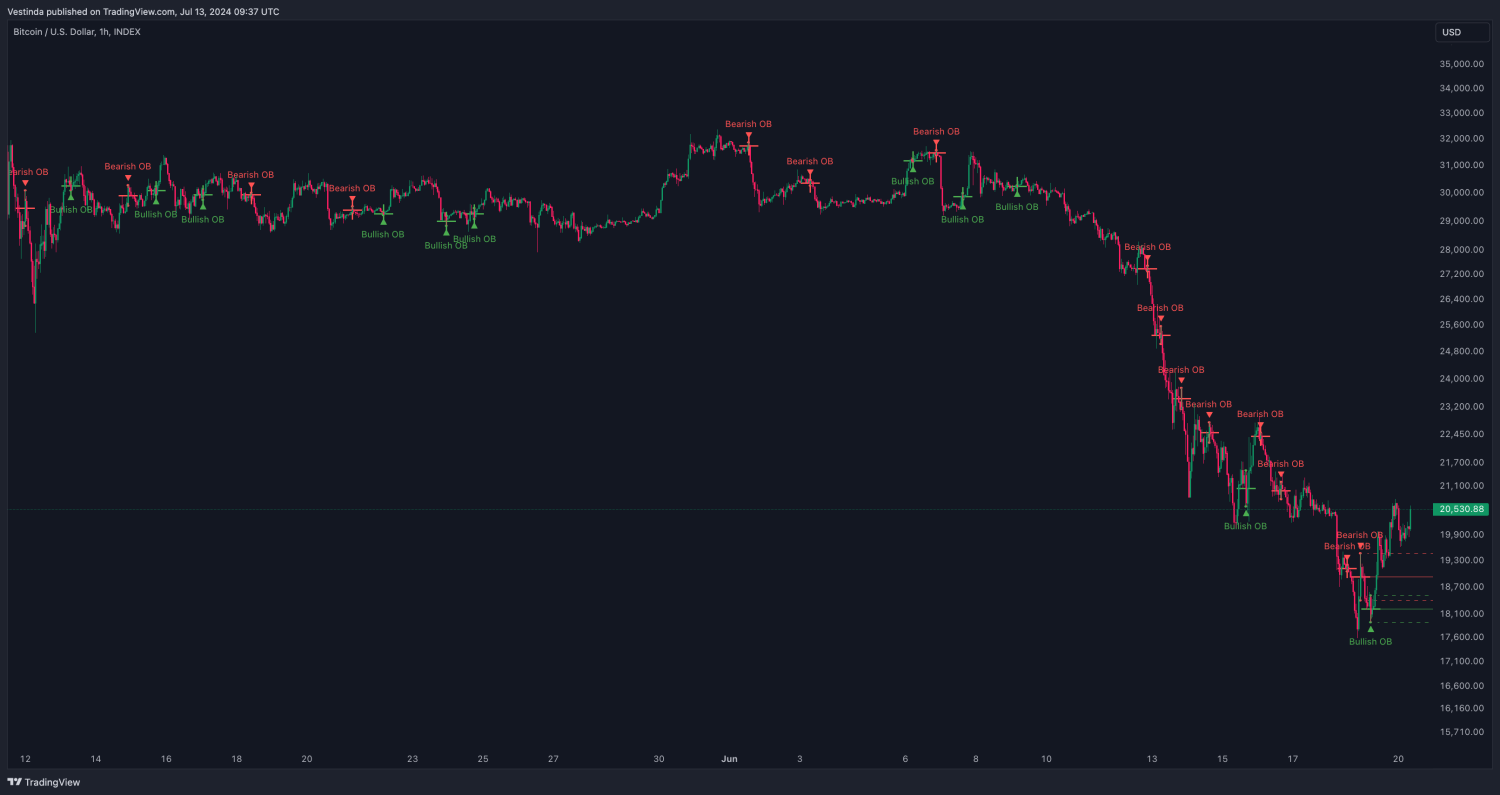
Bearish Order Block Example:
Bearish Order Blocks on Bitcoin

This chart highlights a bearish order block, where substantial sell orders have driven the price down. This area can act as a strong resistance level in future price movements.

Traders identify bearish order blocks by looking for areas where the price has previously stalled or reversed downwards with significant volume. In addition to directional bias, order blocks can also be classified based on their significance. Major order blocks occur on longer timeframes, such as daily or weekly charts, and involve larger volumes and institutional activity.

Minor order blocks, on the other hand, form within smaller timeframes and may not have as significant an impact on price movements. Understanding the different types of order blocks allows traders to make more informed decisions in their trading strategies.

By recognizing these patterns, traders can anticipate potential price movements and identify strategic entry and exit points in the market. This knowledge empowers traders to navigate the dynamic nature of the financial markets more effectively, increasing their chances of success.

Example of an order block

Imagine you’re a forex trader analyzing the price chart of a currency pair. As you zoom out to the daily timeframe, you notice a significant downtrend that has been in place for several weeks. However, amidst the downward movement, you spot a distinct area where the price briefly stalled before continuing its descent. This area represents an order block.

Upon closer inspection, you observe that during this consolidation phase, there was a notable increase in trading volume, indicating significant market activity. Traders who recognize this pattern may interpret it as a sign of accumulation by institutional players, suggesting a potential reversal in the prevailing trend.

As the price retraced to this level in the future, you witnessed a sudden surge in buying interest, causing a rapid reversal in price direction. This order block now acts as a crucial support zone, where buyers have previously shown strong interest. Traders who identify this order block may strategically place buy orders near this level, anticipating another bounce upwards when the price revisits the block.

In this scenario, the order block serves as a pivotal point on the price chart, influencing future price action and providing valuable insights for traders. By identifying and understanding such order blocks, traders can make informed decisions and capitalize on potential trading opportunities in the market.

Are order blocks profitable?

The profitability of order blocks depends on various factors, including the trader’s ability to accurately identify and interpret them, as well as market conditions. While order blocks can provide valuable insights into market sentiment and potential price reversals, they are not guaranteed to result in profitable trades. Successful trading requires careful analysis, risk management, and the ability to adapt to changing market dynamics.

Traders who effectively incorporate order blocks into their trading strategies and combine them with other technical and fundamental analysis tools may find them to be profitable. However, like any trading strategy, there are risks involved, and traders should conduct thorough research and practice proper risk management to increase their chances of success.

Are order blocks the same as supply and demand?

Order blocks and supply and demand zones are related concepts in trading but are not exactly the same. Order blocks refer to areas on a price chart where institutional traders have placed significant buy or sell orders, causing the price to stall or reverse. These blocks indicate where large trading volumes have occurred, suggesting future price action might react similarly when revisiting these levels.

Bullish Order Block Acting as a Demand Zone:

In this chart, the bullish order block coincides with a demand zone. Notice how the price respects this area and reverses upwards.

Bearish Order Block Acting as a Supply Zone:
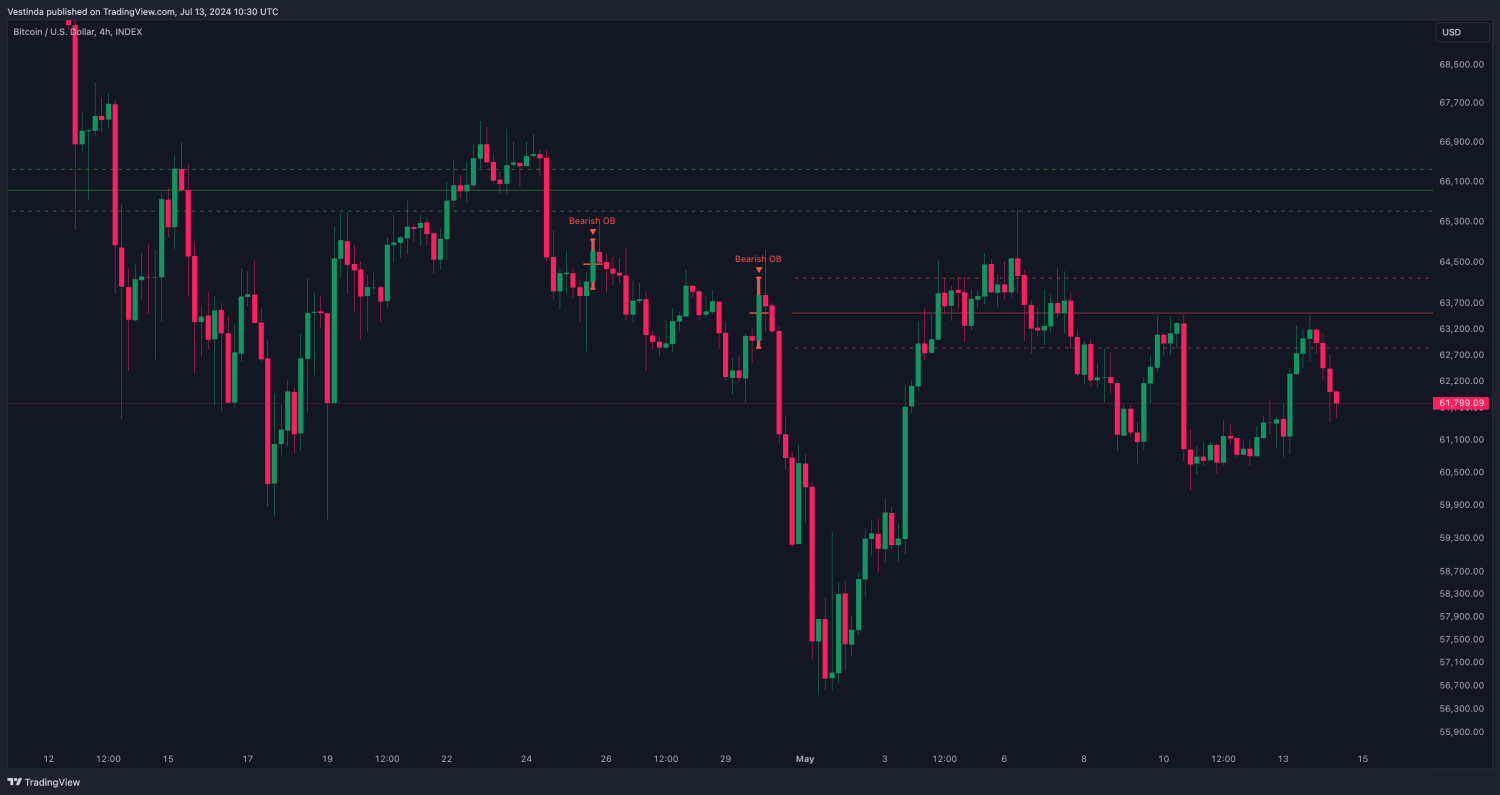
Here, the bearish order block aligns with a supply zone. The price struggles to break through this area and reverses downward.

Supply and demand zones, on the other hand, are broader areas where buying and selling pressures have historically caused price reversals. Supply zones are regions where selling pressure outweighs buying pressure, leading to price declines, while demand zones are areas where buying pressure exceeds selling pressure, causing price increases.

In essence, order blocks can be considered a more specific manifestation of supply and demand principles, highlighting the exact block levels where institutional activities are concentrated.

How do you calculate order blocks?

Calculating order blocks involves identifying key areas on a price chart where significant buying or selling activity has occurred, often leading to price reversals or consolidations. To calculate order blocks, traders typically start by examining historical price data to pinpoint areas of consolidation, where the price has paused before a significant move. These areas are often characterized by high trading volume, indicating strong market interest.

Next, traders look for price patterns that signal the presence of large institutional orders, such as engulfing candles or strong price rejections at specific levels. These patterns can help identify the boundaries of the order block. Once the order block is identified, its high and low price levels are marked on the chart.

Traders then monitor these levels for future price action, expecting that the price may react similarly when revisiting the order block. This approach combines technical analysis with volume analysis to accurately identify potential order blocks.

What time frame is best for order blocks?

The best time frame for identifying order blocks depends on the trader’s strategy and trading style. For long-term traders, higher time frames like daily or weekly charts are preferred, as they provide a broader view of market trends and significant levels of institutional activity. These time frames help in identifying major order blocks that can influence price movements over extended periods.

For short-term traders or day traders, lower time frames such as 1-hour or 4-hour charts are more suitable. These shorter intervals allow traders to pinpoint intraday order blocks and capitalize on shorter-term price fluctuations. Ultimately, the choice of time frame should align with the trader’s overall strategy and risk management approach, ensuring consistency in identifying and trading order blocks.

In the fast-paced world of trading, ensuring your strategy can withstand market volatility is crucial. This is where a “stress test” comes into play. In this article, “How to stress test a trading strategy in 2024,” we delve into the methods and importance of subjecting your trading approach to rigorous evaluation.

We’ll explore the key components of a stress test, from simulating extreme market conditions to analyzing the impact on your portfolio. Whether you’re a seasoned trader or a novice, understanding how to stress test your strategy can be the difference between success and failure. Stay tuned as we guide you through the steps, tools, and best practices to fortify your trading strategy against unforeseen market challenges.

What is stress testing?

Stress testing is a technique used to evaluate the resilience of financial systems, portfolios, or trading strategies under extreme or unfavorable conditions. It involves simulating scenarios such as market crashes, economic downturns, or significant interest rate changes to observe how these stressors impact financial assets and strategies.

This process is crucial for traders, investors, and financial institutions as it aids in assessing the robustness of their strategies, ensuring better risk management, and preparing for unforeseen market events. Ultimately, stress testing provides valuable insights into the potential weaknesses and strengths of a financial strategy, allowing for informed decision-making and improved financial stability.

How to stress test a trading strategy

Learn how to stress test a trading strategy to ensure its robustness and resilience under various market conditions.

Vary Historical Data

Rather than relying solely on smooth historical periods, you should include data from times of crashes, corrections, and periods of high volatility. This approach helps you see how your strategy handles extreme market swings. By incorporating such varied data, you ensure that your strategy can survive and perform during market turbulence. Testing against different market conditions, such as the 2008 financial crisis or the COVID-19 pandemic crash, helps identify potential weaknesses and strengths in your approach.

This thorough examination can reveal how your strategy reacts under pressure, ensuring its robustness and reliability in real-world scenarios. Ultimately, varying historical data is essential for developing a resilient trading strategy capable of withstanding diverse and unpredictable market environments. This way, you can be more confident in your strategy’s ability to navigate future market volatility.

Randomize Entry/Exit Points

When stress testing a trading strategy, it’s vital to randomize entry and exit points. By simulating real-world execution issues and introducing slight randomization to these points, you can assess the strategy’s robustness. This approach accounts for potential slippage, which is the difference between the intended and actual price of an asset when a trade is executed. Randomizing entry and exit points helps evaluate how the strategy performs in imperfect conditions, such as fluctuating market liquidity or rapid price movements.

By subjecting the strategy to these scenarios, traders can gain insights into its ability to adapt and execute effectively in dynamic market environments. Ultimately, incorporating this element into stress testing enhances the strategy’s reliability and prepares traders for various trading conditions they may encounter.

Change Transaction Costs

These include commissions, spreads (the difference between buy and sell prices), and financing rates. Higher costs can significantly impact profitability, so factoring them in provides a clearer understanding of net returns. By adjusting transaction costs during stress testing, traders can assess how their strategy performs under different expense scenarios. This allows for better preparation and risk management in live trading conditions where costs can vary.

Additionally, understanding the impact of transaction costs enables traders to optimize their strategies for efficiency and profitability. Ultimately, considering transaction costs in stress testing ensures that the strategy’s performance evaluation is comprehensive and accounts for all relevant factors affecting profitability.

Adjust Position Sizing

By testing the strategy with various position sizes, traders can evaluate its performance under different risk parameters. This process helps identify potential overfitting to specific capital allocations, ensuring the strategy’s robustness across various investment levels.

For instance, a strategy that performs well with a small position size may encounter difficulties when scaled up to larger positions. Conversely, a strategy that relies on significant capital allocations may face challenges when used with smaller positions. By systematically adjusting position sizes during stress testing, traders can gain insights into how their strategy behaves under different risk levels.

This information is invaluable for optimizing position sizing in live trading scenarios and enhancing overall strategy performance and adaptability.

Introduce Random Delays

Markets operate with inherent order processing delays, and simulating these delays allows traders to evaluate how their strategy reacts to price movements that may occur after a signal is generated. By incorporating random delays, traders can better understand the impact of execution latency on their strategy’s performance.

This step provides insights into how the strategy handles real-world trading conditions, where orders may not be executed instantaneously. Understanding the behavior of the strategy under such circumstances is essential for making informed decisions about its suitability for live trading. Through stress testing with random delays, traders can refine their strategies to better navigate the challenges posed by execution timing and enhance overall performance in dynamic market environments.

Test on Different Assets

Rather than confining testing to a single asset class, such as stocks or forex, diversifying across different markets provides a broader perspective on the strategy’s performance. By applying the strategy to diverse assets, traders can assess its ability to withstand different price behaviors, volatility levels, and market dynamics.

This approach helps identify any inherent strengths or weaknesses in the strategy and allows for adjustments to optimize its effectiveness across a range of market environments. Ultimately, testing on different assets enhances the strategy’s versatility and resilience, preparing it to navigate through the complexities of various financial markets successfully.

Backtest with Vestinda

Vestinda employs advanced algorithms to simulate thousands of market scenarios, offering a comprehensive evaluation of your strategy’s performance across various conditions. By subjecting your strategy to a diverse range of simulated market movements, Vestinda enables you to assess its resilience and adaptability.

This approach provides insights into how your strategy may perform under different volatility levels, market trends, and economic conditions, helping you identify strengths and weaknesses. Furthermore, Vestinda’s sophisticated analytics allow for in-depth analysis, enabling you to refine and optimize your strategy effectively.

Incorporating Vestinda into your backtesting process empowers you to make more informed decisions, ultimately increasing the likelihood of achieving trading success in dynamic market environments.

How many years should you backtest a trading strategy?

The duration for backtesting a trading strategy typically depends on various factors, including the complexity of the strategy, the frequency of trades, and the market conditions it aims to navigate. However, a common recommendation is to backtest a strategy over a minimum of five years of historical data to ensure robustness and reliability.

This timeframe allows for the inclusion of diverse market cycles, economic conditions, and geopolitical events, providing a comprehensive assessment of the strategy’s performance.

Additionally, extending the backtesting period beyond five years can offer further insights into the strategy’s long-term viability and its ability to withstand changing market dynamics. Ultimately, the goal is to conduct thorough testing that encompasses a sufficient range of market scenarios to validate the strategy’s effectiveness and potential for success.

Looking to venture into the world of options trading? If so, learning how to sell options can be a lucrative strategy for beginners in 2024. While it may seem daunting at first, selling options offers unique advantages and opportunities for profit. I

n this comprehensive guide, we’ll walk you through the basics of selling options, covering everything from understanding option contracts to implementing effective trading strategies. You’ll learn how to select suitable underlying assets, choose the right strike prices and expiry dates, and manage risk effectively. By the end of this article, you’ll have the knowledge and confidence to start selling options and potentially generate consistent returns in the dynamic financial markets of 2024.

Steps on how to sell options for beginners

Discover essential strategies and tips to help you sell options with our comprehensive guide. Let’s dive in!

Understand Options Basics

Options are financial instruments offering the right, but not the obligation, to buy or sell an asset at a predetermined price before or at expiry. Calls confer the right to buy, while puts grant the right to sell. Understanding time decay is vital; options lose value as expiration approaches due to diminishing time for the underlying asset to move favorably.

This understanding aids in selecting appropriate strategies and strike prices. By comprehending these basics, beginners can navigate the options market more effectively and make informed decisions about when and how to sell options. Thus, a solid grasp of options basics serves as a foundational step for aspiring options sellers, facilitating their journey towards profitable trading.

Choose a Low-Risk Strategy

Opting for a low-risk strategy like covered calls is advisable for novice options sellers. Covered calls provide a controlled approach to trading by allowing you to collect premiums while mitigating potential downside risks. With this strategy, you sell call options on underlying assets that you already own. By doing so, you receive a premium from the buyer but commit to selling your shares at a predetermined price (the strike price) if the option is exercised before expiry.

This approach offers a level of protection since you already own the underlying asset, reducing the risk associated with the trade. As a beginner, starting with covered calls allows you to gain experience in options trading while limiting potential losses, making it a prudent choice to initiate your trading journey.

Select Underlying Assets Wisely

To navigate the world of options trading successfully, it’s crucial to make informed decisions about the underlying assets. Selecting the right stocks is paramount; opt for those you understand thoroughly and have a strong grasp of their market dynamics. Additionally, prioritize assets with good liquidity, ensuring seamless buying and selling transactions.

Conduct thorough research into the historical price movements of these stocks to gauge their behavior in different market conditions. Furthermore, delve into their future prospects, analyzing factors such as industry trends, company performance, and upcoming events that could impact their value. By carefully selecting underlying assets based on these considerations, beginner options sellers can mitigate risks and increase their chances of success in the market.

Plan Your Strike Price and Expiry

When planning your strike price and expiry for covered calls, it’s essential to strike a balance between risk and reward. Opting for a strike price slightly above the current market price can provide a buffer against potential losses while still allowing you to collect a premium. Starting with short expiry periods, typically a few weeks, can help minimize the impact of time decay, a critical consideration in options trading.

As a beginner, these strategies can offer a more controlled approach, allowing you to gain experience while managing risk. Over time, as you become more comfortable with options trading, you can explore different strike prices and expiry periods to tailor your approach to market conditions and your trading objectives. Remember, risk management is key, so always start small and gradually increase complexity as you gain confidence in your abilities.

Focus on Premium, Not Price Movement

As you sell options, your main source of profit is the premium you receive upfront. This premium is essentially payment from the buyer for the right to buy or sell the underlying asset at a predetermined price within a specified period. Unlike buying options with hopes of capitalizing on price swings, selling options allows you to profit from time decay and volatility.

Regardless of whether the underlying asset’s price moves significantly, you can still earn a profit as long as the option expires worthless or loses value over time. This approach emphasizes the importance of understanding options pricing and market dynamics to effectively capitalize on premium collection strategies. By prioritizing premium over price movement, you can build a more consistent and sustainable trading strategy.

Monitor Deltas Closely

Deltas indicate the rate of change in an option’s price concerning changes in the underlying asset’s price. By understanding deltas, traders can gauge the sensitivity of their options positions to price movements in the underlying asset. This information is valuable for adjusting positions to maintain desired risk levels and potentially capitalize on market opportunities.

If deltas indicate increasing risk or unexpected market movements, traders may choose to buy back the option early to limit potential losses or take profits. Overall, keeping a close eye on deltas empowers options sellers to adapt their strategies effectively in response to changing market conditions, ultimately enhancing their chances of success in options trading.

Start Small and Gradually Increase Complexity

Begin by executing a small number of contracts to acclimate yourself to the dynamics of the market. This approach allows for hands-on learning without exposing yourself to excessive risk. As you gain confidence and proficiency, consider expanding your repertoire by exploring additional beginner-friendly strategies such as cash-secured puts.

These strategies offer a more controlled risk profile and can serve as stepping stones to more advanced techniques. However, it’s crucial to emphasize learning and risk management above all else. Take the time to understand the intricacies of each strategy and how they align with your trading objectives and risk tolerance. By gradually increasing complexity while prioritizing education and risk management, you can enhance your chances of success as an options trader over time.

Is it profitable to sell options?

Selling options can be profitable, but it comes with risks. When you sell an option, you receive a premium upfront. If the option expires worthless, you keep the premium as profit. However, if the option is exercised, you may be obligated to buy or sell the underlying asset at a predetermined price (strike price), which can lead to losses.

The profitability of selling options depends on various factors, including market conditions, the strategy employed, and risk management practices. Successful option sellers often focus on conservative strategies, such as covered calls, and employ effective risk management techniques to mitigate potential losses. Overall, while selling options can yield profits, it requires careful consideration and an understanding of the associated risks.

How much money do you need to sell options?

The amount of money needed to sell options depends on the brokerage’s requirements and the specific option strategy employed. Generally, brokerage firms impose minimum capital requirements to engage in options trading to ensure traders can fulfill their financial obligations if the trade moves against them. For selling covered calls, the minimum requirement may involve owning the underlying stock, which determines the capital needed.

However, for more complex strategies like naked options, higher capital is typically required due to the increased risk. It’s essential for traders to assess their risk tolerance, understand the capital requirements of their chosen strategy, and ensure they have sufficient funds to cover potential losses before engaging in options selling.

Are you eager to dive into the exciting world of trading but unsure how to navigate the markets as a beginner? Becoming a profitable trader may seem like a daunting task, but with the right guidance and strategies, it’s entirely achievable. In this comprehensive guide, we’ll explore the essential steps and techniques you need to know to kickstart your journey towards becoming a profitable trader in 2024.

From understanding market fundamentals to mastering technical analysis and risk management, we’ll cover everything you need to know to build a solid foundation for success. Whether you’re interested in stocks, forex, cryptocurrencies, or commodities, this article will provide valuable insights and actionable tips to help you become a confident and profitable trader in today’s dynamic financial landscape.

How to become a profitable trader: A guide

Discover essential strategies and tips to help you become a profitable trader with our comprehensive guide. Let’s dive in!

Educate Yourself

Devour books, articles, and courses on trading basics, including the fundamental principles of how markets operate. Dive into technical analysis to learn how to read and interpret charts, patterns, and indicators, which are crucial for making informed trading decisions. Risk management is another vital area to master, as it helps you protect your capital and minimize losses.

Additionally, explore the different market types such as stocks, forex, and commodities to understand their unique characteristics and trading strategies. Each market has its nuances, and the more knowledge you accumulate, the better prepared you will be to handle various market conditions. Stay updated with the latest trends and developments through financial news and continuous learning. By building a solid educational foundation, you enhance your ability to make informed decisions, increasing your chances of becoming a profitable trader.

Craft Your Strategy

Selecting a trading style that aligns with your personality and lifestyle is important. Whether you prefer day trading, swing trading, or position trading, it’s crucial to choose a strategy that resonates with your risk tolerance and time commitment. Once you’ve identified your preferred style, meticulously backtest your strategy using historical market data.

This process allows you to simulate how your approach would have fared in real-world market conditions, helping you refine your tactics and optimize your trading plan for profitability. By thoroughly testing your strategy, you gain valuable insights into its strengths and weaknesses, enabling you to make informed adjustments and improvements.

Remember, crafting a robust trading strategy is a continuous journey of learning and adaptation, so remain diligent and open to refining your approach based on market dynamics and personal experiences.

Simulate & Practice

Utilize paper trading accounts to simulate real-world trading scenarios without the risk of financial loss. This invaluable tool allows you to test your strategies in a risk-free environment, honing your skills and gaining confidence before committing real capital. By practicing with paper trading, you can familiarize yourself with the intricacies of executing trades, managing positions, and implementing risk management techniques.

Furthermore, this simulation enables you to observe how your strategies perform under various market conditions, identifying strengths and weaknesses along the way. Treat paper trading as a vital step in your trading journey, dedicating time and effort to refine your approach and develop the discipline necessary for success. Remember, the insights gained from simulated trading can significantly enhance your ability to navigate the complexities of live markets with greater precision and confidence.

Discipline is Key

This involves meticulously outlining your entry and exit points, defining clear risk management protocols, and implementing effective money management strategies. The key to this approach lies in adhering to your plan steadfastly, regardless of emotional impulses or market fluctuations.

By maintaining discipline, you mitigate the risk of making impulsive decisions that could undermine your trading objectives. It’s essential to cultivate the mindset of a disciplined trader, one who remains focused on the long-term goals outlined in their trading plan. Remember, consistency is key; sticking to your predefined strategy even during challenging market conditions will ultimately contribute to your overall profitability and success as a trader.

Continuous Learning

Continuous learning is integral to successful trading. It involves staying informed about economic news, company fundamentals, and technical analysis tools. By remaining updated on market trends and developments, traders can adapt their strategies to changing conditions and identify profitable opportunities.

Embracing a mindset of lifelong learning enables traders to refine their skills, explore new methodologies, and improve decision-making processes. Whether through attending seminars, reading industry publications, or participating in online forums, committing to ongoing education is crucial for staying competitive in the dynamic financial markets.

Remember, the more knowledgeable you become, the better equipped you’ll be to navigate the complexities of trading and achieve consistent profitability. Therefore, prioritize continuous learning as a fundamental aspect of your journey toward becoming a successful trader.

Manage Risk Wisely

It’s imperative to never risk more than you can afford to lose. One effective risk management technique is using stop-loss orders to limit potential losses. These orders automatically trigger a sell-off if a trade moves against you beyond a predetermined point, helping to minimize losses. Additionally, managing position size wisely is crucial.

This involves determining the appropriate amount of capital to allocate to each trade based on factors like account size, risk tolerance, and market conditions. By adhering to strict risk management principles, traders can protect their capital and preserve their ability to trade another day, even in the face of adverse market movements. Ultimately, disciplined risk management is key to long-term success in trading and is a skill that every profitable trader must master.

Be patient and realistic

Patience and realism are essential virtues for traders seeking profitability. Successful trading doesn’t happen overnight; it requires perseverance and a realistic mindset. Avoid the temptation to chase quick wins, as impulsive decisions often lead to losses. Instead, adopt a patient approach and understand that achieving consistent profitability takes time.

Embrace losses as learning opportunities rather than setbacks, and stay committed to your trading journey. Focus on continuous learning and improvement, refining your strategies based on experience and market feedback. By maintaining patience and a realistic outlook, you’ll build the resilience needed to navigate the ups and downs of trading and increase your chances of long-term success. Remember, in trading, slow and steady wins the race.

Can you make money as a beginner trader?

Yes, beginners can make money as traders, but it requires dedication, education, and patience. While trading offers opportunities for profits, it also carries risks, especially for those new to the markets. Beginners must approach trading with realistic expectations and understand that success doesn’t happen overnight. By educating themselves on trading strategies, risk management, and market analysis, beginners can increase their chances of profitability.

Additionally, starting with a small trading account and practicing with simulated trades can help beginners gain experience without risking significant capital. Consistency, discipline, and continuous learning are key to achieving success as a beginner trader. With the right mindset and approach, beginners can gradually grow their trading skills and profitability over time.

Which type of trading is most profitable?

Day trading, which involves buying and selling securities within the same trading day, can be lucrative for some traders due to its potential for quick profits. However, it requires significant time commitment, discipline, and emotional control. Swing trading, where traders hold positions for several days or weeks to capture short- to medium-term price movements, can also be profitable for those who prefer a less intensive trading approach.

Long-term investing, focusing on fundamental analysis and holding assets for years, may provide steady returns over time but requires patience and a long-term perspective. Ultimately, the most profitable type of trading varies for each individual based on their goals, risk tolerance, and trading style.

How long does it take for a beginner to learn trading?

The time it takes for a beginner to learn trading varies widely depending on factors such as the individual’s background, dedication, learning methods, and market conditions. Some beginners may grasp basic trading concepts relatively quickly within a few months of consistent study and practice, while others may take longer to develop a deeper understanding and proficiency in trading strategies and risk management.

Ongoing learning and adaptation to changing market dynamics are essential for continued growth and success in trading. While there is no fixed timeline for mastering trading, committing to continuous learning, gaining practical experience through simulated trading or paper trading, and seeking guidance from experienced traders can accelerate the learning process for beginners.

Looking to elevate your options trading game and consistently earn profits in 2024? Discover the secrets to becoming a profitable options buyer with our comprehensive guide. Whether you’re a novice trader or an experienced investor, mastering the art of options buying can unlock lucrative opportunities in the market.

In this article, we’ll explore effective strategies, practical tips, and essential tools to help you navigate the world of options trading with confidence. From understanding market dynamics to executing precise trades, we’ll cover everything you need to know to maximize your profits and minimize risks.

Join us as we delve into the intricacies of options buying and empower you to achieve your financial goals in the dynamic landscape of 2024. Get ready to take your trading skills to the next level and become a successful options buyer.

Who is an options buyer?

An options buyer is an investor who purchases options contracts with the intention of gaining profit from the movement of underlying assets. Unlike options sellers, who are obligated to fulfill the terms of the contract if exercised, options buyers have the right but not the obligation to buy (call options) or sell (put options) the underlying asset at a predetermined price (strike price) within a specified period (expiration date).

Options buyers typically seek to profit from price movements in the underlying asset, whether they anticipate it to rise (call options) or fall (put options). They pay a premium to acquire the options contract and aim to capitalize on favorable market conditions to generate returns on their investment.

How to become a profitable options buyer

Let’s get into how you can become a profitable options buyer in 2024:

Understand options trading

Before diving headfirst into options trading, it’s crucial to grasp the fundamentals thoroughly. Start by understanding the intricacies of options contracts, which entails comprehending the various types available, such as calls and puts. Additionally, familiarize yourself with the Greeks, which are metrics used to gauge option sensitivity to factors like price changes and time decay.

However, don’t rush into trading immediately. Take the time to educate yourself in-depth about options trading. Make sure you have a solid understanding of how options work and the risks involved. It’s essential to gain practical experience and ensure you’re comfortable with executing trades before fully immersing yourself in the market. By taking this approach, you’ll be better equipped to navigate the complexities of options trading and increase your chances of becoming a profitable trader in the long run.

Develop a trading strategy

Start by defining what you aim to achieve with your options trades—whether it’s generating income, making directional bets on asset price movements, or capitalizing on market volatility.

Once you’ve established your objectives, carefully select a trading strategy that aligns with them. Consider strategies such as covered calls, protective puts, or straddles, among others, based on your risk appetite and market outlook. It’s crucial to thoroughly understand the intricacies of each strategy and how they operate in different market conditions.

By taking the time to develop a well-thought-out trading strategy, you’ll be better equipped to navigate the complexities of options trading and increase your chances of success in the markets. Remember to continually reassess and refine your strategy as market conditions evolve to remain adaptable and effective.

Research underlying assets

Before committing to options trading, it’s crucial to conduct thorough research on the underlying assets you’re considering. This involves delving into both fundamental and technical aspects of the assets.

Fundamental analysis entails examining the financial health and performance of the underlying companies or assets. This includes studying factors such as revenue, earnings, debt levels, and market positioning to gauge their overall stability and growth prospects.

On the other hand, technical analysis involves analyzing price history and chart patterns to identify potential trends and price movements. This can help traders make more informed decisions regarding entry and exit points, as well as timing their options trades effectively.

By combining fundamental and technical analysis, traders can gain a comprehensive understanding of the assets they’re trading options on, thereby increasing their chances of making profitable trades while minimizing risks.

Select options contracts carefully

When selecting options contracts, it’s essential to consider various factors to optimize your trading strategy. Firstly, pay attention to the strike price, which is the price at which the option holder can buy or sell the underlying asset. Choose a strike price that aligns with your market outlook and trading objectives.

Secondly, evaluate the expiry date, as it determines the duration of the options contract. Shorter expiry dates may be suitable for more active traders seeking quick profits, while longer expiries offer more time for the underlying asset to move in the desired direction.

Lastly, assess the liquidity of the options contract, which refers to how easily it can be bought or sold in the market. Opt for contracts with higher liquidity to ensure smoother execution of trades and tighter bid-ask spreads, reducing the impact of transaction costs on your overall profitability.

Manage risk effectively

Managing risk effectively is crucial in options trading to protect your capital and maximize returns. Position sizing involves determining the appropriate amount of capital to allocate to each trade based on your risk tolerance and overall portfolio size. By limiting the amount of capital at risk per trade, you can mitigate the impact of potential losses on your overall portfolio.

Additionally, employing stop-loss orders is essential for implementing risk management strategies. These orders automatically trigger a sale when the option’s price reaches a predetermined level, limiting potential losses on a trade. Stop-loss orders help traders adhere to their risk management plan and prevent emotions from driving impulsive decisions during periods of market volatility.

Overall, incorporating position sizing and stop-loss orders into your options trading strategy is essential for effectively managing risk and increasing the probability of long-term success.

Monitor positions actively

Actively monitoring your options positions and the underlying asset’s price movement is vital for successful options trading. By staying informed about market changes, you can make timely decisions to adjust your positions accordingly. Monitoring the Greeks, such as delta, gamma, theta, and vega, provides valuable insights into how your options contracts may be affected by changes in factors like price, time, and volatility.

For instance, delta measures the sensitivity of an option’s price to changes in the underlying asset’s price, while gamma measures the rate of change in delta. Theta reflects the impact of time decay on an option’s value, and vega indicates the sensitivity of an option’s price to changes in implied volatility.

Understanding and monitoring these metrics enable you to adapt your trading strategy based on market dynamics, helping you optimize your options trading performance and achieve your financial goals.

Learn from your experiences

After each trade, take the time to review your results objectively. Identify the factors that contributed to your success or failure, such as entry and exit points, risk management, and market conditions. By pinpointing what worked well and what didn’t, you can gain valuable insights into your trading approach.

Use this information to adapt and refine your strategy accordingly. This might involve tweaking your entry and exit criteria, adjusting your risk management techniques, or refining your trade selection process. Continuously learning from your experiences allows you to evolve as a trader, becoming more adept at identifying opportunities and managing risks effectively. Ultimately, this iterative process of self-reflection and improvement is essential for achieving consistent profitability in options trading.

Do option buyers make money?

Option buyers can make money, but it’s not guaranteed. They have limited losses (the premium paid) but unlimited profit potential if the market moves favorably. The challenge is correctly predicting price movements and timing the trade before expiry. Since options lose value over time (time decay), buyers must be right and quick to profit. Many beginners lose money due to these factors, so proper education and strategy are crucial.

Looking to dive deeper into analyzing market volume for your trading decisions? Understanding volume can provide valuable insights into market dynamics and help you make more informed trading choices. In this article, we’ll explore the best indicators for volume analysis in 2024. These indicators can help you gauge the strength of price movements, identify potential trend reversals, and confirm the validity of price trends.

We’ll cover a range of indicators, from simple volume bars to more advanced volume-based oscillators. Whether you’re a novice trader or an experienced investor, incorporating these volume analysis tools into your trading strategy can enhance your ability to interpret market movements and improve your overall trading performance. Join us as we uncover the power of volume analysis in today’s dynamic markets.

What is volume analysis?

Volume analysis is a technique used in finance to understand trends in the market by examining how many shares of a security are traded (volume) over time. By looking at volume alongside price movements, analysts can gauge the strength of a trend. High volume with rising prices suggests strong buying pressure and a likely continuation of the uptrend. Conversely, high volume with falling prices suggests strong selling pressure and a possible trend reversal. Volume analysis isn’t perfect, but it can be a helpful tool for making informed trading decisions.

Best indicators for volume analysis

Let’s explore the top indicators for volume analysis in 2024, offering insights into market dynamics and enhancing trading strategies.

Volume bars

Volume bars are a fundamental tool in technical analysis that illustrate the number of trades executed during a given timeframe, typically displayed as vertical bars on a price chart. Each bar represents the volume of transactions that occurred within that period, offering insights into market activity and liquidity.

By observing volume bars, traders can gauge the level of participation in the market, identify potential buying or selling pressure, and confirm the strength of price movements. For example, an increase in volume during an uptrend may indicate strong buying interest and validate the bullish momentum, while a decrease in volume during a price reversal could signal weakening conviction among market participants.

Overall, volume bars provide valuable context for interpreting price movements and help traders make more informed decisions by corroborating trends and potential market reversals with supporting volume data.

On-Balance Volume (OBV)

Ever wondered how to spot an opportunity in market downturns? Enter into our comprehensive guide on how to identify a pullback. Curious investors often find themselves puzzled by market pullbacks, unsure whether it’s a sign of trouble or a chance to buy low. In this article, we’ll unravel the mystery behind pullbacks, offering you a step-by-step roadmap to navigate these turbulent market phases with confidence.

From understanding the basics of pullbacks to mastering advanced techniques for identifying them, we’ve got you covered. You’ll learn to recognize the subtle signals that precede a pullback, distinguish between healthy corrections and trend reversals, and devise a strategy to capitalize on pullback opportunities. So, gear up as we go on this journey to demystify the art of identifying pullbacks and unlock the potential for profit in market downturns.

What is a pullback?

A pullback refers to a temporary reversal in the price of a financial asset within an ongoing trend. It’s characterized by a short-term decline in price following a period of upward movement, often prompting investors to reevaluate their positions. Pullbacks are considered a natural and healthy part of market dynamics, providing opportunities for profit-taking and market reassessment. 

Unlike a trend reversal, where the asset’s direction changes, pullbacks are temporary corrections within the context of the prevailing trend. Understanding pullbacks is crucial for investors, as they can help distinguish between normal market fluctuations and more significant trend changes. By identifying pullbacks early and interpreting their significance, investors can adjust their strategies accordingly, potentially mitigating losses and capitalizing on opportunities for long-term growth. 

How to identify a pullback

Ready to decode market swings? Dive into our guide on “How to Identify a Pullback” for expert tips and strategies.

Analyze Trend Direction:

Analyzing the prevailing trend in the market is fundamental to identifying pullback opportunities. A pullback occurs within the context of an existing trend, be it an uptrend, downtrend, or sideways movement. Understanding the trend direction offers crucial insights into the likely behavior of pullbacks. In an uptrend, pullbacks typically manifest as temporary dips in price before the upward trend resumes.

Conversely, in a downtrend, pullbacks may present as brief rallies before the downtrend continues its course. Sideways trends can experience pullbacks that fluctuate within a defined range, offering traders opportunities for short-term gains. By analyzing the trend direction comprehensively, traders can anticipate and interpret pullback movements more effectively. This understanding enables traders to make informed decisions, whether it involves capitalizing on temporary price dips or preparing for potential trend reversals.

Incorporating trend analysis into their overall trading strategy enhances traders’ ability to identify and capitalize on pullback opportunities, contributing to their long-term success in the market.

Look for Price Retracements:

Pullbacks, characterized by temporary reversals in price within the broader trend, are essential to grasp in trading. Observing instances where the price retraces a portion of its recent advance or decline is crucial. This retracement often follows a significant price move and might indicate a temporary pause or correction before the trend resumes. Traders often employ technical tools like Fibonacci retracement levels to pinpoint potential areas of support or resistance where pullbacks are likely to transpire.

By closely monitoring price retracements, traders can assess the strength and depth of pullback movements, enabling more accurate determination of entry and exit points in the market. This meticulous approach aids in refining trading strategies, minimizing risk exposure, and optimizing profitability amidst market fluctuations. Understanding pullback dynamics empowers traders to navigate the market with confidence and precision, ultimately enhancing their trading performance and long-term success. By mastering the art of identifying and interpreting price retracements, traders can capitalize on pullback opportunities and achieve their financial goals in the dynamic world of trading.

Assess Volume Patterns:

Assessing volume patterns during pullbacks is critical for traders to confirm the validity of market movements. Typically, during a pullback, trading volume tends to diminish as the price retraces. This decline in volume suggests a lack of conviction among market participants, indicating that the pullback may be temporary in nature. Conversely, a pullback accompanied by increasing volume may signal stronger selling or buying pressure, potentially indicating a more significant trend reversal.

By assessing volume patterns during pullbacks, traders can gauge the level of participation and confidence in the market, helping them to validate or invalidate the pullback scenario and adjust their trading strategies accordingly. Understanding volume dynamics during pullbacks empowers traders to make well-informed decisions, enhancing their ability to navigate volatile market conditions and capitalize on profitable trading opportunities. Monitoring volume alongside other technical indicators provides traders with a comprehensive view of market sentiment, allowing for more accurate assessments of pullback movements and potential trend reversals.

Monitor Key Support and Resistance Levels:

Identifying key support and resistance levels is essential for anticipating pullbacks in the market. Support levels represent areas where buying interest is expected to emerge, preventing further price declines, while resistance levels denote areas where selling pressure may cap upward price movements. During a pullback, the price often retraces to test these key levels before resuming its trend. Traders closely monitor these levels for signs of price reactions, such as bounces or breaks, which can provide valuable insights into the strength of the pullback and potential reversal points.

By diligently observing support and resistance levels, traders can effectively anticipate and react to pullback movements, enhancing their trading outcomes. These levels serve as critical reference points for traders to set stop-loss orders, identify profit targets, and adjust their trading strategies accordingly to optimize risk management and maximize profitability in the market. Incorporating support and resistance analysis into trading strategies provides traders with a structured approach to navigating pullback scenarios and capitalizing on market opportunities with greater precision and confidence.

Use Technical Indicators:

Technical indicators offer valuable insights into market dynamics and can help identify potential pullback opportunities. Popular indicators such as the Relative Strength Index (RSI), Moving Average Convergence Divergence (MACD), and Stochastic Oscillator provide signals of overbought or oversold conditions, which may precede pullback movements.

The RSI measures the speed and change of price movements, indicating whether a market is overbought or oversold. Similarly, the MACD combines moving averages to identify changes in momentum, often signaling potential pullbacks when it diverges from price action. Additionally, trend-following indicators like moving averages can help confirm the direction of the prevailing trend and identify potential entry points during pullbacks.

By incorporating technical indicators into their analysis, traders can gain a comprehensive understanding of market conditions and increase their ability to identify and capitalize on pullback opportunities effectively. These indicators serve as valuable tools for traders to navigate pullback scenarios and make informed trading decisions with confidence. By leveraging technical analysis alongside other fundamental and sentiment indicators, traders can develop robust strategies to thrive in the dynamic and ever-changing financial markets.

Consider Market Sentiment:

Assessing volume patterns during pullbacks is critical for traders to confirm the validity of market movements. Typically, during a pullback, trading volume tends to diminish as the price retraces. This decline in volume suggests a lack of conviction among market participants, indicating that the pullback may be temporary in nature. Conversely, a pullback accompanied by increasing volume may signal stronger selling or buying pressure, potentially indicating a more significant trend reversal. 

Through assessing the volume patterns during pullbacks, traders can gauge the level of participation and confidence in the market, helping them to validate or invalidate the pullback scenario and adjust their trading strategies accordingly. Understanding volume dynamics during pullbacks empowers traders to make well-informed decisions, enhancing their ability to navigate volatile market conditions and capitalize on profitable trading opportunities.

Confirm with Price Action:

Price action analysis involves studying raw price movements on charts to identify patterns, trends, and potential reversal points. During pullbacks, traders closely monitor price action for clues about the market’s underlying dynamics. They look for reversal patterns such as bullish or bearish engulfing patterns, hammer or shooting star candles, and key reversal patterns that signal a potential change in direction. Additionally, traders observe how price reacts around key support and resistance levels during pullbacks, as this can provide valuable confirmation of the pullback scenario.

By confirming pullback movements with price action analysis, traders can validate their trading decisions and enhance their overall success in the market. This meticulous approach empowers traders to interpret market movements effectively, allowing them to navigate pullback scenarios with confidence and precision. Incorporating price action analysis into their trading strategies adds another layer of insight, enabling traders to make informed decisions and capitalize on opportunities presented by pullbacks. Combining analysis with indicators also improves understanding and profits from pullbacks.

How do you know if there is a pullback or reversal?

Distinguishing between a pullback and a reversal involves careful analysis of market dynamics. Pullbacks are temporary retracements within the context of an existing trend, characterized by a short-term price decline before the trend resumes. They typically exhibit lower trading volume and do not signify a significant change in market sentiment. Reversals, on the other hand, signal a fundamental shift in market direction, marking the end of one trend and the beginning of a new one. Reversals often occur after extended trends and are accompanied by higher trading volume and stronger price momentum in the opposite direction. 

What is a valid pullback?

A valid pullback is a temporary reversal in price within the context of an existing trend, where the price briefly retraces before resuming its original direction. It typically occurs after a significant price move and is characterized by lower trading volume, indicating a pause or correction rather than a fundamental change in market sentiment. Valid pullbacks often respect key support and resistance levels, confirming the continuation of the prevailing trend. 

Traders consider pullbacks valid when they occur within the parameters of a well-defined trend and exhibit characteristics consistent with healthy market dynamics. Recognizing valid pullbacks enables traders to capitalize on temporary price dips while minimizing the risk of mistaking them for trend reversals. This ability to discern valid pullbacks from potential reversals enhances traders’ confidence and success in navigating market fluctuations.

Are you tired of feeling lost in the stormy seas of market volatility? Finding your bearings amidst unpredictable price swings can be daunting, but fear not—we’ve got you covered. In this guide, we’ll delve into the world of market volatility and unveil the best tools to help you navigate these turbulent waters. 

Get ready to discover the top market volatility indicators that will empower you to make informed decisions and weather the storm with confidence. From tried-and-tested metrics to cutting-edge strategies, we’ll explore everything you need to know to stay ahead of the curve in today’s dynamic markets. So buckle up and prepare to unlock the secrets of mastering market volatility like a seasoned trader. Let’s dive in!

What is market volatility?

Market volatility refers to the degree of variation or fluctuation in the price of a financial instrument or asset over a certain period. It reflects the speed and magnitude of price changes, indicating the level of uncertainty or risk present in the market. High volatility implies that prices can change rapidly and unpredictably, while low volatility suggests more stable and predictable price movements. 

Various factors contribute to market volatility, including economic data releases, geopolitical events, market sentiment, and investor behavior. Understanding and measuring market volatility is crucial for traders and investors to assess risk, make informed decisions, and develop effective strategies for managing their portfolios. By analyzing volatility trends and utilizing appropriate tools and indicators, market participants can navigate the dynamic landscape of financial markets more confidently.

Top 7 market volatility indicators

Unlock the secrets to navigating market volatility with precision using the best volatility indicators. Let’s explore these essential tools together.

1. Average True Range (ATR)

Average True Range (ATR) is a widely-used indicator that measures market volatility by calculating the average range of price movements over a specified period. It provides traders with valuable insights into the magnitude of price fluctuations, allowing them to gauge the potential for future volatility. A higher ATR value indicates greater volatility, while a lower value suggests calmer market conditions.

Traders often use ATR to set stop-loss levels, determine position size, and identify potential breakout opportunities. By incorporating ATR into their trading strategy, traders can effectively manage risk and adapt to changing market conditions with greater precision. For example, a trader may use ATR to adjust their stop-loss levels based on current market volatility, allowing them to give their trades more room to breathe while still protecting their capital from excessive losses.

Additionally, ATR can help traders identify potential breakout opportunities by highlighting periods of increased volatility. When ATR values spike, it often indicates that a significant price movement is underway, presenting traders with opportunities to enter new positions or capitalize on existing trends. Overall, ATR is a versatile tool that can provide traders with valuable insights into market volatility and help them make more informed trading decisions.

2. Bollinger Bands

Bollinger Bands are another popular indicator for assessing market volatility and identifying potential trend reversals. They consist of a simple moving average (SMA) line surrounded by upper and lower bands that represent standard deviations from the SMA. When the bands widen, it indicates increased volatility, while narrowing bands suggest decreased volatility.

Traders often use Bollinger Bands to identify overbought or oversold conditions and anticipate potential price breakouts or reversals. By monitoring Bollinger Bands, traders can gain valuable insights into market volatility and make more informed trading decisions. For example, when prices touch or exceed the upper band, it may indicate that the market is overbought and due for a correction. Conversely, when prices touch or fall below the lower band, it may signal that the market is oversold and poised for a potential reversal.

Additionally, Bollinger Bands can be used in conjunction with other technical indicators to confirm trading signals and filter out false signals. Overall, Bollinger Bands are a versatile tool that can help traders navigate volatile market conditions and identify profitable trading opportunities.

3. Volatility Index (VIX)

The Volatility Index (VIX), also known as the “fear index,” is a measure of expected market volatility derived from options prices on the S&P 500 index. It reflects investor sentiment and provides insight into market expectations for future volatility. A higher VIX value suggests increased fear and uncertainty in the market, while a lower value indicates calmer conditions.

Traders often use the VIX as a contrarian indicator, with high VIX levels signaling potential buying opportunities and low levels suggesting potential selling opportunities. By monitoring the VIX, traders can gauge market sentiment and adjust their trading strategies accordingly to capitalize on changing volatility dynamics.

Moreover, the VIX can serve as a valuable tool for hedging against volatility risk in the market. Traders and investors can use VIX futures or options to hedge their portfolios against potential downturns or sudden market movements. Additionally, institutions and fund managers may utilize the VIX to manage risk and allocate capital more effectively across different asset classes. Overall, the VIX provides traders and investors with valuable insights into market sentiment and volatility expectations, helping them make more informed decisions in uncertain market conditions.

4. Chaikin Volatility Indicator

The Chaikin Volatility Indicator is a technical analysis tool that measures market volatility by comparing the difference between a security’s high and low prices over a specified period. It provides traders with insights into the intensity of price movements, allowing them to identify periods of high and low volatility. When the indicator rises, it indicates increased volatility, while a decline suggests decreased volatility.

Traders often use the Chaikin Volatility Indicator to confirm trends, identify potential reversals, and set appropriate stop-loss levels. By incorporating this indicator into their analysis, traders can better understand market dynamics and make more informed trading decisions. For example, when the Chaikin Volatility Indicator spikes, it may signal that the market is experiencing heightened volatility and increased risk. Traders can use this information to adjust their trading strategy accordingly, such as tightening their stop-loss levels or reducing their position size, to manage risk effectively.

Overall, the Chaikin Volatility Indicator is a valuable tool for traders seeking to navigate volatile market conditions and identify profitable trading opportunities.

5. Relative Volatility Index (RVI)

The Relative Volatility Index (RVI) is a momentum oscillator that measures the volatility of a financial instrument relative to its recent price movements. It compares the magnitude of price changes over a specified period, allowing traders to assess the intensity of volatility. A higher RVI value indicates greater volatility, while a lower value suggests calmer market conditions.

Traders often use the RVI to identify potential trend reversals, confirm price trends, and anticipate breakout opportunities. By incorporating the RVI into their analysis, traders can gain valuable insights into market volatility and make more informed trading decisions. For example, when the RVI value spikes, it may indicate that the market is experiencing increased volatility, signaling potential trading opportunities. Traders can use this information to adjust their trading strategy accordingly, such as tightening stop-loss levels or increasing position size to capitalize on price movements.

Additionally, the RVI can be used in conjunction with other technical indicators to confirm trading signals and enhance trading strategies. Overall, the Relative Volatility Index is a valuable tool for traders seeking to navigate volatile market conditions and identify profitable trading opportunities.

6. Standard Deviation

Standard Deviation is a statistical measure of market volatility that calculates the dispersion of a set of data points from its mean. In trading, it is commonly used to assess the variability of price movements over a specified period. A higher standard deviation indicates greater volatility, while a lower value suggests more stable market conditions.

Traders often use the standard deviation to quantify risk, set stop-loss levels, and identify potential price extremes. By incorporating standard deviation into their analysis, traders can gain a better understanding of market volatility and adjust their trading strategies accordingly to mitigate risk and capitalize on opportunities.

For example, traders may use the standard deviation to determine the appropriate width of Bollinger Bands or to identify potential price targets based on historical volatility levels. Additionally, the standard deviation can be used in conjunction with other technical indicators to confirm trading signals and filter out false signals. Overall, standard deviation is a versatile tool that can provide traders with valuable insights into market volatility and help them make more informed trading decisions.

7. Momentum Indicator

The Momentum Indicator is a technical analysis tool that measures the rate of change in a financial instrument’s price over a specified period. While not explicitly a volatility indicator, it can provide valuable insights into market momentum, which often correlates with volatility. Traders use the Momentum Indicator to identify overbought or oversold conditions, confirm trends, and anticipate potential trend reversals.

In volatile markets, momentum can be a key driver of price movements, making this indicator particularly useful for assessing volatility dynamics. By incorporating the momentum indicator into their analysis, traders can better understand market sentiment and make more informed trading decisions in volatile market conditions.

For example, when the Momentum Indicator shows divergences from price action, it may signal potential trend reversals or shifts in market sentiment. Traders can use this information to adjust their trading strategy accordingly, such as entering or exiting positions based on momentum signals. Overall, the Momentum Indicator provides traders with valuable insights into market dynamics and helps them navigate volatile market conditions more effectively.

Which is the best volatility indicator?

In volatile market conditions, a dynamic trading strategy embracing volatility often yields the best results. One such strategy is the volatility breakout strategy, where traders capitalize on significant price movements following periods of low volatility. By identifying key support and resistance levels, traders place buy or sell orders above or below these levels, anticipating breakout movements.

Additionally, trend-following strategies can be effective in volatile markets, where traders ride the momentum of established trends and adapt their positions as market conditions change. The key lies in flexibility and agility, allowing traders to adjust their strategies in response to changing market dynamics. Ultimately, the best strategy for volatility depends on a trader’s risk tolerance, market analysis skills, and ability to adapt to the unpredictable nature of volatile markets.

Which strategy is best in volatility?

In times of heightened market volatility, employing a strategy that capitalizes on the market’s unpredictability can be advantageous. One such strategy is the volatility breakout strategy, which involves identifying periods of low volatility followed by significant price movements. Traders aim to enter positions as prices break out of established ranges, leveraging the momentum created by these movements. Additionally, trend-following strategies can be effective in volatile markets as traders ride the momentum of established trends while remaining vigilant for potential reversals.

However, it’s crucial to note that the best strategy for managing volatility may vary depending on individual risk tolerance, market analysis skills, and the ability to adapt to rapidly changing market conditions. Therefore, traders should carefully consider their trading objectives and risk management techniques when selecting a strategy in volatile markets.

Brace yourself—when the stock market plunges, panic can be contagious. But fear not; there’s a roadmap for surviving the turmoil. In the world of investing, knowing what to do during a stock market crash is essential. This article serves as your guide through the stormy seas of market downturns. We’ll explore practical strategies to safeguard your investments and emerge unscathed from the chaos. From risk management techniques to seizing opportunities amidst the turmoil, we’ve got you covered. So, grab a seat and let’s navigate this together. Whether you’re a seasoned investor or just starting out, understanding how to weather a market crash is crucial for long-term financial success.

What is a stock market crash?

A stock market crash is a sudden and severe decline in the prices of stocks traded on a stock exchange, often resulting in widespread panic selling. It is characterized by a sharp and rapid decrease in market value, leading to significant losses for investors. During a crash, investor confidence diminishes, leading to a downward spiral as more investors rush to sell their holdings to limit losses.

The causes of stock market crashes can vary and may include economic downturns, geopolitical events, financial crises, or speculative bubbles bursting. Stock market crashes can have far-reaching consequences, impacting not only individual investors but also businesses, economies, and even global financial systems. Recovering from a stock market crash often requires time, resilience, and strategic decision-making to rebuild portfolios and restore investor confidence.

How to handle a stock market crash

Facing a stock market crash? Discover essential strategies and insights to navigate the storm and safeguard your investments.

Stay Calm and Avoid Impulsive Decisions

When the stock market experiences a crash, it’s natural to feel overwhelmed and tempted to make impulsive decisions. However, reacting hastily can often worsen the situation. Instead, take a deep breath and remind yourself that market downturns are a normal part of investing. Historically, the market has always recovered from crashes, and panic selling tends to lock in losses rather than mitigate them.

To avoid making decisions based on fear, it’s crucial to stay calm and rational. Consider taking a step back from monitoring market fluctuations constantly and focusing on the long-term perspective. Remember that your investment strategy should align with your financial goals and risk tolerance. If you’re feeling uncertain or anxious, seeking guidance from a financial advisor can provide valuable support and help you make informed decisions. By maintaining a level head and avoiding impulsive actions, you can navigate through market crashes more effectively and protect your investments for the long term

Review Your Investment Strategy

During a stock market crash, it’s imperative to reassess your investment strategy and ensure it aligns with your financial goals and risk tolerance. Start by evaluating the composition of your portfolio and considering whether it is well-diversified across various asset classes, industries, and geographic regions. Diversification can help spread risk and mitigate the impact of market downturns on your overall portfolio.

Next, assess your investment timeline and liquidity needs to determine if any adjustments are necessary. While it may be tempting to make significant changes to your portfolio during a crash, it’s essential to avoid knee-jerk reactions and stick to your long-term investment plan. Remember that market downturns are often temporary, and trying to time the market can lead to missed opportunities for long-term growth.

Finally, consider consulting with a financial advisor to gain perspective and develop a strategy based on your individual circumstances and investment objectives. A professional can provide valuable insights and help you navigate through turbulent market conditions with confidence.

Focus on Quality Investments

During a stock market crash, it’s essential to shift your focus to quality investments that have the potential to weather the storm and recover once market conditions improve. Look for companies with robust fundamentals, including strong earnings, manageable debt levels, and competitive advantages within their industries. These companies are more likely to withstand economic downturns and emerge stronger on the other side. Additionally, consider investing in defensive sectors such as healthcare, consumer staples, and utilities, which tend to be less cyclical and more resilient during market downturns.

By concentrating on quality investments, you can position your portfolio to better withstand the volatility of a stock market crash and potentially capitalize on buying opportunities that arise. While it may be tempting to chase speculative stocks or sectors during market downturns, focusing on quality can help mitigate risk and provide more stable returns over the long term.

Remember to conduct thorough research and due diligence before making any investment decisions, and consider seeking guidance from a financial advisor to ensure that your investment strategy aligns with your financial goals and risk tolerance.

Avoid Trying to Time the Market

Attempting to time the market during a stock market crash can be tempting, but it’s notoriously difficult and often leads to suboptimal outcomes. Instead of trying to predict when the market will bottom out or when it’s the best time to buy or sell, focus on maintaining a disciplined approach to investing.

One strategy to consider is dollar-cost averaging, where you invest a fixed amount of money at regular intervals, regardless of market conditions. This approach can help smooth out the impact of market volatility over time and reduce the risk of investing a large sum of money at the wrong time.

Additionally, regularly rebalancing your portfolio to maintain your target asset allocation can help ensure that you’re not overly exposed to any single asset class or sector. By sticking to your long-term investment plan and avoiding the temptation to make impulsive decisions based on short-term market fluctuations, you can improve your chances of achieving your financial goals over the long term. Remember that successful investing is about time in the market, not timing the market.

Have Cash Reserves for Opportunities

During a stock market crash, cash reserves can be invaluable assets. Having cash on hand provides you with the flexibility to take advantage of buying opportunities that may arise as stock prices decline. Consider setting aside a portion of your portfolio in cash or cash equivalents such as money market funds or short-term Treasury securities.

Maintaining cash reserves not only allows you to capitalize on undervalued assets or companies with strong growth potential but also provides a buffer against unexpected expenses or emergencies. By having liquidity readily available, you can navigate through market downturns with confidence and make strategic investment decisions when others are selling in a panic.

However, it’s essential to strike a balance between holding cash reserves and staying fully invested in the market. While having cash on hand can provide peace of mind and financial flexibility, keeping too much cash idle can hinder your portfolio’s long-term growth potential. Therefore, consider maintaining an appropriate level of cash reserves that aligns with your investment strategy and risk tolerance.

Keep an Eye on the Long-Term

When facing a stock market crash, it’s crucial to maintain a long-term perspective and resist the temptation to make short-term decisions based on fear or emotion. Remember that the stock market has historically delivered positive returns over the long term, despite occasional downturns and volatility.

Instead of focusing on short-term market fluctuations, concentrate on your long-term financial goals and investment strategy. Review your investment plan regularly and make adjustments as needed to stay on track towards achieving your objectives. Consider diversifying your portfolio across different asset classes and sectors to spread risk and enhance potential returns over time.

Additionally, keep in mind that market downturns can present opportunities to purchase quality investments at discounted prices. By staying disciplined and sticking to your long-term investment plan, you can capitalize on these opportunities and position your portfolio for success in the future. Remember that successful investing requires patience, discipline, and a focus on the long term, regardless of short-term market fluctuations. By keeping an eye on the long-term horizon, you can navigate through market downturns with confidence and emerge stronger on the other side.

Seek Professional Guidance if Needed

Navigating a stock market crash can be overwhelming, especially for inexperienced investors. If you’re feeling uncertain or anxious about how to handle the situation, don’t hesitate to seek professional guidance from a financial advisor or investment professional. A knowledgeable advisor can provide valuable insights, personalized advice, and a sense of reassurance during turbulent times.

An advisor can help you evaluate your investment strategy, assess your risk tolerance, and make informed decisions that align with your financial goals. Whether you need assistance with portfolio management, risk assessment, or financial planning, a trusted advisor can offer guidance and support to help you navigate the complexities of a stock market crash.

Remember that seeking professional guidance doesn’t mean relinquishing control of your finances. Instead, it’s about leveraging the expertise and experience of a qualified professional to make informed decisions that are in your best interest. By working with an advisor, you can gain peace of mind knowing that you have a knowledgeable ally on your side to help you navigate through turbulent market conditions and emerge stronger on the other side.

What stocks should I buy if the market crashes?

During a market crash, it’s essential to focus on quality stocks with strong fundamentals that are likely to withstand the downturn and recover in the long term. Consider investing in defensive sectors such as healthcare, consumer staples, and utilities, which tend to be less sensitive to economic fluctuations. Companies with solid balance sheets, consistent earnings growth, and competitive advantages within their industries are also attractive options. 

Additionally, look for dividend-paying stocks with a history of maintaining or increasing dividends even during market downturns, as they can provide a source of income and stability during turbulent times. Conduct thorough research and due diligence to identify opportunities that align with your investment goals and risk tolerance, and consider seeking guidance from a financial advisor for personalized advice.

In today’s volatile market, it’s important to have a reliable set of indicators to foresee potential downturns. The best indicators for a market pullback act as your guiding stars, offering insights amidst uncertainty.

In this article, we’ll dive into the essentials: understanding key indicators, interpreting market signals, and devising a plan to safeguard your investments. We’ll explore tried-and-tested metrics like moving averages, RSI, and MACD, shedding light on their significance and practical application.

But wait, there’s more. We won’t stop at just identifying indicators; we’ll delve into actionable steps to weather market storms and even seize opportunities amidst the chaos. So buckle up as we embark on this journey to decode the mysteries of market pullbacks.

What is a market pullback?

A market pullback refers to a temporary decline in stock prices within a broader uptrend, often triggered by investors selling off their positions to secure profits or in response to negative news. Unlike a full-blown market correction or crash, pullbacks are typically short-lived and represent a healthy correction in an otherwise bullish market. They serve as opportunities for investors to buy stocks at a discounted price before the upward trend resumes. Understanding market pullbacks is crucial for investors to distinguish between normal market fluctuations and more significant downturns. 

By identifying the signs and utilizing appropriate indicators, investors can navigate pullbacks effectively, optimizing their portfolios for long-term growth while minimizing potential losses. Staying informed about market conditions and having a solid strategy in place can help investors capitalize on pullbacks while avoiding panic-driven decisions.

Top 7 indicators for a market pullback

Let’s discover the essential tools to anticipate market downturns. Explore the top 7 indicators for a market pullback in this insightful guide.

1. Moving Averages:

Moving averages, such as the 50-day or 200-day, provide a smoothed-out view of price trends over a specific period. When the shorter-term moving average crosses below the longer-term one, it signals potential weakness in the market. This crossover acts as a warning sign for a looming pullback, prompting investors to reassess their positions and risk exposure.

Understanding the significance of moving averages requires a nuanced approach. For instance, investors often look for confirmation from other technical indicators or fundamental factors before making trading decisions based solely on moving average crossovers. Moreover, the choice of moving average lengths can vary depending on the trader’s time horizon and market conditions.

Shorter-term moving averages react more quickly to price changes but may generate more false signals, while longer-term moving averages provide a broader perspective but may lag behind price movements. By incorporating moving averages into a comprehensive trading strategy, investors can effectively anticipate market pullbacks and make informed decisions to manage their portfolios.

2. Relative Strength Index (RSI):

The Relative Strength Index (RSI) is a momentum oscillator that measures the speed and change of price movements. It oscillates between 0 and 100, with readings above 70 indicating overbought conditions and readings below 30 suggesting oversold conditions. During a market pullback, RSI readings often dip into oversold territory as selling pressure intensifies. This oversold condition may precede a potential reversal, offering traders an opportunity to enter the market at a favorable price.

Conversely, RSI readings above 70 may signal an impending pullback as buying momentum weakens, prompting investors to exercise caution. Understanding RSI dynamics is crucial for investors to gauge market sentiment and anticipate potential trend reversals. Traders often use RSI in conjunction with other technical indicators to confirm signals and identify entry or exit points.

Observing divergences between RSI and price movements can provide valuable insights into underlying market dynamics. By incorporating RSI analysis into their trading strategies, investors can enhance their decision-making process and effectively navigate market pullbacks.


3. Moving Average Convergence Divergence (MACD):

The Moving Average Convergence Divergence (MACD) is a versatile indicator renowned for its ability to capture changes in trend momentum. Comprising two lines—the MACD line and the signal line—it’s a staple tool in traders’ arsenals. A key signal for market pullbacks occurs when the MACD line crosses below the signal line, indicating a potential shift from bullish to bearish momentum. This crossover serves as a red flag for investors, prompting caution and potentially signaling an impending market pullback.

Moreover, traders keen on spotting trend reversals often scrutinize MACD divergences. The divergence between the MACD line and the price trend suggests a weakening trend and hints at a possible market reversal. Additionally, analyzing the MACD histogram, which displays the difference between the MACD line and the signal line, provides insight into the strength of the prevailing trend, aiding investors in anticipating market pullbacks.

Incorporating MACD analysis into trading strategies enriches decision-making by providing a nuanced comprehension of market momentum dynamics. This empowers traders to confidently manage potential pullbacks, leveraging insights gleaned from MACD signals and divergences.

4. Volume:

Volume is a crucial indicator that measures the number of shares traded during a specific period. An increase in trading volume during a market pullback suggests heightened selling pressure, indicating a potential shift in sentiment among market participants. This surge in volume often accompanies significant price movements, reinforcing the validity of the pullback. 

Conversely, a decrease in volume may signal a lack of conviction in the prevailing trend, potentially foreshadowing a market reversal. Analyzing volume alongside price movements provides valuable insights into market dynamics, helping investors anticipate and respond to pullbacks effectively.

Moreover, observing volume spikes or divergences relative to price trends can offer early warnings of impending pullbacks, allowing investors to adjust their strategies accordingly. By paying close attention to volume patterns, traders can discern the strength of market movements and make informed decisions about entering or exiting positions. Volume analysis serves as a vital tool in assessing market sentiment and identifying potential opportunities or risks during pullback scenarios.

5. Price Patterns:

Price patterns, such as head and shoulders, double tops, and triangles, provide valuable insights into market sentiment and potential trend reversals. These patterns emerge as a result of the collective actions of market participants, reflecting shifts in supply and demand dynamics. During a market pullback, specific price patterns may signal exhaustion among buyers or sellers, indicating a potential reversal in the prevailing trend. 

Traders often use chart patterns in conjunction with other technical indicators to confirm their trading decisions and manage risk effectively. By identifying and interpreting price patterns accurately, investors can anticipate market pullbacks and capitalize on emerging opportunities in the market.

Understanding the intricacies of these patterns requires a blend of technical analysis and market intuition. Traders diligently monitor price movements, looking for recognizable patterns that may signal shifts in market sentiment and potential trend reversals. By mastering the art of pattern recognition, investors can enhance their trading strategies and navigate market pullbacks with confidence. Recognizing these patterns early guides traders to advantageous positions during pullbacks.

6. Fibonacci Retracement Levels:

Fibonacci retracement levels are essential tools for traders navigating market pullbacks. These horizontal lines indicate potential support or resistance levels based on key Fibonacci ratios such as 23.6%, 38.2%, 50%, 61.8%, and 100%. Traders frequently employ these levels during market pullbacks to pinpoint areas where the price may reverse and resume its prior trend. 

By analyzing the extent of retracement relative to the preceding move, investors can assess the pullback’s strength and anticipate possible reversal points. Moreover, Fibonacci retracement levels act as dynamic support or resistance zones, providing guidance for traders’ decision-making processes and assisting in risk management.

Incorporating Fibonacci analysis into trading strategies enhances traders’ abilities to navigate market pullbacks effectively and capitalize on emerging opportunities. This systematic approach offers a structured method for identifying critical levels and making informed trading decisions amidst market volatility. By leveraging Fibonacci retracement levels alongside other technical indicators, investors can gain deeper insights into market dynamics and improve their overall trading performance during pullback scenarios.

7. Volatility Index (VIX):

The Volatility Index (VIX), often dubbed the fear index, measures the market’s anticipation of future volatility through options pricing. During market pullbacks, the VIX tends to surge as investors fret over potential downside risks. This spike in the VIX mirrors elevated fear and uncertainty, signaling a heightened likelihood of a market pullback.

Traders commonly view the VIX as a contrarian indicator; exceedingly high readings indicate excessive fear, potentially signaling buying opportunities. By monitoring shifts in the VIX alongside other technical indicators, investors glean valuable insights into market sentiment, facilitating anticipation of potential pullbacks.

This awareness empowers them to adapt their strategies accordingly, optimizing their positions and seizing emerging opportunities. Thus, leveraging the VIX as a gauge of market sentiment enables investors to navigate turbulent periods with greater confidence and strategic precision. Incorporating VIX analysis into trading strategies offers a comprehensive approach to risk management, providing traders with a clearer understanding of market dynamics and potential pullback scenarios.

Which indicator has the highest accuracy?

Among indicators, it’s challenging to definitively identify one with the highest accuracy, as their effectiveness can vary depending on market conditions and individual trading strategies. However, some traders find Moving Average Convergence Divergence (MACD) to be particularly reliable due to its ability to capture changes in trend momentum. MACD’s incorporation of moving averages and signal line crossovers provides valuable insights into market dynamics, making it a popular choice among traders for identifying potential trend reversals and anticipating market pullbacks.

Despite its popularity, it’s essential for traders to conduct thorough analysis and consider multiple indicators to make well-informed trading decisions, as no single indicator guarantees accuracy in all scenarios. Ultimately, traders should use MACD alongside other indicators to enhance their trading strategies and navigate market fluctuations effectively, ensuring a balanced and informed approach to decision-making.