

Article summary
The Origins of the Fibonacci Sequence
 The Fibonacci sequence in trading reveals the mathematical elegance behind market patterns and price movements. Understanding how to apply these principles can significantly enhance your technical analysis. The Fibonacci sequence, as we know it today, traces its roots to 1202 when Leonardo Pisano, better known as Fibonacci, introduced it to the Western world in his groundbreaking book Liber Abaci (The Book of Calculation). Fibonacci, an Italian mathematician born in Pisa, was inspired by the advanced mathematical knowledge he encountered during his travels to North Africa, where he studied the arithmetic systems of the Arabic world.
While Fibonacci’s sequence is celebrated in the modern era, its origins predate his writings. Ancient Indian mathematicians had already documented the sequence as early as 200 BCE in their studies of Sanskrit prosody, where the numbers described the patterns of syllables in poetry. Fibonacci adapted this mathematical concept and demonstrated its applications in solving practical problems, most notably in his famous example of the growth of rabbit populations.
The Golden Ratio’s Connection to the Fibonacci Sequence
 As Fibonacci’s numbers progress (e.g., 0, 1, 1, 2, 3, 5, 8, 13, 21…), dividing any number by its predecessor yields a ratio that increasingly approaches the Golden Ratio, approximately 1.618. This mystical number, often denoted by the Greek letter phi (Φ), is not just a mathematical abstraction but a pervasive constant found in art, architecture, and nature.
Historical Uses of the Golden Ratio
1. Ancient Egyptian Architecture: The Great Pyramid of Giza
The Great Pyramid of Giza, constructed over 4,500 years ago, reflects the Golden Ratio in its design. The ratio of its slant height to its base length approximates phi (1.618), symbolizing balance and cosmic harmony. This proportionality continues to captivate mathematicians and architects, showcasing the Egyptians’ remarkable grasp of symmetry and geometry.
2. Ancient Greece: The Parthenon
The Parthenon, built in 5th century BCE Athens, incorporates the Golden Ratio into its columns and façade, creating a sense of harmony and visual appeal. Revered by mathematicians like Pythagoras, phi symbolized the Greek ideal of beauty rooted in precise mathematical relationships, making the Parthenon a lasting icon of balanced design.
Fibonacci in Nature: The Code of Creation
The Fibonacci sequence and the Golden Ratio underpin countless natural phenomena. This “code of creation” reveals itself in structures as varied as:
Start earning 60% a year with automated trading Free Sign Up
- Plant Growth: The arrangement of leaves, branches, and seeds in plants often follows Fibonacci numbers, optimizing sunlight exposure and space efficiency.
- Seashells and Spirals: The nautilus shell and spiral galaxies mirror the Fibonacci spiral, a geometric expression of the sequence.
- Human Anatomy: Proportions of the human body, from the length of forearms to the arrangement of facial features, often approximate the Golden Ratio, symbolizing balance and symmetry.
The Transition from Nature to Financial Markets
In the 20th century, mathematicians and market analysts like Ralph Nelson Elliott noticed the same Fibonacci principles echoed in financial markets. Elliott, the founder of the Elliott Wave Theory, integrated Fibonacci retracements and extensions into his analysis of price movements. He observed that market trends, much like patterns in nature, often retrace or extend by proportions derived from Fibonacci ratios.
This realization brought the Fibonacci sequence full circle — from ancient Indian mathematics, through art and nature, to the dynamic and unpredictable world of trading. Today, Fibonacci levels are integral to technical analysis, serving as a bridge between historical insight, natural patterns, and modern financial strategy.
Fibonacci’s Enduring Legacy
Fibonacci’s genius lies not just in identifying a sequence but in unveiling a universal truth that transcends time and application. From the rhythms of poetry and the beauty of architecture to the chaos of the financial markets, Fibonacci’s work continues to reveal order where none seems apparent. For traders, it offers a glimpse into the mathematical fabric of market psychology — a tool as timeless as the patterns it describes.
The Power of Fibonacci Levels in Financial Markets
Fibonacci levels have become an integral part of technical analysis due to their remarkable ability to predict potential areas of support and resistance in price movements. This predictive power is rooted in the natural proportions derived from the Fibonacci sequence, which seem to resonate with the collective psychology of market participants.
When applied to trading, Fibonacci retracement and extension levels offer traders a systematic way to interpret price action, identify entry and exit points, and improve their overall strategy.
Key Fibonacci Levels in Trading: Mastering the Fibonacci Retracements in Trading
The Fibonacci sequence in trading highlights levels like 38.2% and 61.8%, which frequently act as critical support or resistance zones.
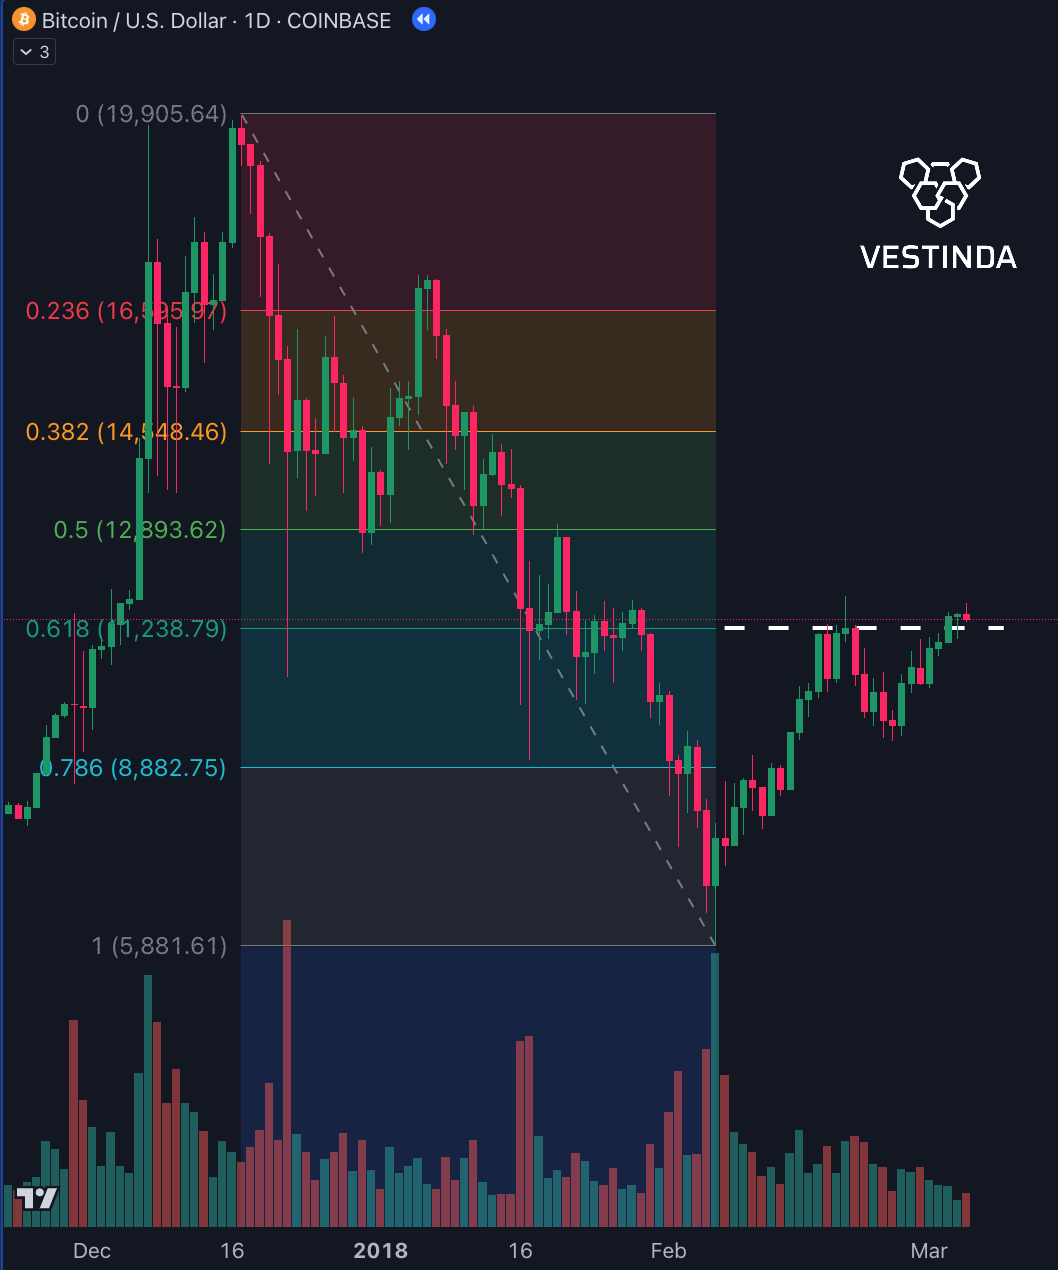 1. 23.6% Level: A Shallow Retracement
Represents the first significant pullback in a trend.
Often signals a continuation of strong trends where price barely retraces before resuming its direction.
Use Case: Ideal for identifying areas in robust trends where price may consolidate briefly before continuing.
2. 38.2% Level: A Moderate Pause
Indicates a stronger retracement, often acting as the first line of defense for an ongoing trend.
Use Case: Useful for setting conservative stop-loss levels or initiating trades in trending markets.
3. 50% Level: The Midpoint
While not a true Fibonacci level, the 50% retracement is widely regarded as a psychological level where traders expect price to find balance.
Use Case: Often acts as a decision-making point for whether the trend will resume or reverse.
4. 61.8% Level: The Golden Ratio
The most critical retracement level, reflecting the Golden Ratio.
Use Case: A prime zone for significant reversals or strong trend continuations, making it a focal point for trade entries or exits.
5. 100% Level: Complete Retracement
Represents the full retracement of a price move.
Use Case: Indicates a failed trend or the formation of a new trend.
Fibonacci Retracements in Practical Trading
- Identifying TrendsTraders use Fibonacci retracements to analyze the depth of pullbacks within trends. In an uptrend, retracements are drawn from a significant low (swing low) to a high (swing high), and vice versa in a downtrend.
- Setting Entry PointsRetracement levels provide low-risk entry points within a trend. For instance, a buy order can be placed near the 38.2% or 61.8% levels with a stop-loss slightly below the next level.
- Defining Exit PointsCombining retracement and extension levels helps traders set precise exit targets. A trader might aim for the 161.8% extension level as a profit target when the trend resumes after a retracement.
Using Fibonacci Extensions in Trading: Going Beyond Retracements
 Fibonacci extensions take the utility of Fibonacci tools one step further by helping traders estimate potential price targets that go beyond the original trend’s movement. While Fibonacci retracements are focused on identifying support and resistance during pullbacks, extensions are used to project where the price might head once it resumes its trend. These levels — commonly 127.2%, 161.8%, and 200% — offer predefined targets for traders looking to capture gains during strong trend continuations. Fibonacci extensions are a vital part of the Fibonacci sequence in trading, projecting price targets beyond the original trend.
Practical Use of Fibonacci Extensions in Trading
1. 127.2% Level: A Moderate Target for Strong but Steady Trends
The 127.2% extension level is often the first significant target traders use after a retracement. It is particularly useful in trends that are gaining momentum but remain steady. This level serves as a conservative profit-taking point, offering a balance between risk and reward.
2. 161.8% Level: The “Golden Extension”
The 161.8% extension, rooted in the Golden Ratio, is one of the most popular targets in technical analysis. It often represents the ultimate target in a strong trend, as prices frequently encounter resistance or reversal around this level. Traders regard it as a reliable point for taking profits or planning re-entries.
3. 200% Level: An Aggressive Continuation Target
The 200% extension level reflects a price move that is twice the size of the original trend. While less commonly reached, this level is useful in extraordinary trends driven by strong fundamentals or news. It is often used by aggressive traders aiming to capitalize on powerful momentum.
Combining Fibonacci Levels with Other Indicators
To improve accuracy, Fibonacci levels are rarely used in isolation. Pairing them with complementary tools provides a more holistic view of the market:
- TrendlinesDrawing trendlines along Fibonacci levels confirms their validity when price respects these zones.
- Moving AveragesMoving averages like the 50 EMA or 200 EMA often align with Fibonacci retracements, reinforcing the significance of certain levels.
- Candlestick PatternsReversal patterns such as hammer, engulfing, or doji candles at Fibonacci levels can validate entry or exit points.
- Momentum IndicatorsUsing RSI or MACD in conjunction with Fibonacci retracements ensures traders act only when momentum supports their decisions.
The Psychological Edge of Fibonacci
What makes Fibonacci levels so effective is their self-fulfilling nature. As these levels are widely recognized, they tend to attract significant market activity, causing price reactions even in the absence of other factors. Traders anticipate these moves, amplifying their impact and reinforcing their reliability.
Limitations and Considerations
While Fibonacci tools offer valuable insights, they are not infallible. Their success depends on the skill and experience of the trader:
- Subjectivity: Different traders may identify varying swing highs and lows, leading to discrepancies in Fibonacci levels.
- Market Volatility: In highly volatile markets, prices can overshoot Fibonacci levels, rendering them less reliable.
To mitigate these limitations, traders should:
- Combine Fibonacci levels with other technical tools.
- Avoid relying solely on Fibonacci levels during periods of extreme market volatility.
Conclusion: Fibonacci as a Roadmap for Trading
Fibonacci tools provide traders with a roadmap to navigate market fluctuations, offering a structured approach to identify key levels of support, resistance, and potential price targets. By mastering the Fibonacci sequence in trading, you can approach markets with greater confidence, transforming timeless patterns into actionable strategies.

With over seven years of experience in trading since 2017, I specialize in cryptocurrency markets while sharing insights through engaging content. Proud to rank among the top 100 most popular analysts on TradingView of all time, I bring a blend of expertise, passion, and actionable strategies to the trading community.