
Have you ever wondered how traders identify key turning points in the market and capitalize on them for profit? One of the essential concepts in technical analysis that enables traders to do just that is the break of structure.
A break of structure occurs when the market price breaches a significant level of support or resistance, signaling a potential shift in market sentiment and trend direction. In this comprehensive guide, we’ll delve into the intricacies of break of structure trading, exploring its definition, significance, and practical applications.
From understanding the anatomy of a break of structure to mastering entry and exit strategies, this article will equip you with the knowledge and skills needed to trade breakouts successfully. Let’s embark on a journey to unlock the secrets of break of structure trading and harness its potential for profit.
Article summary
What is a break of structure (BOS)?
A break of structure in trading refers to a significant movement in price that breaches a key level of support or resistance on a chart. This breach signifies a shift in market sentiment and often indicates the beginning of a new trend or the continuation of an existing one. In technical analysis, identifying breaks of structure is crucial for traders as they provide valuable insights into market dynamics and potential trading opportunities.
A break of structure typically occurs when the price surpasses a previous swing high or low, confirming a change in the balance of supply and demand. Traders use this information to enter positions in anticipation of further price movement in the direction of the breakout.
Start earning 60% a year with automated trading Free Sign UpWhat is the break of structure entry?
The break of structure entry is a trading strategy that involves entering a trade when the price of an asset breaks through a significant level of support or resistance on a chart. Traders identify break of structure entry points as potential opportunities to capitalize on shifts in market sentiment and trend direction. When the price breaches a key level of support, it indicates that selling pressure has overwhelmed buying interest, potentially signaling a downtrend.
Conversely, a break above a resistance level suggests that buying pressure has overcome selling interest, potentially indicating an uptrend. Traders often use technical indicators, such as trendlines, moving averages, or chart patterns, to confirm break of structure entry signals and determine optimal entry points for their trades. This strategy allows traders to enter positions early in a new trend, maximizing profit potential while managing risk.
Examples
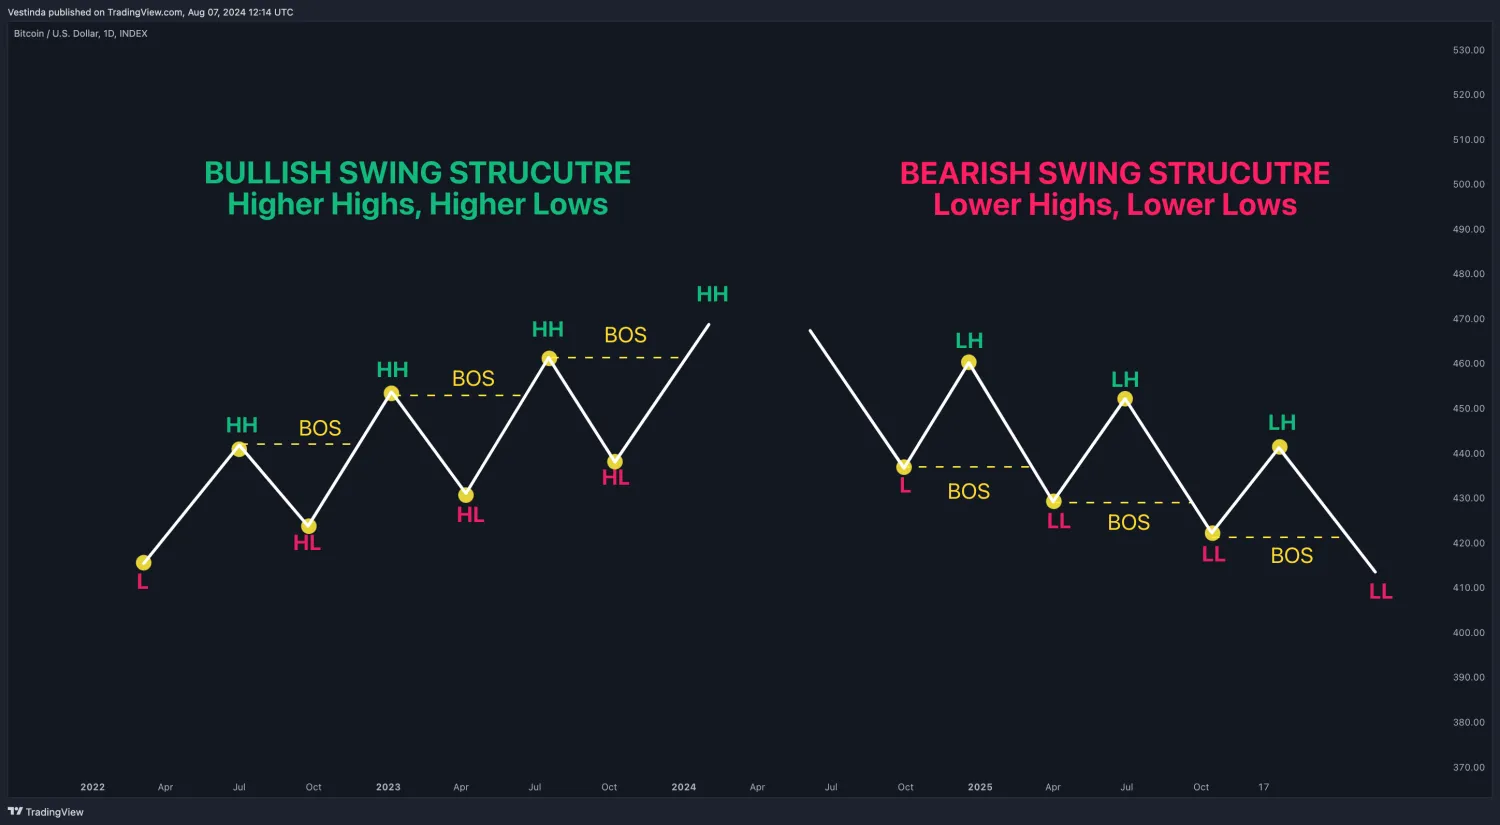
Bullish Break of Structure:
Scenario: The market is in an uptrend, and the price breaks above a resistance level.
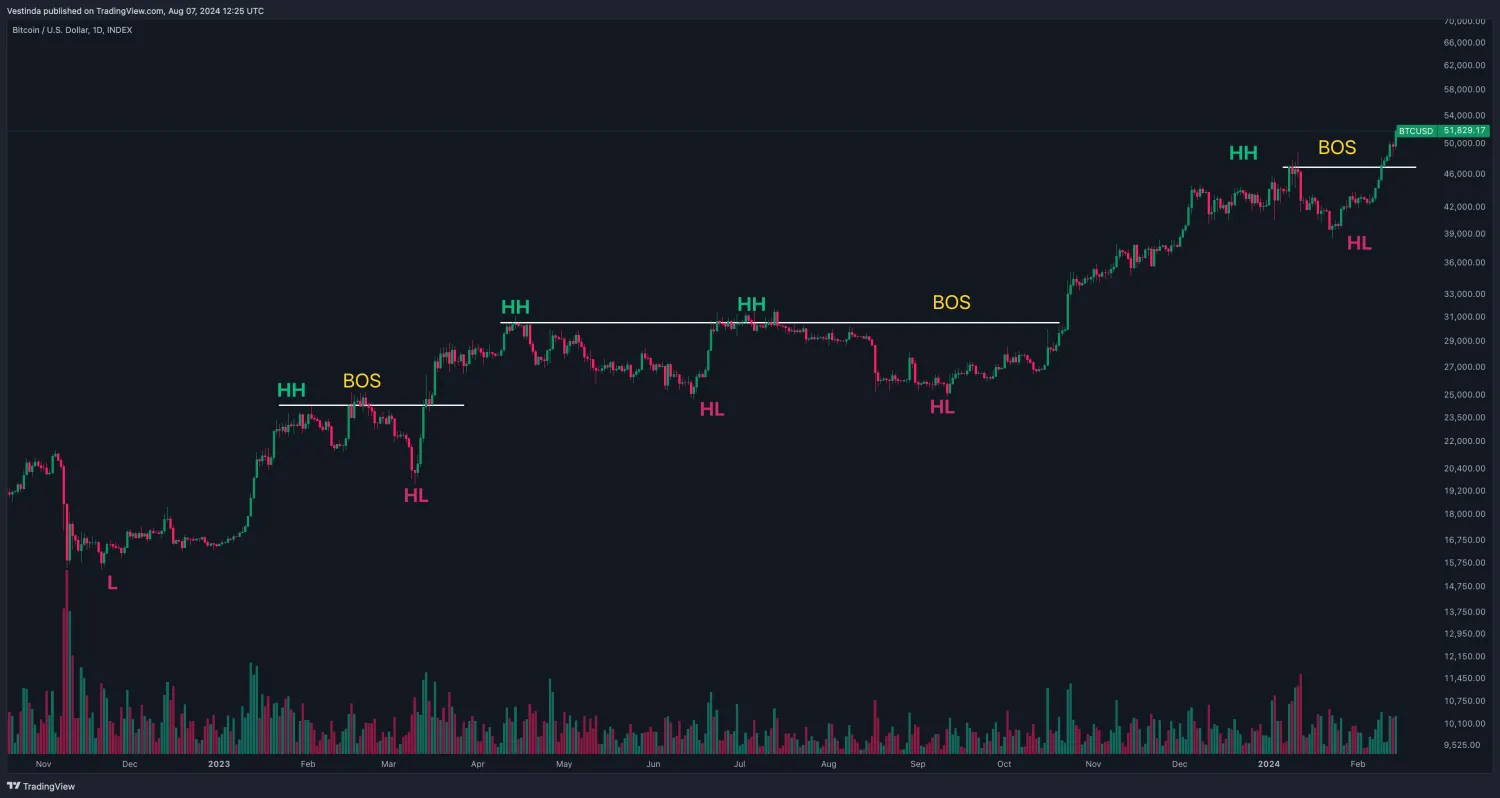
Action: Traders may enter long positions upon confirmation of the breakout, ideally on a retest of the broken resistance, now acting as support.
Bearish Break of Structure:
Scenario: The market is in a downtrend, and the price breaks below a support level.
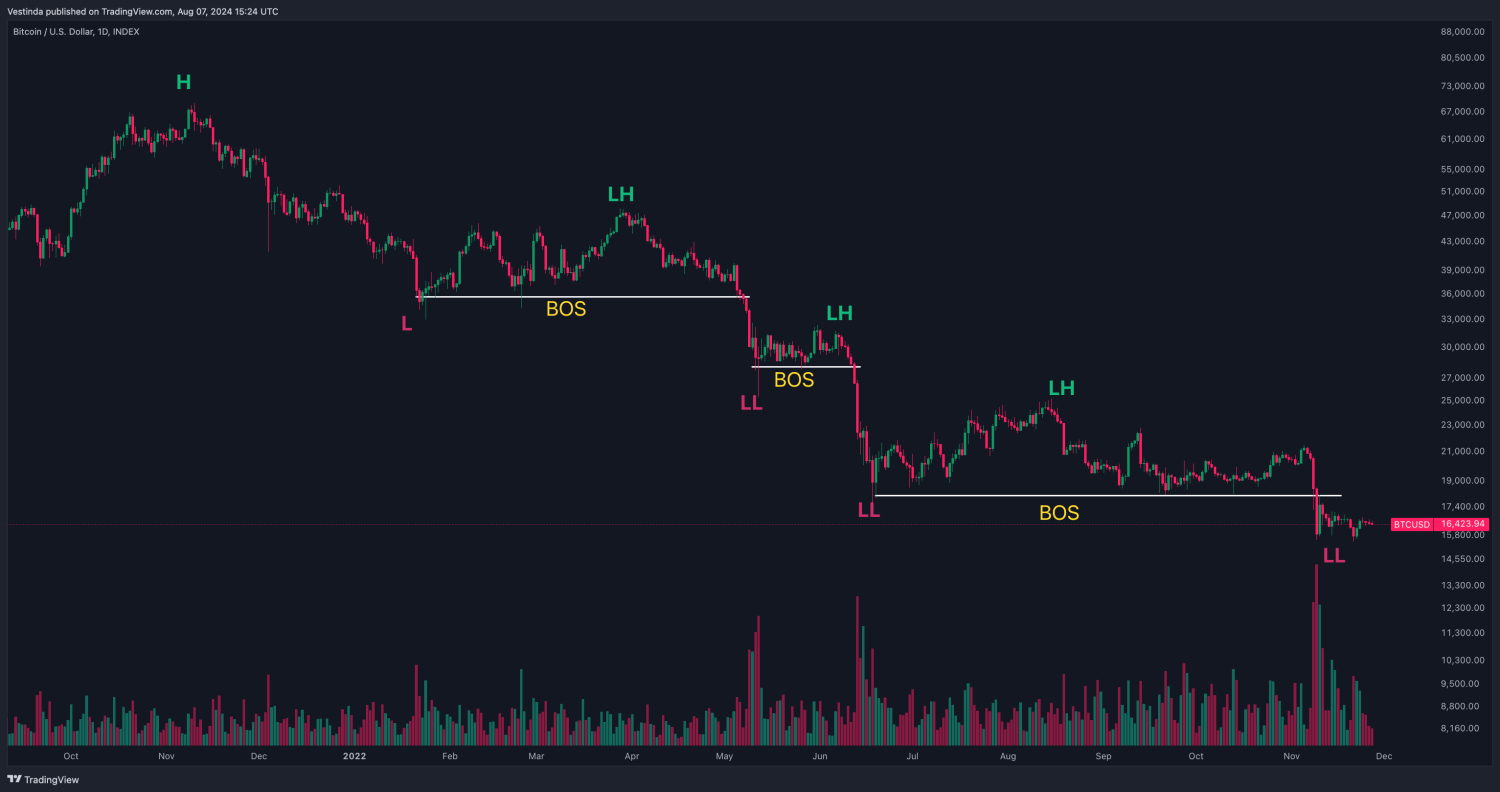
Action: Traders may enter short positions upon confirmation of the breakdown, ideally on a retest of the broken support, now acting as resistance.
How to identify a break of structure
Identifying a break of structure in trading requires a comprehensive approach that integrates multiple factors and considerations. Here’s an in-depth exploration of the steps involved:
- Identify Key Levels: Start by conducting thorough technical analysis to identify significant levels of support and resistance on the price chart. These levels are pivotal areas where historical price action has encountered obstacles or reversals. Traders often employ various tools and techniques, such as trendlines, Fibonacci retracements, pivot points, and moving averages, to pinpoint these critical levels accurately.
- Observe Price Action: Once key levels are identified, closely monitor price action as the market approaches these levels. Pay attention to the behavior of price movements, such as the speed, momentum, and intensity of price changes, as they interact with support or resistance zones. Look for signs of strength or weakness in the price action, such as bullish or bearish candlestick patterns, breakouts, or breakdowns.
- Volume Confirmation: In addition to analyzing price action, consider the accompanying trading volume during the breakout or breakdown. Significant increases in trading volume accompanying the price movement indicate heightened market participation and conviction behind the breakout. High trading volume acts as validation of the break of structure, confirming the likelihood of a genuine shift in market sentiment and trend direction.
- Retest: Following the initial breakout or breakdown, anticipate a potential retest of the broken level. A successful retest occurs when the price returns to the previous support or resistance level and validates it as a new level of support or resistance. Traders view a successful retest as a confirmation of the break of structure, providing an opportunity to enter positions with improved risk-reward ratios.
- Confirmation Signals: Utilize a diverse array of technical indicators and tools to validate the strength and reliability of the break of structure. These indicators may include trend-following indicators (e.g., moving averages), momentum oscillators (e.g., Relative Strength Index or RSI), volume-based indicators (e.g., On-Balance Volume or OBV), and chart patterns (e.g., flags, triangles, or head and shoulders patterns). Confirmation signals help traders assess the robustness of the break of structure and make well-informed decisions regarding entry or exit positions.
What is a change of character in trading (CHOCH)?
A change of character in trading (CHOCH) refers to a shift in market behavior or price action that indicates a transition from one market phase to another. This change is often characterized by a noticeable alteration in the way prices move, volume dynamics, or the behavior of market participants. Traders use CHOCH to identify potential turning points in the market, such as the end of a trend or the beginning of a new one. Recognizing CHOCH allows traders to adapt their strategies accordingly, whether it involves adjusting positions, entering new trades, or managing risk. Common indicators of CHOCH include significant shifts in volatility, the emergence of new patterns or chart formations, or changes in the balance between buying and selling pressure.
What is the difference between break of structure and change of character?
A “break of structure” in trading typically refers to a specific event where the price breaches a significant level of support or resistance on a chart. This breach often signifies a shift in market sentiment and can indicate the potential beginning or continuation of a trend. Traders actively look for break of structure points as potential entry or exit opportunities, depending on their trading strategy.
On the other hand, a “change of character” denotes a broader shift in market behavior or dynamics. It’s not necessarily tied to a single event like a break of structure but rather encompasses a series of changes over time. These changes could include alterations in trading volume, volatility, or the behavior of market participants. A change of character often signals a transition from one market phase to another, such as the end of a trend or the beginning of a new one. Traders monitor changes of character to adapt their strategies accordingly and capitalize on evolving market conditions.
Why is break of structure important?
The break of structure is crucial in trading because it provides valuable insights into shifts in market sentiment and trend direction. By identifying key levels of support and resistance and monitoring breakouts or breakdowns, traders can anticipate potential changes in market dynamics. A break of structure often signifies the beginning or continuation of a trend, allowing traders to enter positions in alignment with the prevailing market momentum.
Moreover, breakouts or breakdowns can offer high-probability trading opportunities with favorable risk-reward ratios. Additionally, successful validation of a break of structure through volume confirmation and retests enhances the reliability of trading signals, enabling traders to make well-informed decisions. Overall, understanding and effectively utilizing break of structure analysis can significantly enhance a trader’s ability to navigate the markets and capitalize on profitable trading opportunities.
How do I trade with Bos?
Trading with Bos (Break of Structure) involves identifying key support and resistance levels on a price chart. Look for a clear pattern where the price breaks below (in the case of a bearish Bos) or above (in the case of a bullish Bos) these levels, indicating a potential trend reversal or continuation.
Confirm the Bos with additional technical indicators like moving averages, trendlines, or momentum oscillators to validate the strength of the breakout. Enter the trade after the Bos is confirmed, placing stop-loss orders below support (for bullish Bos) or above resistance (for bearish Bos) to manage risk. Target profit levels can be set based on the distance from the breakout point to the next significant support or resistance level, ensuring a favorable risk-to-reward ratio for the trade.
Master Break of Structure with Vestinda
Ready to capitalize on market breakouts? Break of structure is a powerful strategy, but perfecting it requires practice. Backtest your breakout plans using historical data on Vestinda’s platform. Refine entry and exit points, and gain confidence before deploying your strategy live. Vestinda empowers you to master break of structure and seize market opportunities. Sign up today and unlock your trading potential!

Ebiere Watchman is a prolific writer specialized in web 3.0 and finance. Ebiere’s experience includes research projects, sales copywriting, and storytelling. She prides herself in crafting impeccable content to drive mass adoption in cryptocurrency.
