-
100,000 available assets New
-
years of historical data
-
practice without risking money

Quantitative Strategies & Backtesting results for TRX
Here are some TRX trading strategies along with their past performance. You can validate these strategies (and many more) for free on Vestinda across thousands of assets and many years of historical data.
Quantitative Trading Strategy: Keltner Channel and TEMA Trend-Following on TRX
According to the backtesting results for the trading strategy conducted between November 22, 2018, and November 22, 2023, several key statistics have been observed. The profit factor for this strategy stands at 1.36, indicating that for every dollar risked, $1.36 was gained. The annualized return on investment (ROI) comes in at an impressive 34.63%, highlighting the strategy's effectiveness over a five-year period. On average, each trade was held for approximately 2 days and 6 hours. With an average of 0.41 trades per week, the strategy exhibited a conservative approach. Out of 108 closed trades, 37.96% were winning trades, resulting in a remarkable return on investment of 173.17%.

 TRXUSDT

Choose another period and try again.
Quantitative Trading Strategy: Aroon Up/Down Trend Reversal Strategy on TRX
The backtesting results for this trading strategy spanning from November 23, 2018, to November 23, 2023, reveal promising statistics. The profit factor stands at 1.33, indicating that the strategy generated 33% more profits than losses. This is further reflected in the annualized ROI of 57.77%. On average, positions were held for approximately 3 weeks and 4 days, providing a valuable insight into the strategy's timing. With an average of 0.13 trades per week and a total of 36 closed trades, the frequency of trades remains relatively low. However, the strategy still managed to achieve an impressive return on investment of 288.86%. Winning trades account for 47.22% of all trades, suggesting room for improvement to increase profitability in the future.
TRXUSDT
Choose another period and try again.
TRX (Tron) Candlestick Patterns: Focus on Bullish and Bearish Engulfing Patterns
Introduction
Candlestick patterns are a cornerstone of technical analysis, helping traders make informed decisions. Among these patterns, the Bullish Engulfing and Bearish Engulfing stand out for their reliability and ease of identification, especially in cryptocurrency markets like TRX (Tron). This guide focuses on mastering these patterns to enhance your trading strategy.
What Are Bullish and Bearish Engulfing Patterns?
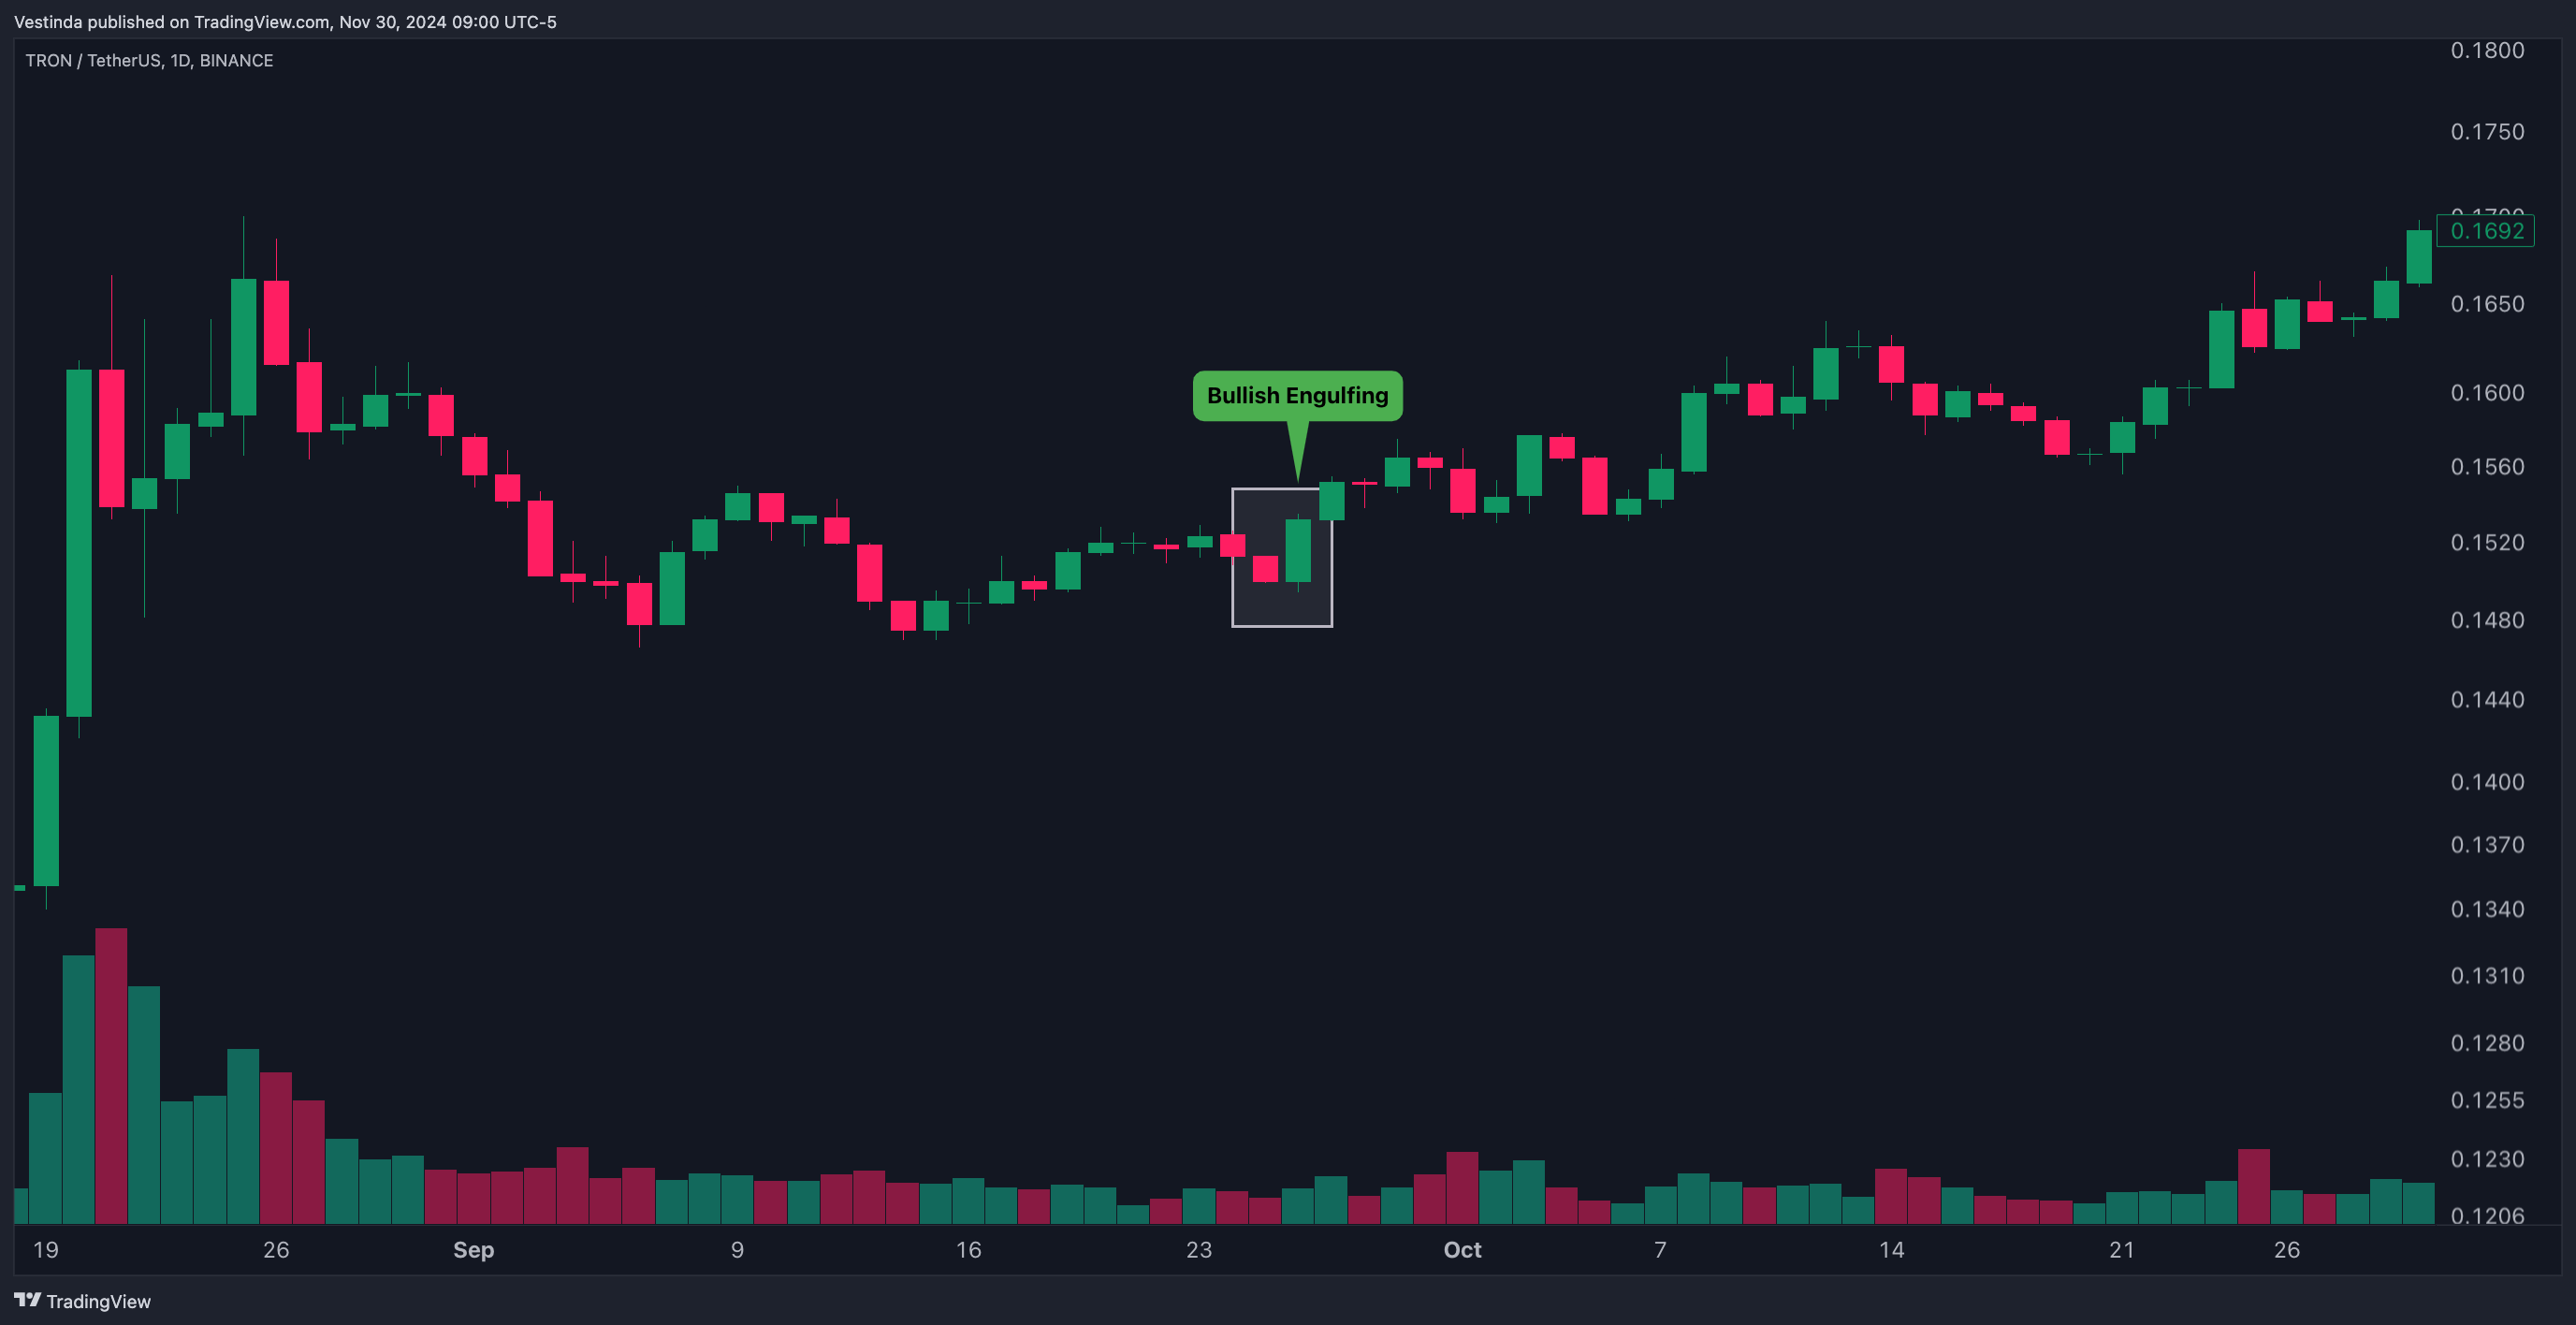
1. Bullish Engulfing Pattern:
Description: A bullish candle completely engulfs the body of the preceding bearish candle.
Significance: Indicates a potential reversal to the upside, signaling buyer dominance.
Key Characteristics:
- Appears after a downtrend or at key support levels.
- The second candle (bullish) is larger, with no overlap of the previous bearish candle’s body.
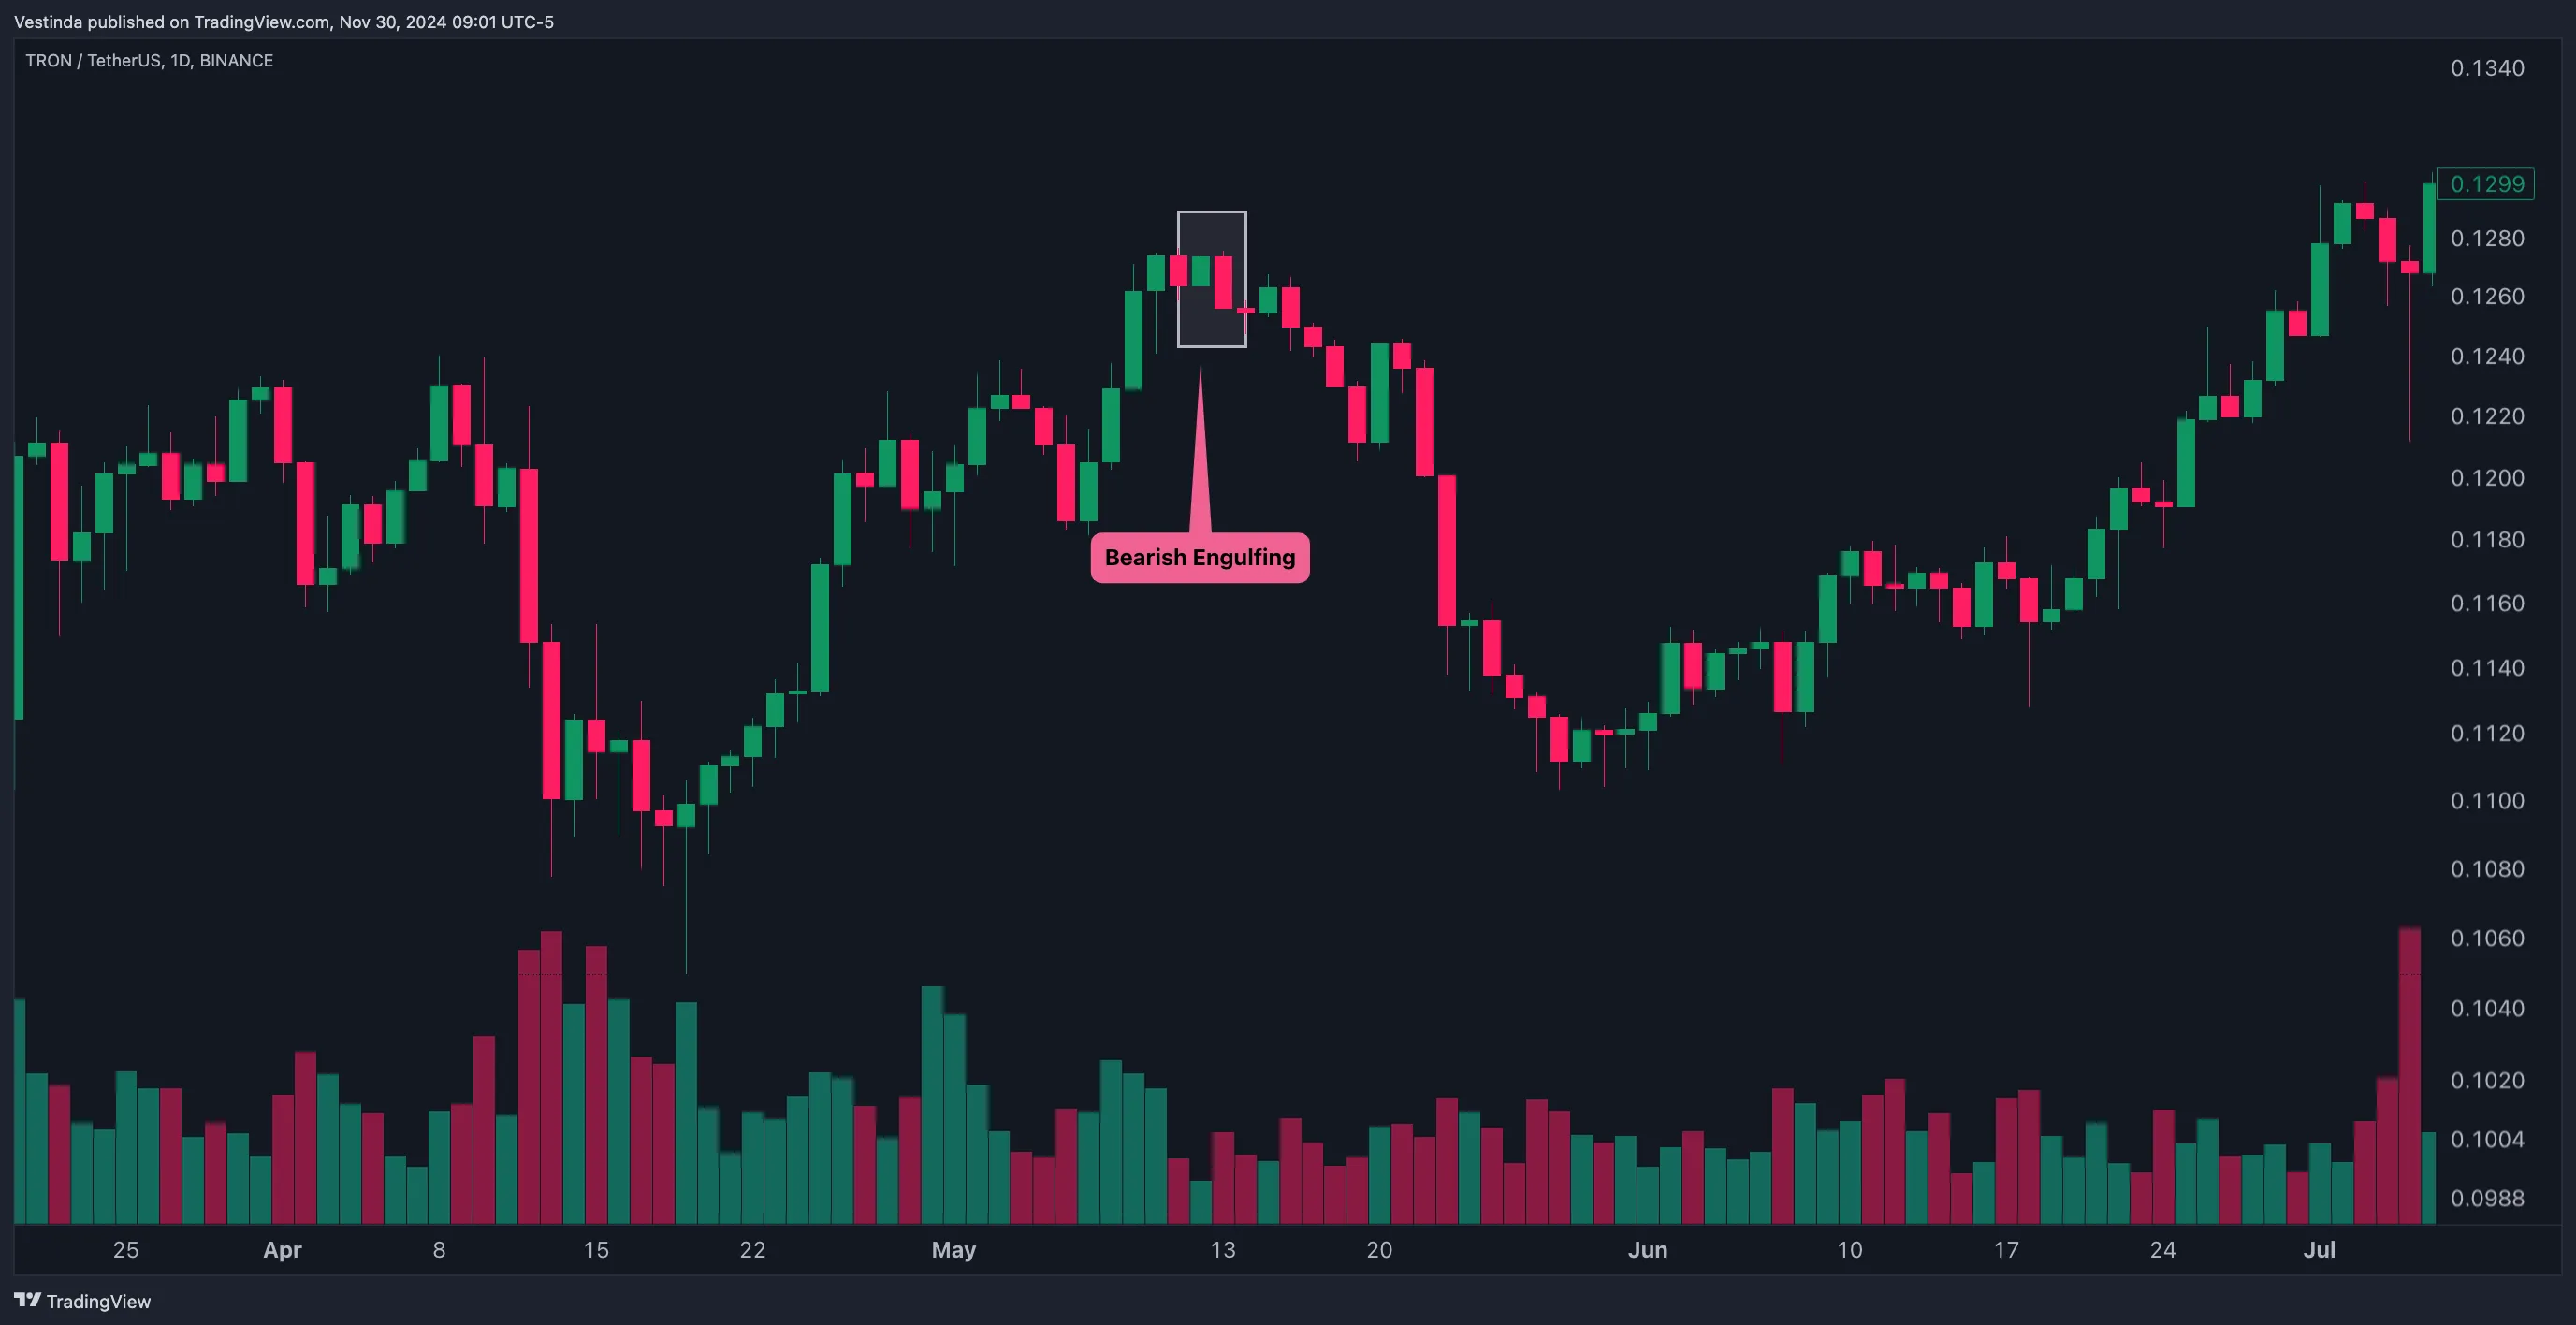
2. Bearish Engulfing Pattern:
Description: A bearish candle completely engulfs the body of the preceding bullish candle.
Significance: Signals a potential reversal to the downside, showing seller dominance.
Key Characteristics:
- Appears after an uptrend or near resistance levels.
- The second candle (bearish) is larger, with no overlap of the previous bullish candle’s body.
How to Trade Bullish and Bearish Engulfing Patterns
Trading a Bullish Engulfing Pattern:
- Setup: Look for the pattern near support levels or during a pullback in an uptrend.
- Entry Signal: Enter long at the close of the bullish engulfing candle or on the breakout above its high.
- Stop-Loss: Place a stop-loss below the low of the engulfing candle or the nearby support level.
- Take-Profit: Target the next resistance level or use a risk-reward ratio (e.g., 1:2).
Trading a Bearish Engulfing Pattern:
- Setup: Look for the pattern near resistance levels or during a pullback in a downtrend.
- Entry Signal: Enter short at the close of the bearish engulfing candle or on the breakdown below its low.
- Stop-Loss: Place a stop-loss above the high of the engulfing candle or the nearby resistance level.
- Take-Profit: Target the next support level or use a risk-reward ratio (e.g., 1:2).
Confirming Engulfing Patterns with Indicators
- RSI (Relative Strength Index): Use RSI to confirm overbought or oversold conditions.
- Example: A Bullish Engulfing pattern near an oversold RSI (<30) strengthens the signal.
- Volume Analysis: Look for increased trading volume during the engulfing candle to confirm market participation.
- Moving Averages: Combine with a 21-period EMA to align trades with the trend.
- Example: Bullish Engulfing above the EMA indicates a strong continuation signal.
Example Trading Scenario
- Setup: TRX is in a downtrend and approaches a support zone.
- Pattern Formation: A Bullish Engulfing pattern forms at the support level.
- Entry: Enter a long position at the close of the bullish engulfing candle.
- Risk Management: Place a stop-loss just below the support level.
- Exit: Take profit at the next resistance level or when RSI enters overbought territory.
Tips for Identifying Engulfing Patterns in Crypto Charts
- Focus on High-Volume Zones: Engulfing patterns near key volume areas are more reliable.
- Use Multiple Timeframes: Validate patterns on higher timeframes for stronger confirmation.
- Avoid Weak Patterns: Ignore engulfing patterns with negligible size differences between the two candles.
Advantages of Using Engulfing Patterns
- Clarity: Easy to spot on charts, even for beginners.
- Versatility: Works across all timeframes and market conditions.
- High Reliability: Provides clear entry and exit signals when combined with other technical tools.
Common Mistakes to Avoid
- Trading in Isolation: Always confirm with support/resistance levels or indicators.
- Ignoring Volume: Patterns with low volume may indicate weak market participation.
- Forcing Trades: Wait for clear and well-formed engulfing patterns.
Conclusion
Bullish and Bearish Engulfing patterns are among the most reliable candlestick signals for trading TRX. By understanding their characteristics, combining them with technical indicators, and practicing disciplined risk management, traders can capitalize on Tron’s price movements effectively. Continuously refine your approach and adapt to market conditions for consistent success.
Optimal Tron Trading with Candlestick Patterns
- Start by learning the different types of candlestick patterns.
- Analyze TRX price charts to identify potential candlestick patterns.
- Look for confirmation signals such as trend lines, support, and resistance levels.
- Determine the significance of the identified pattern based on its location and preceding price action.
- Apply technical analysis indicators to validate the potential trade setup.
- Set appropriate entry and exit points, along with a stop-loss level.
- Execute the trade based on your analysis and risk management strategy.
Lucifer's Trading Signal
The Morning Star pattern is a bullish reversal pattern in stock trading. It consists of three candlesticks, typically appearing after a downtrend. The first candlestick is a long red candle, indicating selling pressure. The second candlestick is a small-bodied candle, signaling indecision in the market. The third candlestick is a long green candle, suggesting a potential upward trend. This pattern signifies a shift in investor sentiment, with buyers overpowering sellers. It is seen as a bullish signal, indicating that the stock may reverse its downward trend and start moving upwards. The Morning Star pattern can be used by traders to identify potential buying opportunities, especially in combination with other technical indicators. It is important to note that the appearance of the Morning Star pattern does not guarantee a trend reversal and should be validated with other analysis tools. TRX, also known as Tron, is a digital cryptocurrency that uses blockchain technology.
Unlocking TRX: Candlestick Patterns in Options Trading
Candlestick patterns play a significant role in TRX options trading. These patterns provide valuable insights into price movements and can help traders make more informed decisions. By analyzing the shape and formation of candlesticks, traders can identify potential trends, reversals, and market sentiment. Some common candlestick patterns include doji, hammer, and engulfing patterns. These patterns can indicate bullish or bearish market conditions. For example, a doji pattern with a small body and long wicks suggests indecision in the market and a potential trend reversal. On the other hand, a hammer pattern with a small body and long lower shadow indicates a bullish market and potential buying opportunities. Traders can use candlestick patterns as a tool to enhance their trading strategies and improve their chances of success in TRX options trading.
TRX's Whirling Candlestick Insights
A spinning top candlestick pattern is a single candlestick with a small body and long upper and lower shadows. It indicates indecision in the market and can signal a potential reversal in trend. TRX, also known as Tron, is a popular cryptocurrency that utilizes blockchain technology. Traders often use candlestick patterns to identify potential buy or sell signals in the market. When a spinning top candlestick appears in a chart, it suggests that buyers and sellers are in a state of equilibrium. The long shadows indicate that there was significant price movement during the trading session, but ultimately, the candle closed near its opening price. This pattern implies that market participants are unsure about the next directional move. Traders can use this information to analyze the market sentiment and make informed trading decisions.
-
Track your
Crypto Portfolio -
Copy Crypto trading
strategies -
Build trading strategies
with no code
-
Backtest trading strategies
on Crypto, Forex, Stocks, etc. -
Demo Trading
Risk-free Paper Trading -
Automate trading strategies
with Live Trading
Frequently Asked Questions
A hammer candlestick is a bullish reversal pattern in technical analysis. It is characterized by a small body at the top of the candlestick and a long lower shadow, resembling a hammer. The hammer candlestick suggests that sellers were initially in control but were overwhelmed by buyers. Traders interpret this pattern as a potential trend reversal signal. It is used to determine entry or exit points for trades, with a focus on buying opportunities. However, it is advisable to consider other indicators and confirmations before making trading decisions solely based on a hammer candlestick.
To use candlestick patterns for Elliott Wave analysis, start by identifying the Elliott Wave structure and label each wave. Next, analyze candlestick patterns within each wave to confirm wave counts. Look for patterns such as doji, engulfing, or harami, which can provide insights into potential trend reversals or continuation. Pay attention to significant pattern formations like Morning Stars or Evening Stars. Also, consider the color and shape of the candlesticks, as they can indicate bullish or bearish sentiment. By combining candlestick patterns with Elliott Wave analysis, traders can enhance their ability to forecast price movements and make more informed trading decisions.
A god candle trading refers to a powerful and significant candlestick pattern in technical analysis used by traders to identify potential reversals in the financial markets. It is characterized by a large, single candlestick with a long body, often showing significant price movement within a specific timeframe. The god candle can indicate a strong shift in market sentiment and can be used to predict potential trend changes. Traders often look for confirmation from other technical indicators or patterns before making trading decisions based on the god candle.
The bullish belt hold candlestick pattern can be identified by its distinct characteristics. It is a single candlestick pattern that appears during a downtrend. The pattern consists of a long green candlestick with no upper shadow and a small or no lower shadow. The opening price is usually near the low, and the closing price is near the high of the candle. This pattern signifies strong buying pressure, with the opening price signaling a potential trend reversal. Traders often look for confirmation from other technical indicators or patterns to validate the bullish belt hold pattern before making any trading decisions.
Yes, it is possible to trade without using candlestick patterns. Although candlestick charts are widely used in technical analysis to identify market trends and patterns, there are alternative methods available. Traders can rely on other chart types such as line charts or bar charts to analyze price movements. Additionally, various technical indicators and oscillators can be used to spot trading opportunities without explicitly relying on candlestick formations. Ultimately, the choice of trading tools and methods depends on individual preferences and strategies.
Conclusion
In conclusion, TRX Candlestick Patterns are a valuable tool for understanding market trends and making informed trading decisions. By analyzing these patterns, traders can identify potential reversals or continuations in price movements. It is important to learn different types of candlestick patterns and analyze TRX price charts to identify potential patterns. Confirmation signals such as trend lines and support/resistance levels should be considered, and technical analysis indicators can be used to validate the trade setup. Finally, traders should set appropriate entry and exit points and execute trades based on their analysis and risk management strategy. Candlestick patterns are essential in TRX options trading and can help improve trading strategies and success rates.

Successful traders rely on backtesting to be profitable.
Be like them with our
Free Backtesting Guide