






Quant Strategies & Backtesting results for SOL
Here are some SOL trading strategies along with their past performance. You can validate these strategies (and many more) for free on Vestinda across thousands of assets and many years of historical data.
Quant Trading Strategy: Lock and keep profits on SOL
The backtesting results for the trading strategy from February 26, 2021, to October 15, 2023, reveal encouraging statistics. The strategy's profit factor stands at 1.9, indicating a favorable risk-reward ratio. An impressive annualized ROI of 287.56% showcases the strategy's ability to generate substantial returns over the analyzed period. The average holding time for trades amounts to 6 weeks and 5 days, emphasizing a medium-term approach. With an average of only 0.05 trades per week, the strategy enforces selectivity. The number of closed trades achieved is 8. A noteworthy return on investment of 756.75% further highlights the strategy's success. Winning trades make up 50% of all trades, showcasing a balanced outcome. Remarkably, the strategy outperforms the buy-and-hold approach, generating excess returns of 415.37%.

 SOLUSDT

Choose another period and try again.
Quant Trading Strategy: Lock and keep profits on SOL
Based on the backtesting results statistics from February 26, 2021, to October 8, 2023, the trading strategy displayed promising performance. The profit factor was 1.89, indicating that for every dollar risked, the strategy yielded $1.89 in profit. The annualized ROI stood at an impressive 277.98%, indicating a substantial return on investment over the specified period. On average, trades were held for 6 weeks and 5 days, with an average of 0.05 trades per week. A total of 8 trades were closed, with a winning trades percentage of 50%. Additionally, the strategy outperformed the buy and hold approach, generating excess returns of 386.88%. These results highlight the potential profitability and superior performance of the trading strategy.
SOLUSDT
Choose another period and try again.
SOL (Solana) Golden Cross Trading: A Lucrative Strategy
Introduction
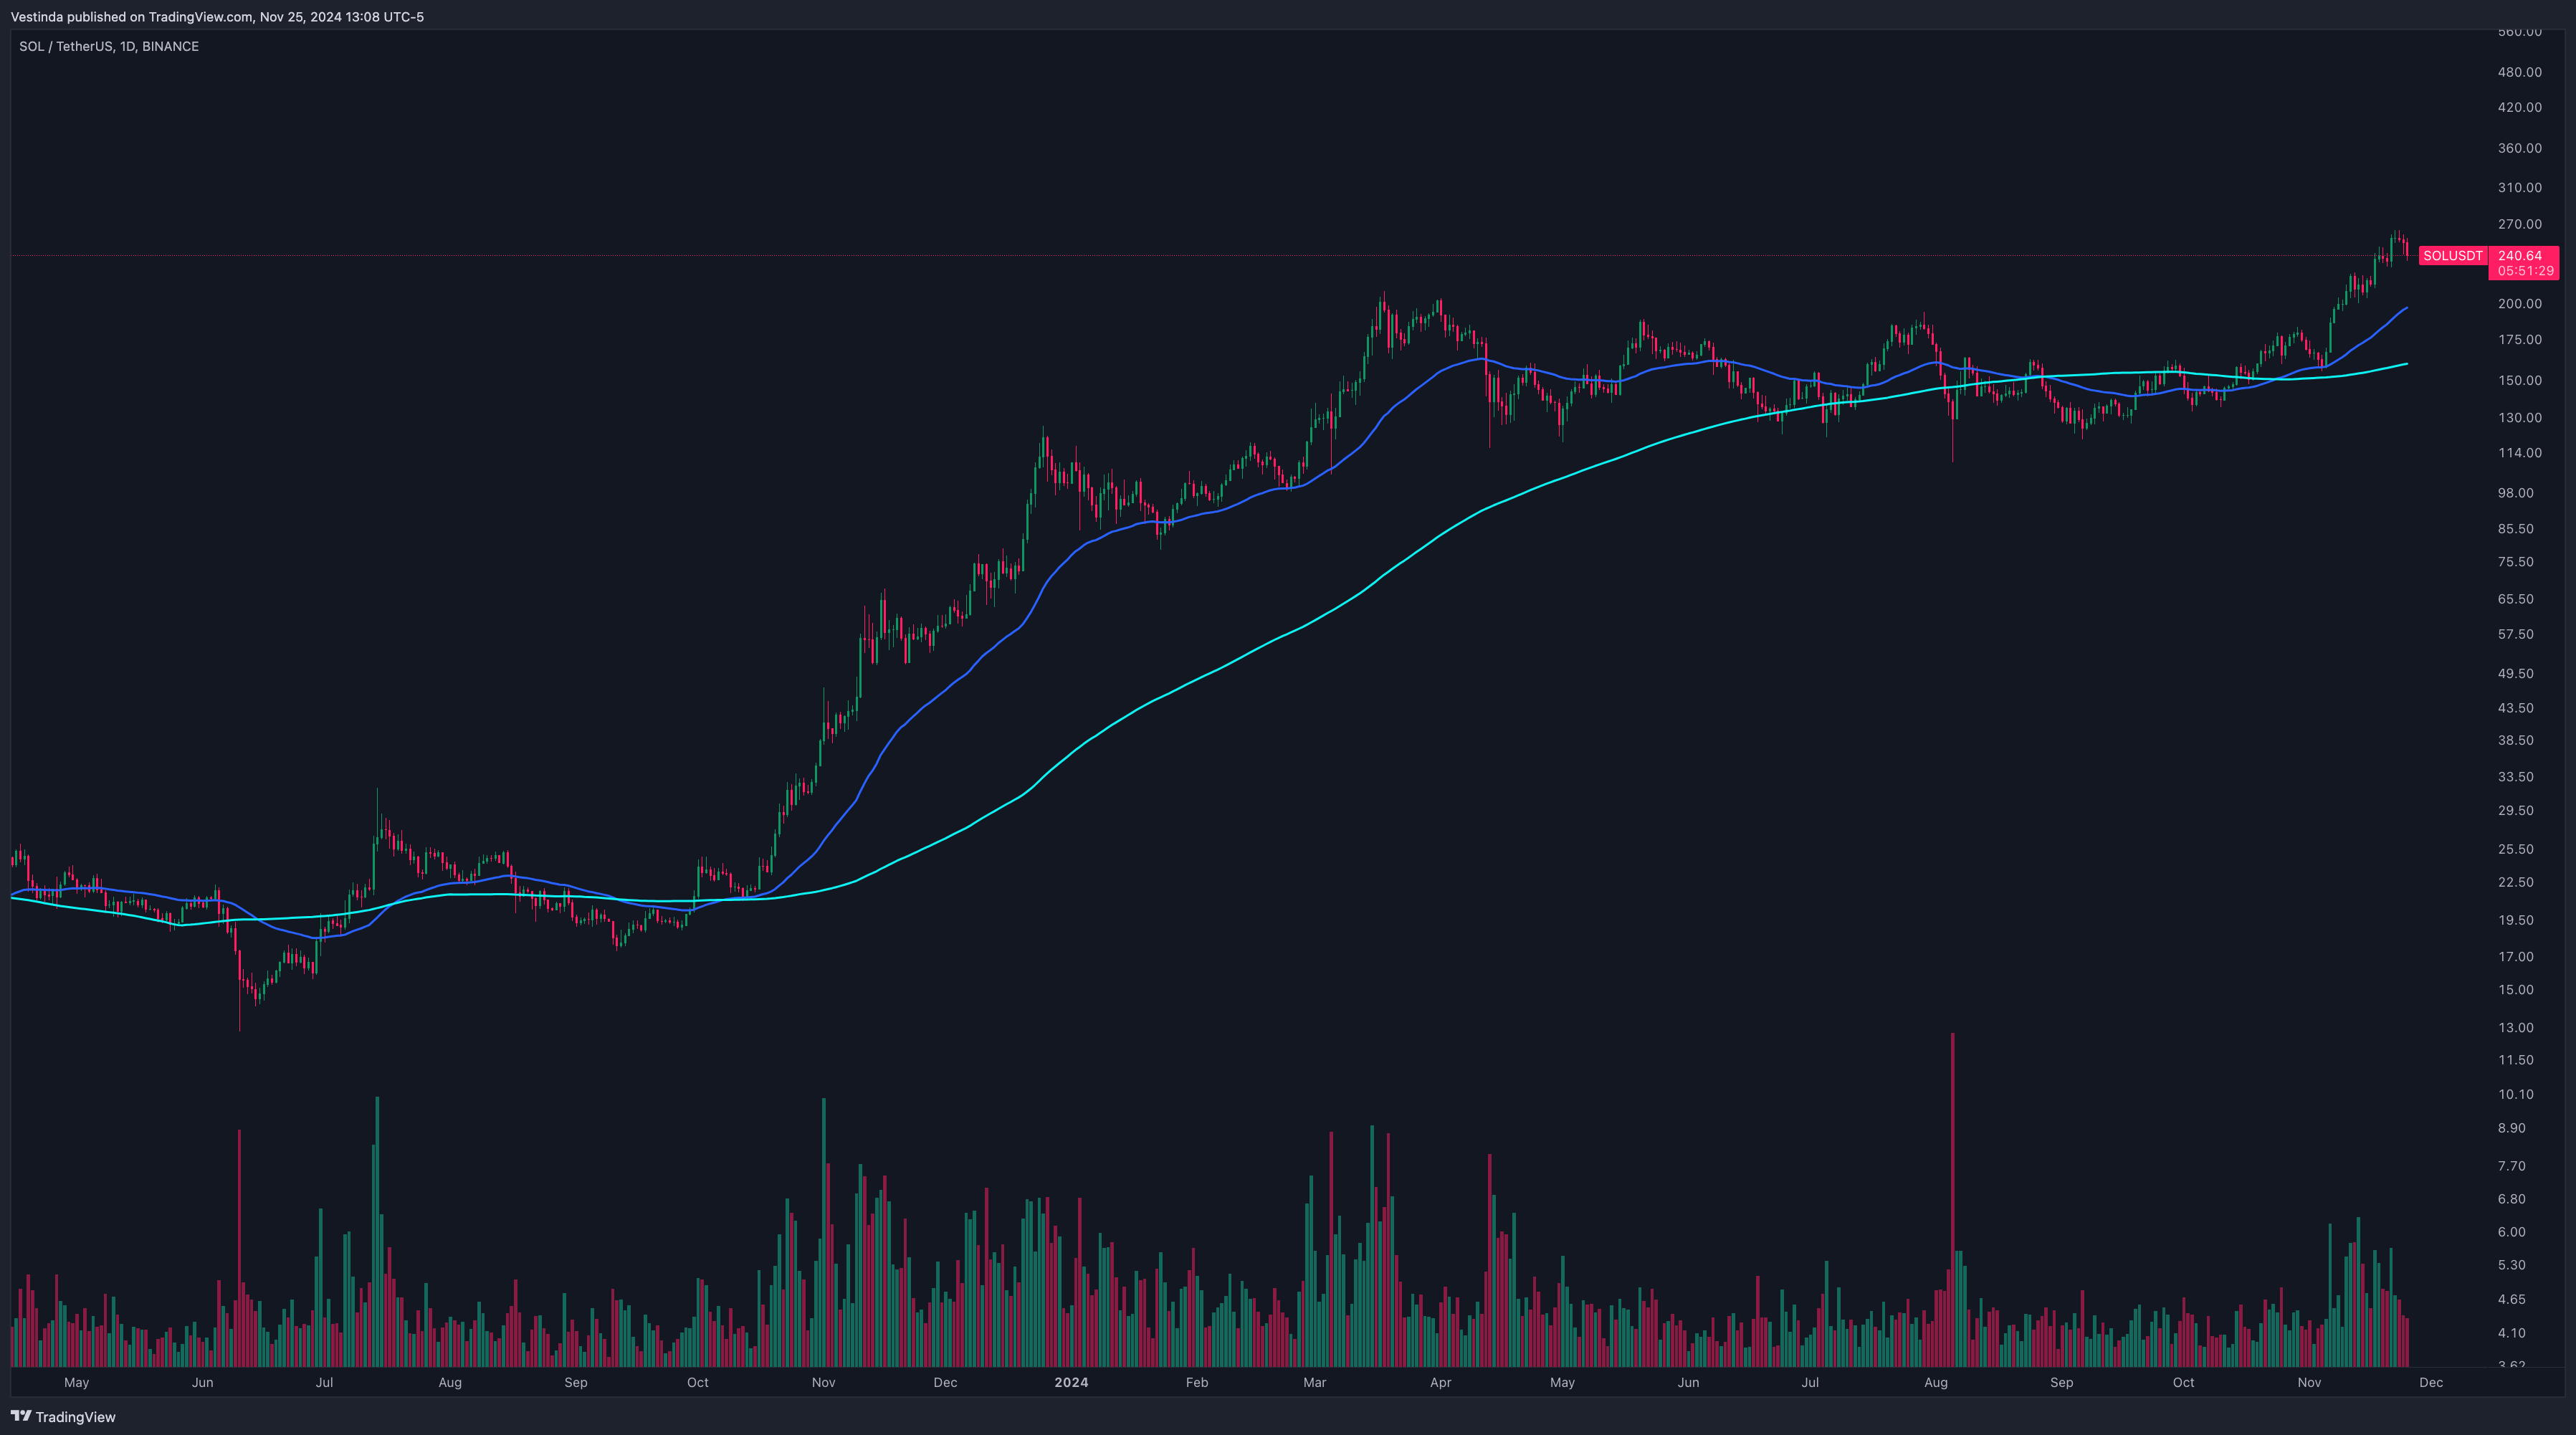
The Golden Cross is a renowned trading pattern in technical analysis, signaling a potential bullish market trend. For Solana (SOL), a cryptocurrency known for its high-speed blockchain and active market dynamics, the Golden Cross strategy provides traders with an effective method to identify long-term buying opportunities. This guide explores how to implement the Golden Cross strategy for SOL, complete with actionable tips and optimization techniques.
What is the Golden Cross?
- Definition: A Golden Cross occurs when a short-term moving average (e.g., 50-period EMA) crosses above a long-term moving average (e.g., 200-period EMA), indicating a potential upward trend.
- Key Components:
- Short-Term Moving Average: Reflects recent price momentum.
- Long-Term Moving Average: Represents broader market trends.
Why Use the Golden Cross for SOL?
- Strong Bullish Signal: Identifies the beginning of sustained upward trends.
- High Reliability: Commonly used by traders across markets, including crypto.
- Adaptable Across Timeframes: Effective for swing trading, day trading, and long-term investing.
How to Implement the Golden Cross Strategy for SOL
1. Set Up Moving Averages
Apply a 50-period EMA (short-term) and a 200-period EMA (long-term) on your SOL chart.
Use a 4-hour or daily timeframe for better trend clarity.

2. Entry Signal
Enter a long position when the 50 EMA crosses above the 200 EMA, confirming a bullish trend.
3. Exit Signal
Close the position if the 50 EMA crosses back below the 200 EMA, signaling a potential reversal.
4. Optimize with Volume Analysis
Confirm the Golden Cross with increased trading volume, indicating strong market participation.
Enhancing the Golden Cross with Additional Indicators
1. RSI (Relative Strength Index)
Use RSI to confirm overbought or oversold conditions before entering trades.
Example: Enter long when RSI is between 30 and 70, avoiding overbought levels.
2. MACD for Momentum Confirmation
Combine the Golden Cross with MACD crossovers for stronger trend validation.
Example: Look for bullish MACD crossovers aligning with the Golden Cross.
3. Bollinger Bands for Volatility Analysis
Monitor Bollinger Bands to gauge price volatility and potential breakout opportunities.
Practical Tips for Golden Cross Trading
- Patience is Key: Wait for the moving averages to fully cross to avoid false signals.
- Use Stop-Loss Orders: Place stop-losses below recent support levels to protect capital.
- Combine with Fundamental Analysis: Monitor Solana’s ecosystem developments, partnerships, or major announcements that may influence price trends.
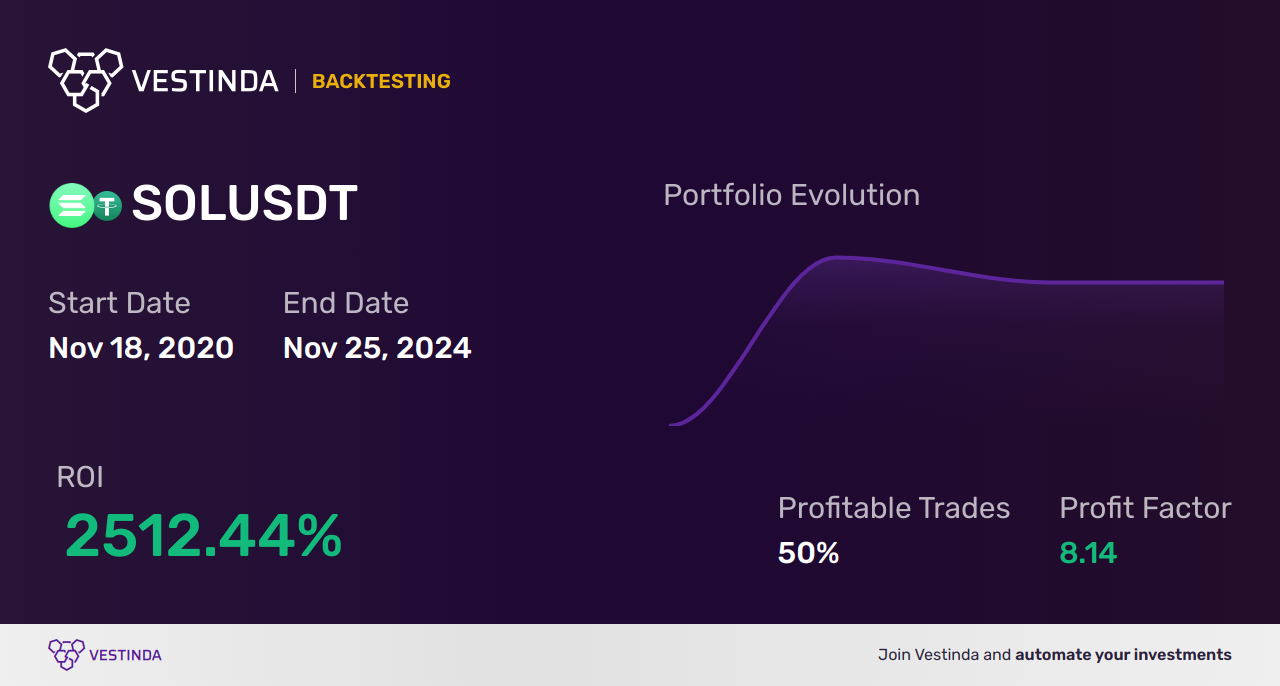
Backtesting the Golden Cross for SOL
- Purpose: Evaluate the strategy’s effectiveness using historical price data.
- Metrics to Track:
- Win rate
- Maximum drawdown
- Average return per trade
Tools:
- Use tools like Vestinda or TradingView with backtesting capabilities.
Conclusion
The Golden Cross strategy offers a reliable method to identify bullish trends in SOL’s price action, providing traders with clear entry and exit signals. By combining it with additional indicators like RSI and MACD, and employing robust risk management practices, traders can maximize their profit potential while navigating Solana’s dynamic market.
SOL's Golden Cross: An Easy How-To Guide
- Identify the 50-day moving average (SMA 50) and the 200-day moving average (SMA 200).
- Check if the SMA 50 crosses above the SMA 200.
- If the crossover occurs, it could indicate a bullish signal.
- Confirm the signal with additional technical analysis indicators or price patterns.
- Consider entering a long position when the Golden Cross occurs.
- Set a stop-loss order to manage your risk in case the trade goes against you.
- Monitor the SOL price action and be prepared to adjust your strategy if necessary.
Golden Cross Analysis Timeframes for SOL
Timeframes for analysis of the Golden Cross vary depending on the trading strategy. Short-term traders may focus on the 50-day and 200-day moving averages for faster signals. SOL's recent Golden Cross on the daily chart suggests bullish sentiment. Medium-term traders may look at the 100-day and 200-day moving averages for a broader perspective. SOL's Golden Cross on the weekly chart confirms a longer-term uptrend. Long-term investors may consider the 200-day and 400-day moving averages for more significant trends. SOL's Golden Cross on the monthly chart indicates a potential long-term investment opportunity. Regardless of the timeframe, the Golden Cross tends to attract attention from traders and investors alike due to its reputation as a highly reliable bullish signal.
Investor Perception: SOL's Market Sentiment
Market sentiment refers to the overall attitude and perception of investors towards a particular asset or market. In the case of SOL, the sentiment has been overwhelmingly positive. The cryptocurrency has gained significant attention and popularity due to its impressive performance and technological advancements. With its high speed and low transaction fees, Solana has attracted many investors looking for an alternative to Ethereum. This has resulted in a surge in demand for SOL tokens and a substantial increase in its value. The positive market sentiment surrounding SOL has also been fueled by the growing interest from institutional investors, who recognize its potential as a scalable blockchain platform. As more investors and institutions continue to embrace Solana, it is expected that the market sentiment will remain bullish in the near term.
Unforeseen SOL Hurdles
Potential Challenges and Risks:
1. Network Scalability: SOL aims to support thousands of transactions per second, but as user adoption increases, it may face scalability challenges in processing this volume efficiently.
2. Centralization Concerns: With the vast majority of SOL tokens held by a few parties, there is a risk of centralization, potentially compromising the distributed nature of the network.
3. Security Vulnerabilities: Despite its strong security features, SOL is not immune to potential attacks, including smart contract bugs or hacking incidents, which could lead to financial losses for users.
4. Regulatory Uncertainty: The evolving regulatory landscape surrounding cryptocurrencies could pose risks for SOL, including potential restrictions or legal challenges in certain jurisdictions.
5. Interoperability Challenges: As blockchain ecosystems expand, the challenge of interoperability between different networks may arise, potentially limiting SOL's ability to collaborate with other platforms.
6. Market Volatility: Like any other cryptocurrency, SOL's value is subject to market fluctuations, posing risks for investors and users relying on its stability.
Navigating these challenges will be crucial for SOL to maintain its growth trajectory and establish itself as a robust blockchain platform in the long term.
-
 Create
account -
 Discover profitable
strategies -
 Connect exchange
& start earning
Frequently Asked Questions
Yes, the Golden Cross can be used for SOL swing trading. The Golden Cross is a bullish technical analysis pattern that occurs when a short-term moving average crosses above a long-term moving average. This crossover indicates a potential upward trend. Swing traders can utilize this signal to enter long positions and capture short-term price movements. However, it is crucial to combine the Golden Cross with other indicators and confirmatory analysis to increase the probability of successful swing trading decisions.
The Golden Cross, typically referring to the 50-day moving average crossing above the 200-day moving average, is a commonly used technical indicator to identify bullish trends. While it can provide a decent entry or exit signal for trading, it should not be solely relied upon for making trading decisions. Other factors such as market conditions, volume, and fundamental analysis should also be taken into account. Therefore, while the Golden Cross can be a helpful tool, it is essential to consider it in conjunction with other indicators and analysis to ensure reliable trading decisions for SOL.
The Golden Cross, a bullish signal occurring when a short-term moving average crosses above a long-term moving average, can provide insights for position sizing in SOL trading. When the Golden Cross confirms a potential upward trend, traders may consider increasing their position size. However, it should not be the sole factor for position sizing. Combining the Golden Cross with other indicators or risk management strategies is advisable to make informed decisions. Ultimately, a comprehensive approach that considers multiple factors would be more prudent when determining position sizes in SOL trading.
There are no specific Golden Cross signals observed in the context of SOL indicating potential trend exhaustion. The Golden Cross typically occurs when a short-term moving average crosses above a long-term moving average, indicating a bullish trend. However, trend exhaustion is subjective and can be influenced by various factors. To analyze SOL's potential trend exhaustion, one should consider additional technical indicators, fundamental analysis, and market conditions to assess whether a trend reversal or exhaustion is probable.
Yes, there are Golden Cross trading bots available for SOL. These bots are designed to automatically execute trades based on the Golden Cross technical indicator, which occurs when a short-term moving average crosses above a long-term moving average. Golden Cross bots can help traders identify potential buying opportunities and capture bullish market trends. They offer convenience and efficiency by automating the trading process, allowing traders to make the most of favorable market conditions.
To adjust the parameters of the Golden Cross indicator for improved performance in SOL trading, it is essential to consider the historical data and market conditions. Start by experimenting with different time periods for the moving averages used in the Golden Cross, such as adjusting the short and long-term averages. Evaluating the indicator's accuracy over various historical periods can help optimize the parameters. Additionally, incorporating other technical indicators or oscillators can further refine the Golden Cross. Remember to monitor the indicator's performance regularly and make necessary adjustments to enhance its effectiveness in SOL trading.
Conclusion
In conclusion, SOL (Solana) Golden Cross Trading offers a valuable strategy for traders and investors looking for profitable opportunities in the cryptocurrency market. By analyzing SOL Golden Cross Trading charts and identifying bullish signals through the EMA golden cross, traders can make informed buy decisions. SOL's recent Golden Cross on multiple timeframes suggests a positive market sentiment, fueled by its high-performance blockchain and growing interest from institutional investors. However, potential challenges and risks, such as network scalability and regulatory uncertainty, should be carefully navigated to ensure SOL's long-term success. Nevertheless, the Golden Cross remains a highly reliable bullish signal, attracting attention from traders and investors.

Successful traders rely on backtesting to be profitable.
Be like them with our
Free Backtesting Guide