-
 Create
account -
 Discover profitable
strategies -
 Connect exchange
& start earning
Automated Strategies & Backtesting results for LSK
Here are some LSK trading strategies along with their past performance. You can validate these strategies (and many more) for free on Vestinda across thousands of assets and many years of historical data.
Automated Trading Strategy: The breakout strategy on LSK
During the backtesting period from October 19, 2022, to October 19, 2023, the trading strategy achieved promising results. The annualized return on investment (ROI) stood at an impressive 13.4%, indicating a considerable growth in the portfolio value. The average holding time for each trade was approximately 4 weeks and 6 days, suggesting a calculated approach to position management. With an average of 0.01 trades per week, the strategy displayed a patient and selective trading style. The number of closed trades amounted to 1, indicating a focused trading approach. Notably, all trades executed by the strategy were winners, resulting in a winning trades percentage of 100%. Furthermore, the strategy outperformed the buy-and-hold strategy, generating excess returns of 34.76%, thereby highlighting its potential for superior performance.

 LSKUSDT

Choose another period and try again.
Automated Trading Strategy: MACD Trend-Following with ZLEMA and Dojis on LSK
Based on the backtesting results statistics for the trading strategy implemented from October 19, 2022, to October 19, 2023, several key observations can be made. The profit factor of 0.74 indicates that for every unit of risk, the strategy generated 0.74 units of profit. However, the annualized ROI was significantly negative at -37.45%, suggesting a substantial loss over the specified period. On average, trades were held for approximately 1 day and 5 hours, and the strategy generated an average of 2.49 trades per week. Out of 130 closed trades, only 26.15% were profitable, reinforcing the challenges faced by this strategy. Overall, improvements may be necessary to enhance the profitability and success rate of this trading approach.
LSKUSDT
Choose another period and try again.
LSK (Lisk) Technical Analysis: Boost Your Trading Strategy
Introduction
Technical analysis is a vital tool for traders looking to understand market trends and make informed decisions. For LSK (Lisk), employing technical analysis can help traders optimize their strategies and achieve better outcomes. This guide explores key indicators and actionable techniques to enhance your Lisk trading strategy.
Why Use Technical Analysis for Lisk Trading?
- Trend Identification: Helps spot upward, downward, or sideways trends.
- Entry and Exit Timing: Provides precise points for entering and exiting trades.
- Risk Management: Identifies potential reversal zones to mitigate losses.
Core Components of Lisk Technical Analysis
1. Price Action
Analyzing price movement provides insights into market sentiment.
- Support and Resistance Levels: Identify price zones where Lisk has previously reversed or consolidated.
- Candlestick Patterns: Look for bullish and bearish engulfing patterns to predict reversals.
2. Indicators
Indicators are mathematical calculations based on price and volume, helping traders predict future price movements. For LSK, consider:
- Moving Averages (MA): Identifies trend direction over specific periods.
- Relative Strength Index (RSI): Measures momentum and potential overbought/oversold conditions.
- MACD (Moving Average Convergence Divergence): Tracks momentum and trend strength.
3. Volume Analysis
Tracks trading activity to confirm price movements.
- Key Indicator: Volume Weighted Average Price (VWAP) identifies fair value based on price and volume.
Top Strategies for Lisk Technical Analysis
1. Trend-Following with Moving Averages
Concept:
Align trades with the prevailing trend to maximize profitability.
Setup:
- Use a 20-period EMA (short-term) and a 50-period EMA (medium-term).

Execution Rules:
- Buy Signal: Enter long when the 20 EMA crosses above the 50 EMA.
- Sell Signal: Exit when the 20 EMA crosses below the 50 EMA.
2. Momentum Trading with RSI and MACD
Concept:
Capture momentum shifts to time entries and exits.
Setup:
- RSI (14) to identify overbought/oversold conditions.
- MACD (12, 26, 9) for momentum confirmation.
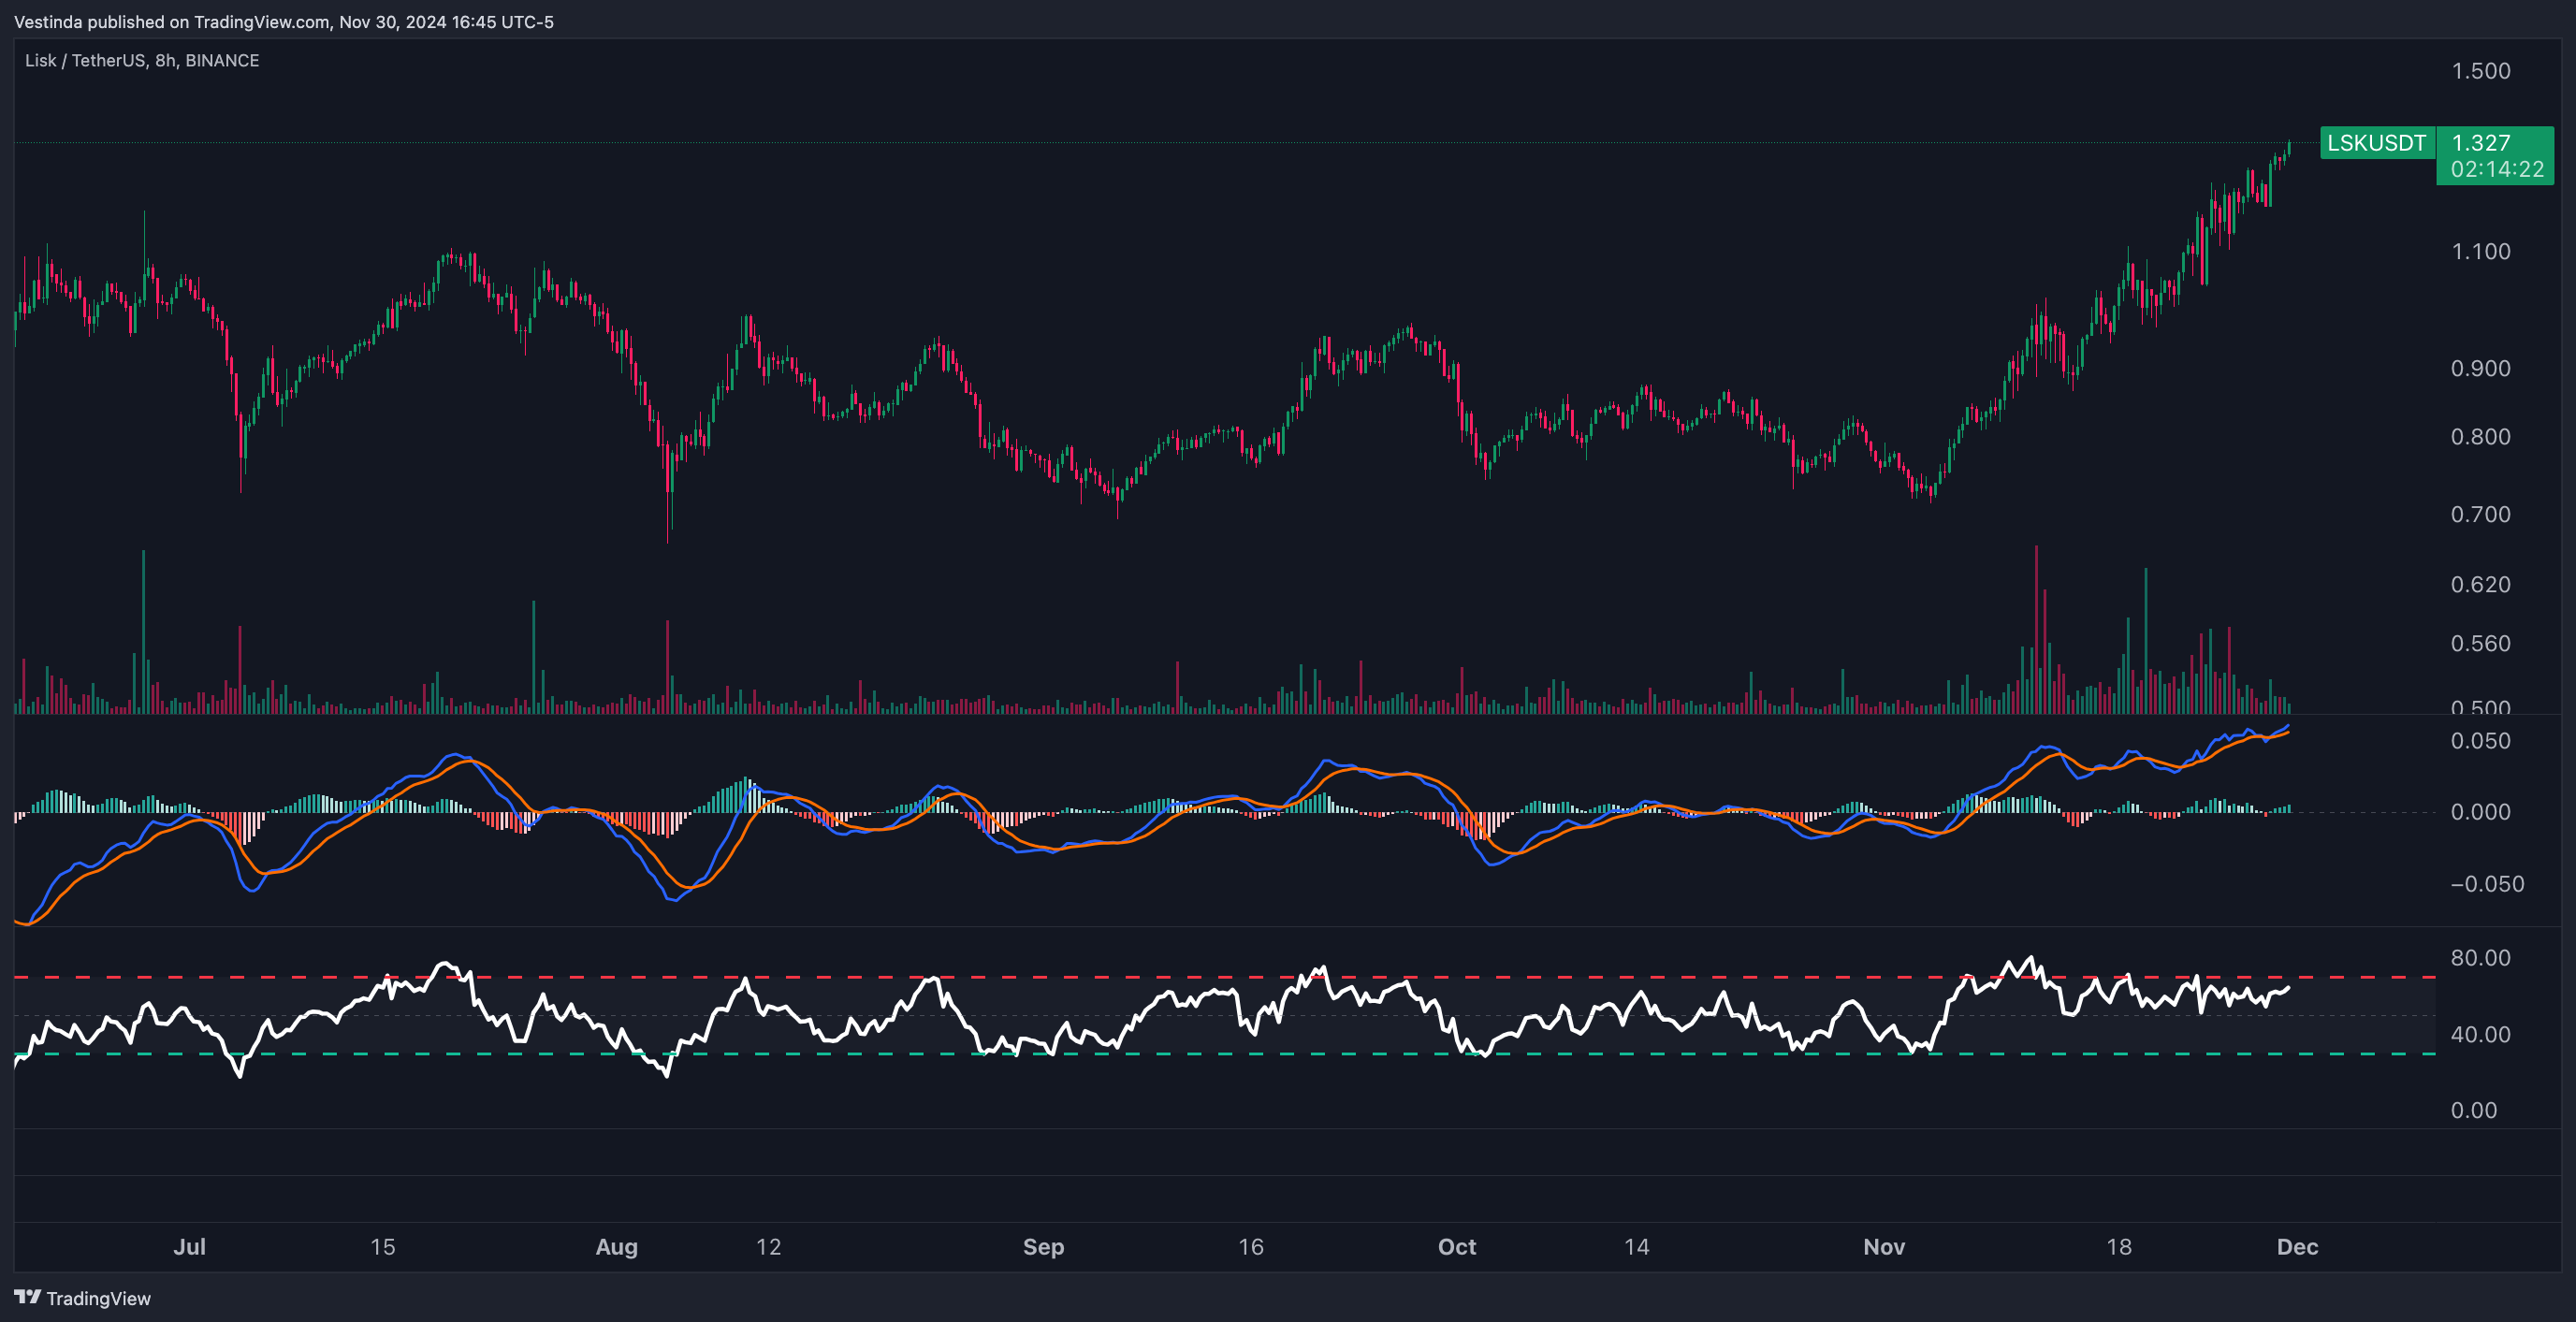
Execution Rules:
- Buy Signal: Enter long when RSI exits oversold (<30) and MACD crosses bullish.
- Sell Signal: Exit when RSI enters overbought (>70) or MACD turns bearish.
3. Breakout Strategy with VWAP
Concept:
Leverage volume-based analysis to identify breakouts.
Setup:
- Use VWAP to find key breakout levels.
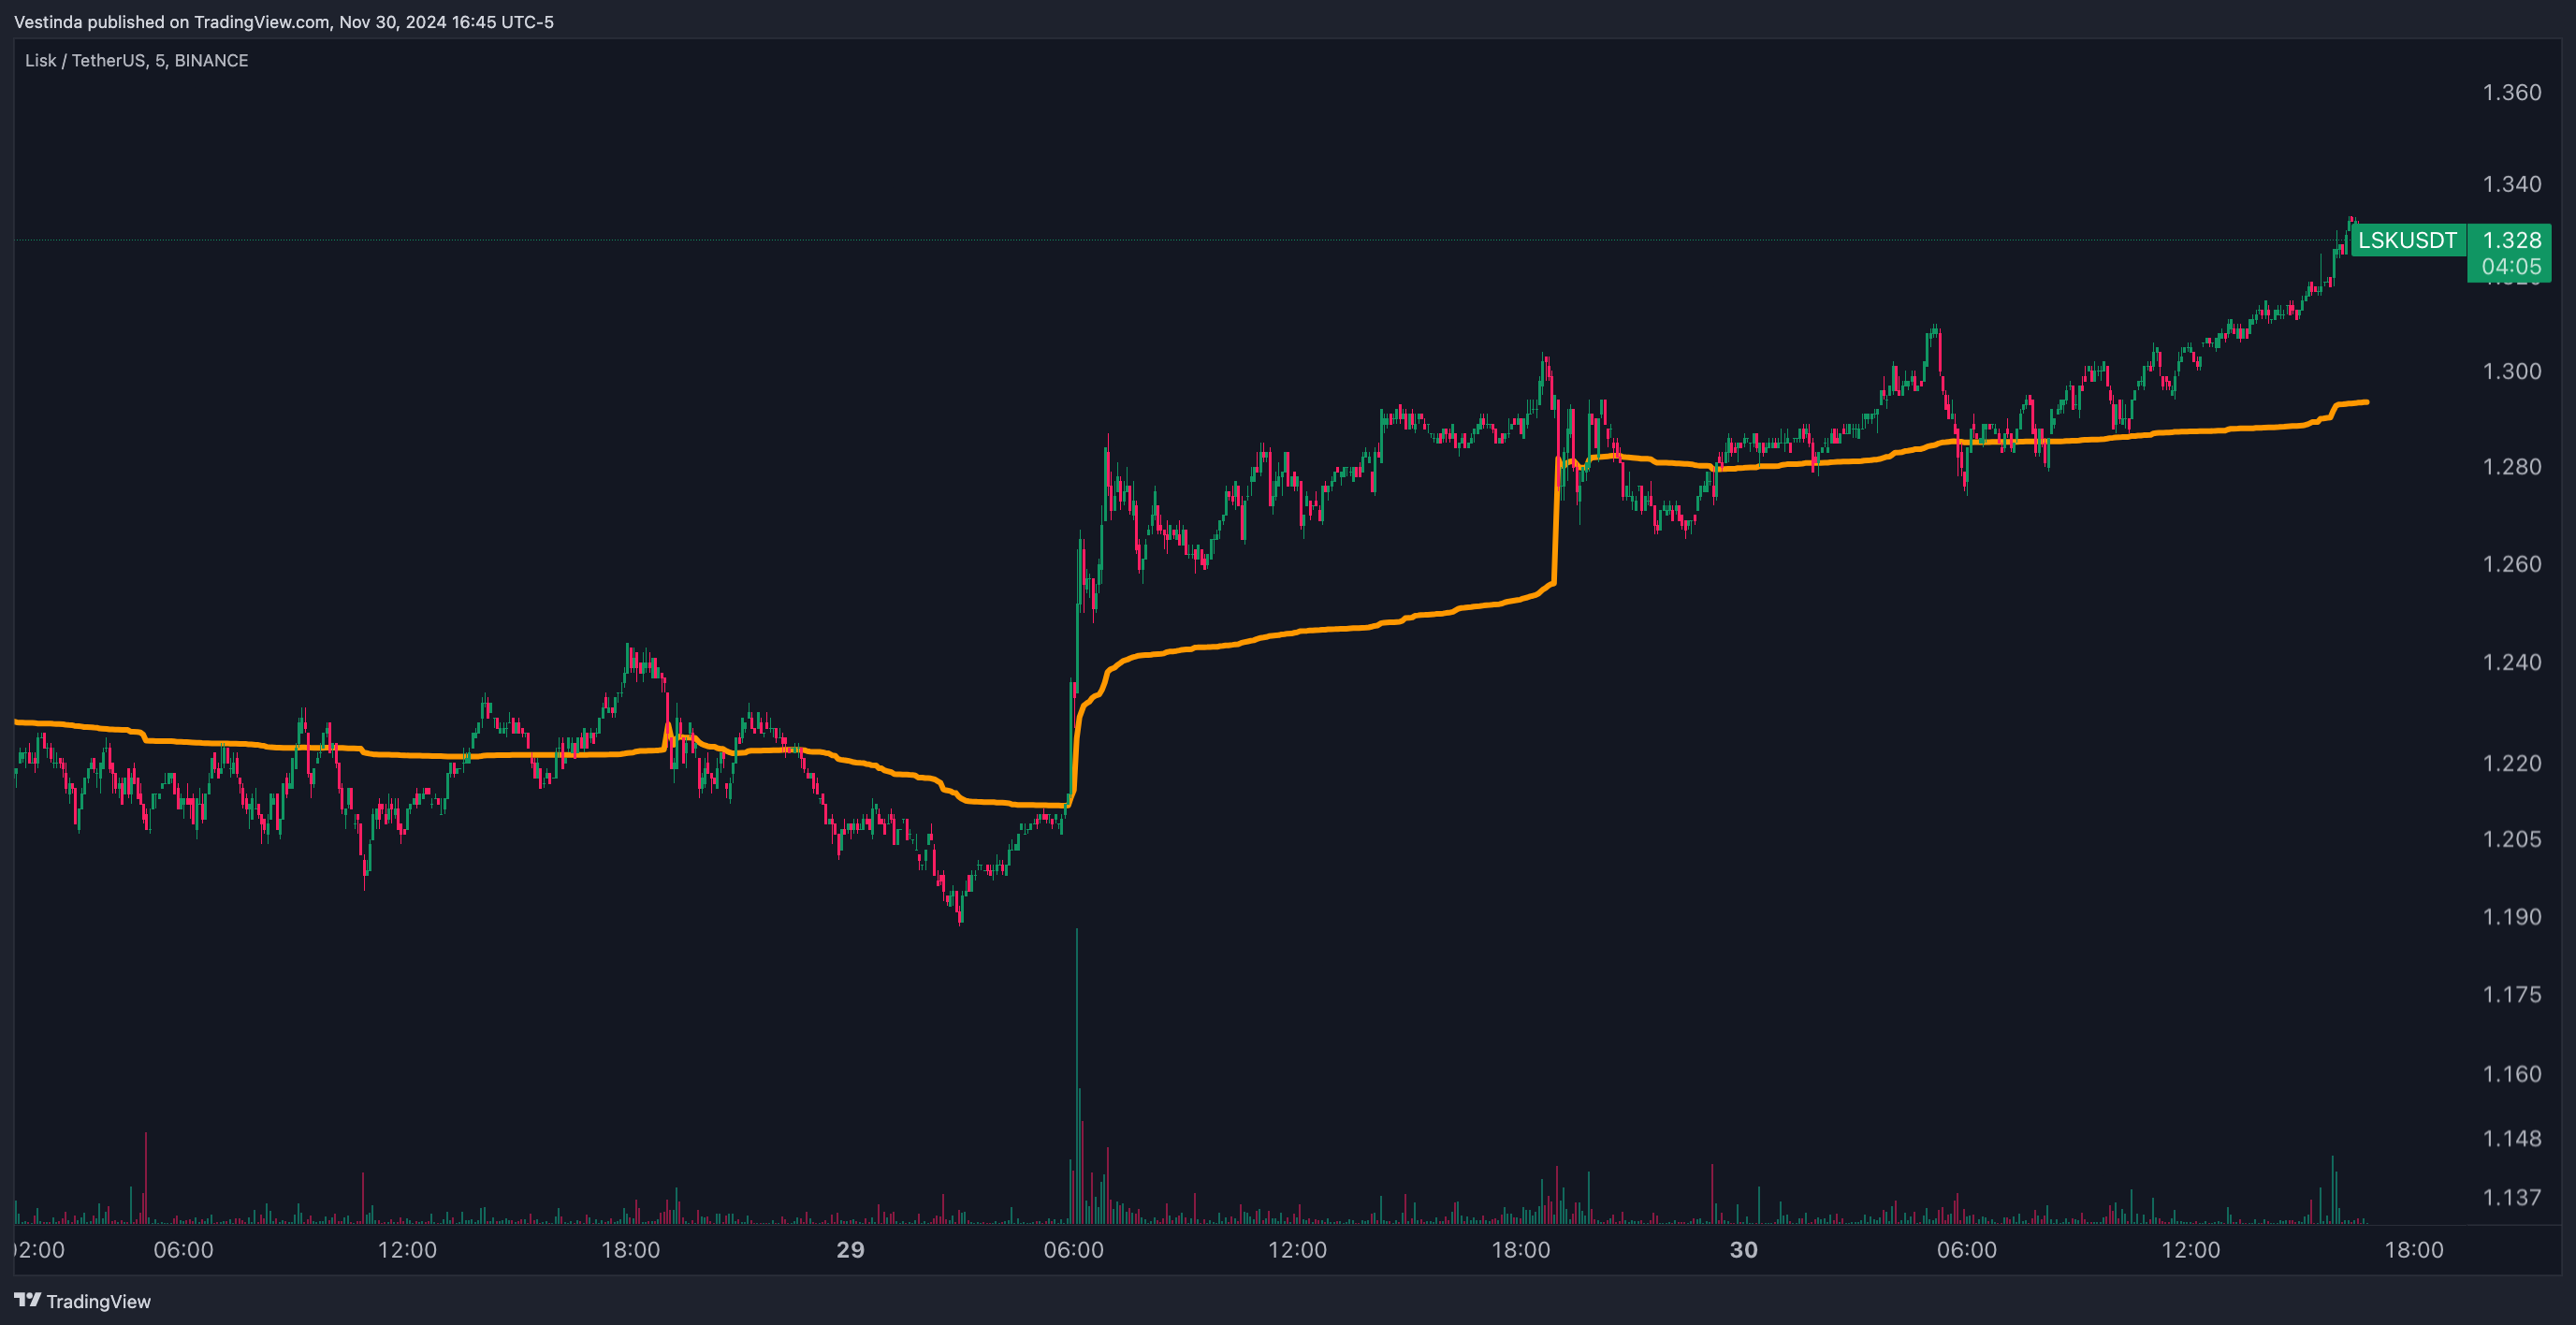
Execution Rules:
- Buy Signal: Enter long when price breaks above VWAP with increasing volume.
- Sell Signal: Exit when price falls below VWAP or volume declines.
Risk Management for Lisk Trading
- Dynamic Stop-Losses: Use ATR-based stops to adjust for volatility.
- Position Sizing: Limit risk to 1-2% of your portfolio per trade.
- Diversify Strategies: Combine trend-following, breakout, and momentum strategies to reduce risk.
Advantages of Technical Analysis for Lisk
- Enhanced Precision: Provides clear entry and exit signals.
- Adaptability: Works across multiple timeframes, from intraday to swing trading.
- Data-Driven Insights: Reduces emotional decision-making by focusing on market data.
Common Mistakes to Avoid
- Over-Reliance on Indicators: Combine technical indicators with price action for a balanced approach.
- Ignoring Volume: Validate price movements with volume analysis to confirm trends.
- Neglecting Market Context: Consider broader market trends and news that may affect Lisk.
Conclusion
Technical analysis is a powerful tool for optimizing your Lisk trading strategy. By incorporating moving averages, RSI, MACD, and VWAP, traders can better navigate market trends and identify profitable opportunities. Combine these tools with disciplined risk management to maximize your success in the dynamic cryptocurrency market.
Building a Robust LSK Technical Analysis Strategy
- Gather historical price data for LSK and identify relevant time frames for analysis.
- Use technical analysis tools like moving averages and trend lines to identify price trends and support/resistance levels.
- Apply indicators like RSI or MACD to gauge momentum and potential price reversals.
- Analyze volume patterns to assess market participation and confirm price trends.
- Consider market news or events that could impact Lisk and adjust analysis accordingly.
- Generate buy/sell signals based on the analysis and set appropriate stop-loss levels to manage risk.
- Regularly monitor and update the analysis as market conditions change or new information emerges.
Calculating Lisk's Volatility: ATR Indicator in Focus
Average True Range (ATR) is a popular technical indicator used to quantify volatility in the cryptocurrency market. For Lisk (LSK), ATR helps traders and analysts determine the level of price fluctuations over a given period. This measure assists in identifying periods of high volatility, which can present both opportunities and risks for investors. By calculating the ATR, traders can better gauge market conditions and make informed decisions regarding entry and exit points. A higher ATR suggests greater volatility, indicating the potential for larger price swings and potential profit opportunities. Conversely, a lower ATR implies lower volatility and may indicate a stagnant or range-bound market. In summary, using Average True Range (ATR) can provide valuable insights into the volatility of Lisk (LSK) and aid traders in navigating the market effectively.
Mastering LSK: Navigating Economic Indicators
LSK's technical response to economic indicators is crucial for informed decision-making. By analyzing data such as inflation rates, GDP growth, and unemployment rates, LSK can better understand the macroeconomic landscape. Short-term trends are essential to identify potential market fluctuations. In response to positive economic indicators, LSK may experience an increase in demand, leading to higher prices. Conversely, negative economic indicators may result in decreased demand and lower prices for LSK. These fluctuations can be observed through various technical analysis tools, including moving averages, trend lines, and volume analysis. Traders can use this information to develop trading strategies and predict possible price movements in the Lisk market. Ultimately, LSK's technical response to economic indicators plays a pivotal role in shaping investment decisions and market behavior.
Lisk's Market Performance: Price Insights and Trends
Price Charts and Trends for LSK
The price chart of LSK shows a fluctuating trend over the past few months. In January, LSK experienced a significant surge, reaching its all-time high of $21.76. However, the cryptocurrency market as a whole experienced a downturn, causing LSK to retrace its gains. Currently, LSK's price has stabilized around $8, indicating a potential consolidation phase. Moving averages suggest a bearish outlook, with the 50-day moving average crossing below the 200-day moving average. Additionally, the RSI indicates that LSK is in oversold territory. However, it is essential to consider external factors, such as market sentiment and news developments, which can influence price movements. Traders and investors should closely monitor these indicators to make informed decisions about the future movement of LSK.
Sophisticated backtesting is not only possession of high-esteemed hedge funds anymore.
Impressive Team and support, Backtesting engine with detailed reports, The Strategy builder.

Great purchase!
I have always manually invested in stocks and cryptocurrencies, but after studying Vestinda, I must say it has enormous potential.

Mature platform for trading
Pro: Easy to use, Nice UX, A lot of customization for strategies, Back testing is an awesome tool, can check any strategy in history.

Frequently Asked Questions
Yes, technical analysis can be used for day trading. Day traders analyze historical prices, charts, and patterns to predict future market movements and make short-term trading decisions. By using indicators such as moving averages, oscillators, and trendlines, day traders can identify entry and exit points, manage risk, and improve their chances of making profitable trades. However, it is important to note that technical analysis alone is not foolproof, as it does not consider fundamental factors and can be influenced by market sentiment and news events. Successful day trading requires a combination of technical analysis skills, risk management, and market awareness.
In LSK technical analysis, some key chart patterns to watch for are the ascending triangle, bull flag, and double bottom patterns. The ascending triangle indicates a potential bullish continuation, with a flat resistance line and rising support line. A bull flag suggests a brief pause in an uptrend before a potential continuation, characterized by a small consolidation in a shape resembling a flag. Lastly, the double bottom pattern indicates a potential trend reversal, with two distinct lows followed by a breakout above the pattern's neckline. These patterns can provide valuable insights into the stock's future price movements and help traders make more informed decisions.
Traders use trend channels in LSK's technical analysis to identify potential price movements and make informed trading decisions. By drawing trendlines connecting the series of higher highs and higher lows or lower highs and lower lows, traders can establish the upper and lower boundaries of the channel. This allows them to determine the trend's strength and anticipate potential price reversals or breakouts. Traders can then use this information to enter or exit positions, set stop-loss orders, or identify potential price targets within the trend channel. Overall, trend channels serve as valuable tools for traders to analyze and interpret LSK's price action.
Moving averages are a key tool in identifying trend direction. They smooth out price data by calculating the average of a specified number of periods and plot it as a line on a chart. By analyzing the direction and slope of the moving average line, traders can identify if the trend is bullish, bearish, or ranging. The general rule is that when the price is above the moving average, it indicates an uptrend, and when it's below, a downtrend. Moreover, crossovers between different moving averages can signal trend reversals. In summary, moving averages act as trend indicators, offering valuable insights into the overall market direction.
Major product announcements can have a significant impact on LSK's technicals. Positive announcements, like partnerships or new features, can drive up demand, resulting in increased buying pressure and potential upward price movements. On the other hand, negative announcements, such as security breaches or regulatory issues, may lead to selling pressure and price declines. Additionally, major product announcements can also affect trading volumes, volatility, and market sentiment towards LSK, influencing technical patterns like moving averages, support, and resistance levels. Hence, it is crucial for traders and investors to monitor these announcements to gauge their potential impact on LSK's technical indicators.
Conclusion
In conclusion, LSK (Lisk) technical analysis is a vital tool for investors in understanding market trends and making informed decisions. By utilizing chart patterns, technical indicators, and analyzing price charts, traders can gain valuable insights into the movement of LSK and the broader cryptocurrency market. It is crucial to gather historical price data, use technical analysis tools, and consider market news or events when conducting analysis. Average True Range (ATR) is a popular indicator that helps quantify volatility in the cryptocurrency market, while LSK's response to economic indicators plays a significant role in shaping investment decisions. Stay vigilant and monitor these indicators to stay ahead in the ever-changing crypto market.

Successful traders rely on backtesting to be profitable.
Be like them with our
Free Backtesting Guide