
-
 Create
account -
 Discover profitable
strategies -
 Connect exchange
& start earning
Quantitative Strategies & Backtesting results for BNB
Here are some BNB trading strategies along with their past performance. You can validate these strategies (and many more) for free on Vestinda across thousands of assets and many years of historical data.
Quantitative Trading Strategy: Keltner Breakout Strategy on BNB
Based on the backtesting results for the trading strategy from December 30, 2020, to November 13, 2023, the overall performance appears positive. The profit factor stands at 1.21, indicating a favorable ratio between gross profits and gross losses. The annualized return on investment (ROI) reaches an impressive 87.17%, suggesting a potentially lucrative strategy over the analyzed period. The average holding time for trades amounts to 5 days and 19 hours, indicating a medium-term trading approach. The average number of trades per week is 0.46, implying a relatively conservative trading frequency. With 70 closed trades, the strategy demonstrates an active engagement in the market. The return on investment achieved during this period is impressive at 249.06%. However, it is worth noting that the winning trades percentage is relatively low, standing at 32.86%, suggesting room for improvement in terms of trade accuracy and profitability.

 BNBUSDT

Choose another period and try again.
Quantitative Trading Strategy: The breakout strategy on BNB
Based on the backtesting results from February 28, 2021, to November 12, 2023, the trading strategy has shown promising performance. With a profit factor of 2.51 and an annualized return on investment (ROI) of 33.97%, the strategy has demonstrated the potential for significant profitability. On average, each trade had a holding period of 3 weeks and 4 days, with an average of only 0.07 trades per week. Despite a relatively low number of closed trades (10), the strategy managed to generate a solid return on investment of 91.82%. Additionally, the winning trades percentage stands at 50%, indicating a balanced portfolio performance. Comparatively, the strategy outperforms the buy and hold approach, generating excess returns of 74.16%. These statistics highlight the strategy's robustness and potential for profitable trading.
BNBUSDT
Choose another period and try again.
BNB (Binance Coin) Chart Patterns: A Comprehensive Analysis
Introduction
Chart patterns are a cornerstone of technical analysis, providing visual cues about potential price movements. For Binance Coin (BNB), understanding and utilizing these patterns can significantly enhance trading precision. This guide explores key chart patterns that traders can use to identify opportunities in the BNB market, offering actionable insights and strategies.
Why Focus on Chart Patterns?
- Predict Price Movements: Chart patterns reveal trends, reversals, and continuations, offering predictive value for price direction.
- Universal Application: These patterns are effective across multiple timeframes, making them versatile tools for all traders.
- Complement Other Strategies: When combined with indicators like RSI, MACD, or VWAP, chart patterns provide stronger signals.
Top Chart Patterns for BNB Trading
1. Bullish Engulfing Pattern
What It Is: A two-candle reversal pattern where a green candle fully engulfs the previous red candle, signaling potential bullish momentum.
When It Forms: Typically at the end of a downtrend, indicating a potential reversal to the upside.

How to Trade:
- Buy Signal: Enter long when the next candle closes above the high of the bullish engulfing pattern.
- Stop-Loss: Place below the low of the engulfing candle.
- Confirmation Tip: Pair with RSI; ensure it exits oversold territory to confirm the bullish reversal.
2. Bearish Engulfing Pattern
What It Is: A two-candle reversal pattern where a red candle fully engulfs the previous green candle, signaling potential bearish momentum.
When It Forms: Commonly appears at the top of an uptrend, indicating a potential reversal downward.

How to Trade:
- Sell Signal: Enter short when the next candle closes below the low of the bearish engulfing pattern.
- Stop-Loss: Place above the high of the engulfing candle.
- Confirmation Tip: Use MACD to confirm weakening bullish momentum before entering.
3. Ascending Triangle
What It Is: A continuation pattern characterized by a horizontal resistance line and rising support levels, signaling a potential bullish breakout.
When It Forms: During an uptrend or consolidation phase, often preceding a strong move upward.
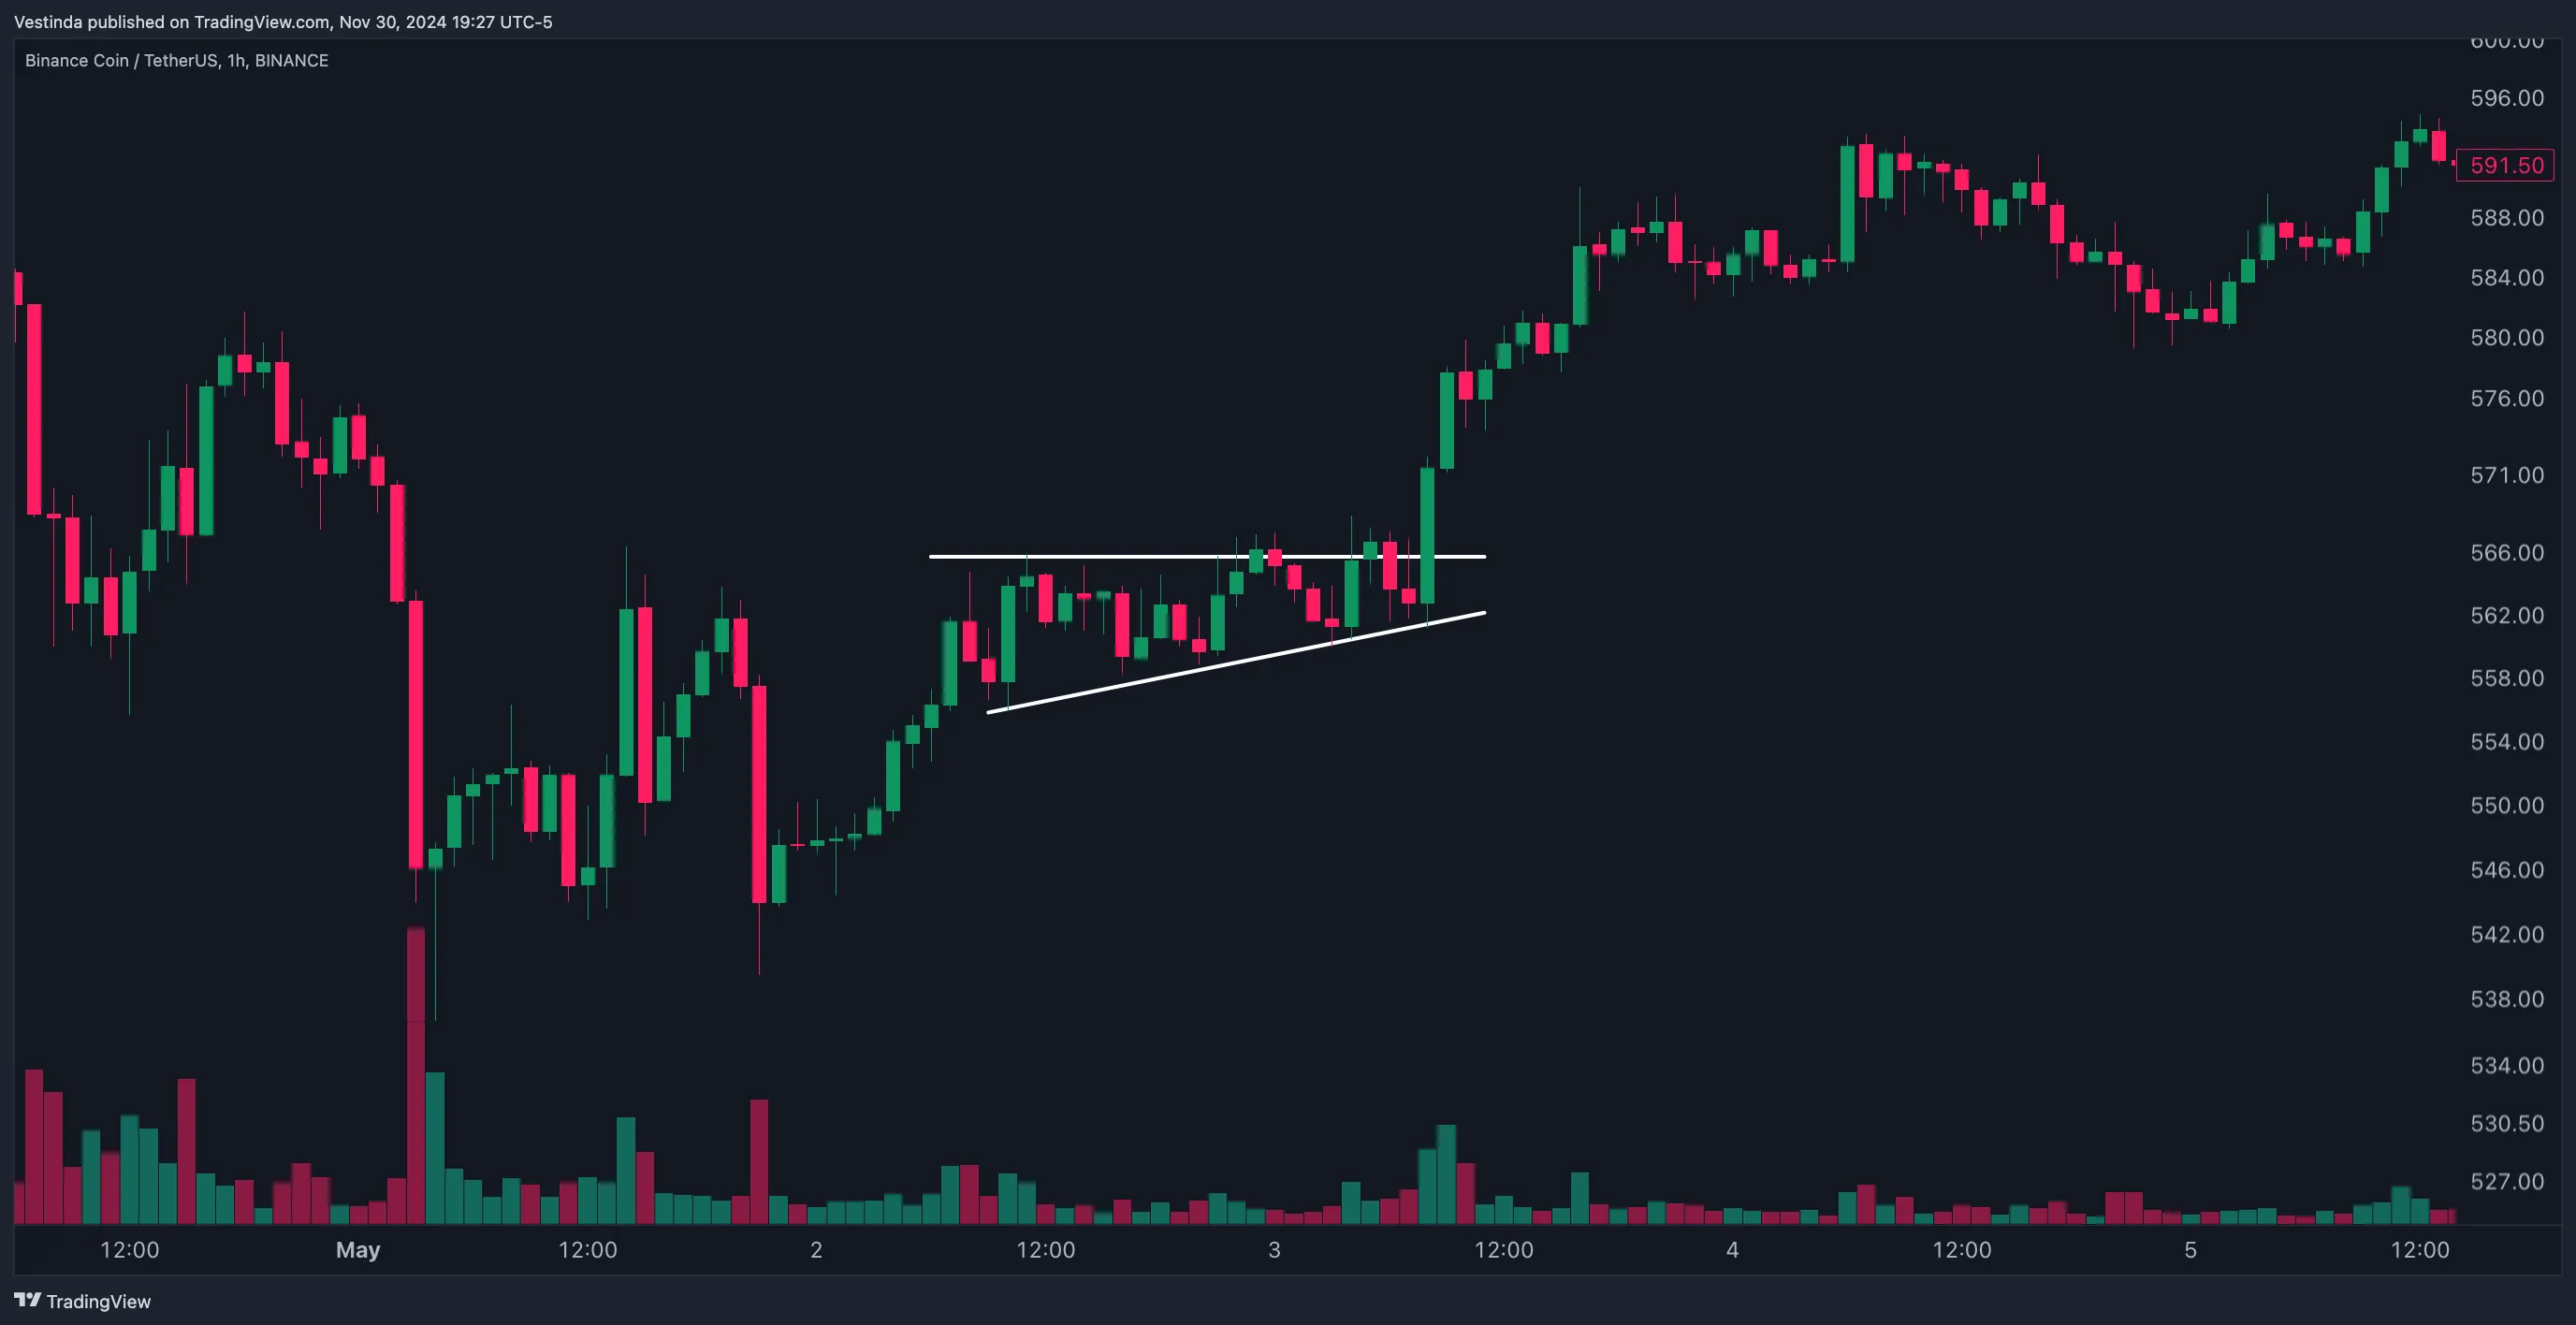
How to Trade:
- Buy Signal: Enter long when price breaks and closes above the resistance line with strong volume.
- Stop-Loss: Place just below the last higher low within the triangle.
- Enhancement Tip: Combine with VWAP to confirm the breakout. If the breakout occurs above VWAP, it strengthens the bullish signal.
4. Descending Triangle
What It Is: A bearish continuation pattern marked by a horizontal support line and descending resistance levels, signaling a potential breakdown.
When It Forms: During a downtrend or consolidation, often leading to further price declines.

How to Trade:
- Sell Signal: Enter short when price breaks and closes below the support line with increased volume.
- Stop-Loss: Place just above the last lower high within the triangle.
- Enhancement Tip: Use RSI to confirm bearish momentum. If RSI is below 50, it validates the bearish breakout.
5. Double Top and Double Bottom
What They Are: Double Top: A bearish reversal pattern forming two peaks at roughly the same level. Double Bottom: A bullish reversal pattern forming two troughs at roughly the same level.
When They Form: Double Tops appear at the end of an uptrend, while Double Bottoms form at the end of a downtrend.

How to Trade:
- Double Top Sell Signal: Enter short when price breaks below the neckline (support level connecting the two lows).
- Double Bottom Buy Signal: Enter long when price breaks above the neckline (resistance level connecting the two highs).
- Stop-Loss: Place above the peaks for Double Tops and below the troughs for Double Bottoms.
- Enhancement Tip: Pair with volume analysis. Breakouts with high volume are more reliable.
Tips for Using Chart Patterns Effectively
- Combine with Indicators: Use RSI or MACD to validate the signals provided by chart patterns, improving reliability.
- Monitor Volume: Volume plays a critical role in confirming breakouts and reversals. Patterns with strong volume support are more likely to succeed.
- Adjust for Timeframes: Patterns on higher timeframes, like 4-hour or daily charts, tend to be more reliable than those on lower timeframes.
- Risk Management: Always set stop-loss levels to protect against false breakouts or pattern failures.
Common Mistakes to Avoid
- Forcing Patterns: Don’t interpret random price movements as chart patterns; wait for clear and well-defined setups.
- Ignoring Confirmation: Always seek confirmation from volume or technical indicators before entering trades.
- Neglecting Market Context: Patterns are more effective when aligned with the broader market trend and sentiment.
Conclusion
Chart patterns provide powerful insights into BNB’s price behavior, helping traders anticipate movements with accuracy. By mastering patterns like bullish and bearish engulfing, triangles, and double tops/bottoms, and combining them with indicators, traders can gain a significant edge in the market. Remember, patience and confirmation are key to unlocking the full potential of these strategies.
Profitable BNB Trading Chart Patterns
- Identify a chart pattern (e.g., head and shoulders, double top/bottom) on the BNB price chart.
- Confirm the pattern by analyzing volume, trend lines, and pattern symmetry.
- Determine the entry and exit points based on the pattern's rules and guidelines.
- Set up stop-loss and take-profit levels to manage risk and maximize profits.
- Monitor the price action to validate the pattern's development and execution opportunity.
- If the pattern completes successfully, execute the trade according to the planned strategy.
- Regularly review and adjust the strategy based on changing market conditions and patterns.
Uncharted Spaces: BNB Price Chart Lapses
Gaps in BNB price charts are significant occurrences that can provide valuable insights for traders. These gaps appear when there is a sudden jump between two consecutive trading sessions, resulting in a void on the chart.
Typically, gaps indicate a significant shift in market sentiment or a sudden change in supply and demand dynamics. They can be classified into four types: breakaway gaps, runaway gaps, exhaustion gaps, and common gaps.
Breakaway gaps occur at the beginning of a trend and signal a strong potential for the continuation of that trend. Runaway gaps, on the other hand, emerge in the middle of an uptrend or downtrend, suggesting increased momentum.
Exhaustion gaps often occur near the end of a trend, indicating a reversal might be imminent. Lastly, common gaps are regarded as less significant as they are not usually accompanied by high trading volumes.
Monitoring and analyzing these gaps can assist traders in making informed decisions and identifying potential entry or exit points in the BNB market.
Spotting Price and Breakaway Gaps in BNB
Price gaps in BNB can provide valuable insights for traders. These gaps occur when there is a significant difference between the closing price of one trading session and the opening price of the next. Recognizing price gaps is crucial as they often indicate a change in market sentiment. Breakaway gaps, in particular, occur during periods of high volatility and signal a potential trend reversal or continuation. Traders should pay attention to breakaway gaps as they can provide opportunities for profitable trades. These gaps offer a clear break from the previous price action, indicating new market dynamics. By understanding and recognizing price gaps and breakaway gaps in BNB, traders can make more informed decisions and potentially capitalize on these market movements.
Mastering Chart Patterns in BNB Swing Trading
BNB swing traders can effectively apply chart patterns to improve their trading strategies. These patterns, such as double tops and bottoms, head and shoulders, and triangles, provide key insights into potential price movements. By identifying these patterns, traders can make informed decisions on when to enter or exit a trade. For example, a double top pattern may indicate a downward price reversal, indicating an opportunity to sell. On the other hand, a triangle pattern can signal a potential breakout, providing a chance to buy. The accuracy of these patterns can be further enhanced by incorporating other technical indicators and market analysis. Ultimately, BNB swing traders can benefit from studying and applying chart patterns to increase their chances of success in the cryptocurrency market.
Sophisticated backtesting is not only possession of high-esteemed hedge funds anymore.
Impressive Team and support, Backtesting engine with detailed reports, The Strategy builder.

Great purchase!
I have always manually invested in stocks and cryptocurrencies, but after studying Vestinda, I must say it has enormous potential.

Mature platform for trading
Pro: Easy to use, Nice UX, A lot of customization for strategies, Back testing is an awesome tool, can check any strategy in history.

Frequently Asked Questions
The chart pattern technique is a method used in technical analysis to identify recurring patterns in price charts of financial assets. It involves studying historical price data and looking for specific formations that can help predict future price movements. Chart patterns can include recognizable shapes such as triangles, head and shoulders, or double tops/bottoms. Traders and investors use these patterns to make informed decisions on when to enter or exit positions. By understanding the psychology behind these patterns, market participants can potentially gain an edge in forecasting price direction and timing their trades effectively.
The M shape in trading refers to a technical chart pattern that resembles the letter "M." It typically indicates a bearish trend reversal in the market. The pattern consists of two valleys, with the first valley being smaller than the second. The formation suggests that the price has attempted to rally, but failed to break through a certain resistance level, signaling a shift in investor sentiment. Traders often interpret the M shape as a signal to sell or take short positions, expecting a downward price movement. However, it is important to consider other technical indicators and market conditions before making any trading decisions.
Learning to read charts involves understanding the elements and symbols used to represent data visually. Start by grasping the basics, such as identifying the axes, scales, and labels. Next, focus on deciphering the different chart types, such as line, bar, or pie charts, and their purpose. Learn to interpret the patterns, trends, and correlations within the data. Practice analyzing charts by critically examining their components and making connections between them. Regular exposure to charts and graphs will enhance your proficiency over time. Online tutorials, courses, and real-life applications can also assist in mastering this skill.
Yes, artificial intelligence (AI) can be utilized for automated chart pattern recognition in BNB. Machine learning algorithms can be trained on historical chart data to identify patterns, trends, and potential trading opportunities. By analyzing various technical indicators, AI systems can automatically recognize chart patterns such as triangles, head and shoulders, and double tops/bottoms. This automation helps traders save time and make informed decisions based on reliable pattern recognition. With the ability of AI to process vast amounts of data quickly, it becomes an effective tool for efficient and accurate chart pattern recognition in BNB trading.
The triple bottom pattern is a bullish chart pattern typically found in technical analysis. It forms when the price of a security reaches a low point three times, creating a strong support level. Each "bottom" should be approximately at the same level. This pattern suggests that buying pressure is increasing and that the security is likely to reverse its downtrend. Traders and investors often look for confirmation signals, such as increased trading volume or price breakouts above previous resistance levels, to validate the formation. The triple bottom pattern is considered a reliable indicator for potential upward price movements.
Conclusion
In conclusion, understanding BNB chart patterns is essential for traders in the cryptocurrency market to enhance their trading strategies and maximize profits. By analyzing BNB chart patterns, traders can identify trends, reversals, and price breakouts, enabling them to make informed decisions. Additionally, monitoring and analyzing price gaps in BNB can provide valuable insights and potential entry or exit points in the market. Incorporating chart patterns and technical indicators can further improve trading strategies for BNB swing traders. Whether a beginner or experienced trader, utilizing chart patterns can greatly enhance trading strategies and increase success in the BNB market.

Successful traders rely on backtesting to be profitable.
Be like them with our
Free Backtesting Guide