-
 Create
account -
 Discover profitable
strategies -
 Connect exchange
& start earning
Quant Strategies & Backtesting results for AMD
Here are some AMD trading strategies along with their past performance. You can validate these strategies (and many more) for free on Vestinda across thousands of assets and many years of historical data.
Quant Trading Strategy: Awesome Oscillator Momentum Strategy on AMD
The backtesting results for the trading strategy, covering a period from December 13, 2016, to December 13, 2023, exhibit promising statistics. The profit factor of 2.27 indicates that, on average, for every unit of risk taken, the strategy generated 2.27 units of profit. The annualized return on investment (ROI) stands at an impressive 66.12%, indicating consistent and substantial returns. The average holding time for trades was observed to be approximately 6 weeks, implying a patient approach. With an average of 0.08 trades per week, the strategy displayed low trading frequency. Out of the 30 closed trades, 53.33% turned out to be winners, further supporting the strategy's effectiveness. Overall, the return on investment amounted to an impressive 472.25%.
 AMD
AMD

Choose another period and try again.
Quant Trading Strategy: Awesome Oscillator Momentum Strategy on AMD
The backtesting results for the trading strategy from December 10, 2016, to December 10, 2023, reveal promising statistics. The strategy exhibited a profit factor of 2.27, indicating a favorable risk-reward ratio. The annualized return on investment stood at an impressive 66.12%, reflecting consistent growth. The average holding time for trades amounted to around 6 weeks, suggesting a moderate-term approach. With an average of 0.08 trades per week, the strategy demonstrated a patient and selective approach. Over the specified period, there were a total of 30 closed trades. The return on investment amounted to an astounding 472.25%, highlighting the strategy's potential for financial gains. Additionally, the winning trades percentage reached 53.33%, indicating a moderate success rate.
AMD
Choose another period and try again.
Mastering AMD's Profitable Chart Patterns
- Identify the chart pattern by analyzing the price movement of AMD's stock.
- Determine the type of pattern, such as a head and shoulders or a cup and handle.
- Confirm the pattern by looking for specific criteria, such as trendlines, price levels, or volume.
- Set your entry and exit points based on the pattern's breakout or breakdown levels.
- Place your stop-loss order to manage risk and protect your capital.
- Implement a risk/reward ratio to determine the potential profit compared to potential loss.
- Monitor the pattern's progress and adjust your trading strategy accordingly.
- Consider additional technical analysis indicators to support your trading decision, if necessary.
- Execute the trade according to your plan and continuously evaluate its performance.
Chart Patterns for Profiting in Stocks, including AMD
Introduction
Advanced Micro Devices (AMD) is a leading semiconductor company whose stock is known for its volatility and strong price movements, making it an attractive choice for traders. By mastering key chart patterns, traders can capitalize on these movements and make informed trading decisions. This article will explore the most profitable chart patterns for trading AMD, providing insights and strategies to help you maximize your trading potential.
Why Focus on Chart Patterns for AMD?
- Predictive Power: Chart patterns provide visual cues about potential future price movements, helping traders anticipate market trends.
- Volatility: AMD’s stock is known for its significant price swings, which often lead to the formation of clear chart patterns.
- Versatility: Chart patterns can be applied across different timeframes, making them useful for day trading, swing trading, and long-term investing.
Key Chart Patterns to Master for AMD Trading
Head and Shoulders Pattern
Concept: The Head and Shoulders is a reversal pattern that signals a potential change in trend direction. It consists of three peaks: a higher peak (the head) between two lower peaks (the shoulders).
How to Trade It:
- Bearish Head and Shoulders: Look for a break below the neckline after the right shoulder forms, signaling a potential sell opportunity.
- Bullish Inverse Head and Shoulders: Look for a break above the neckline after the right shoulder forms, signaling a potential buy opportunity.
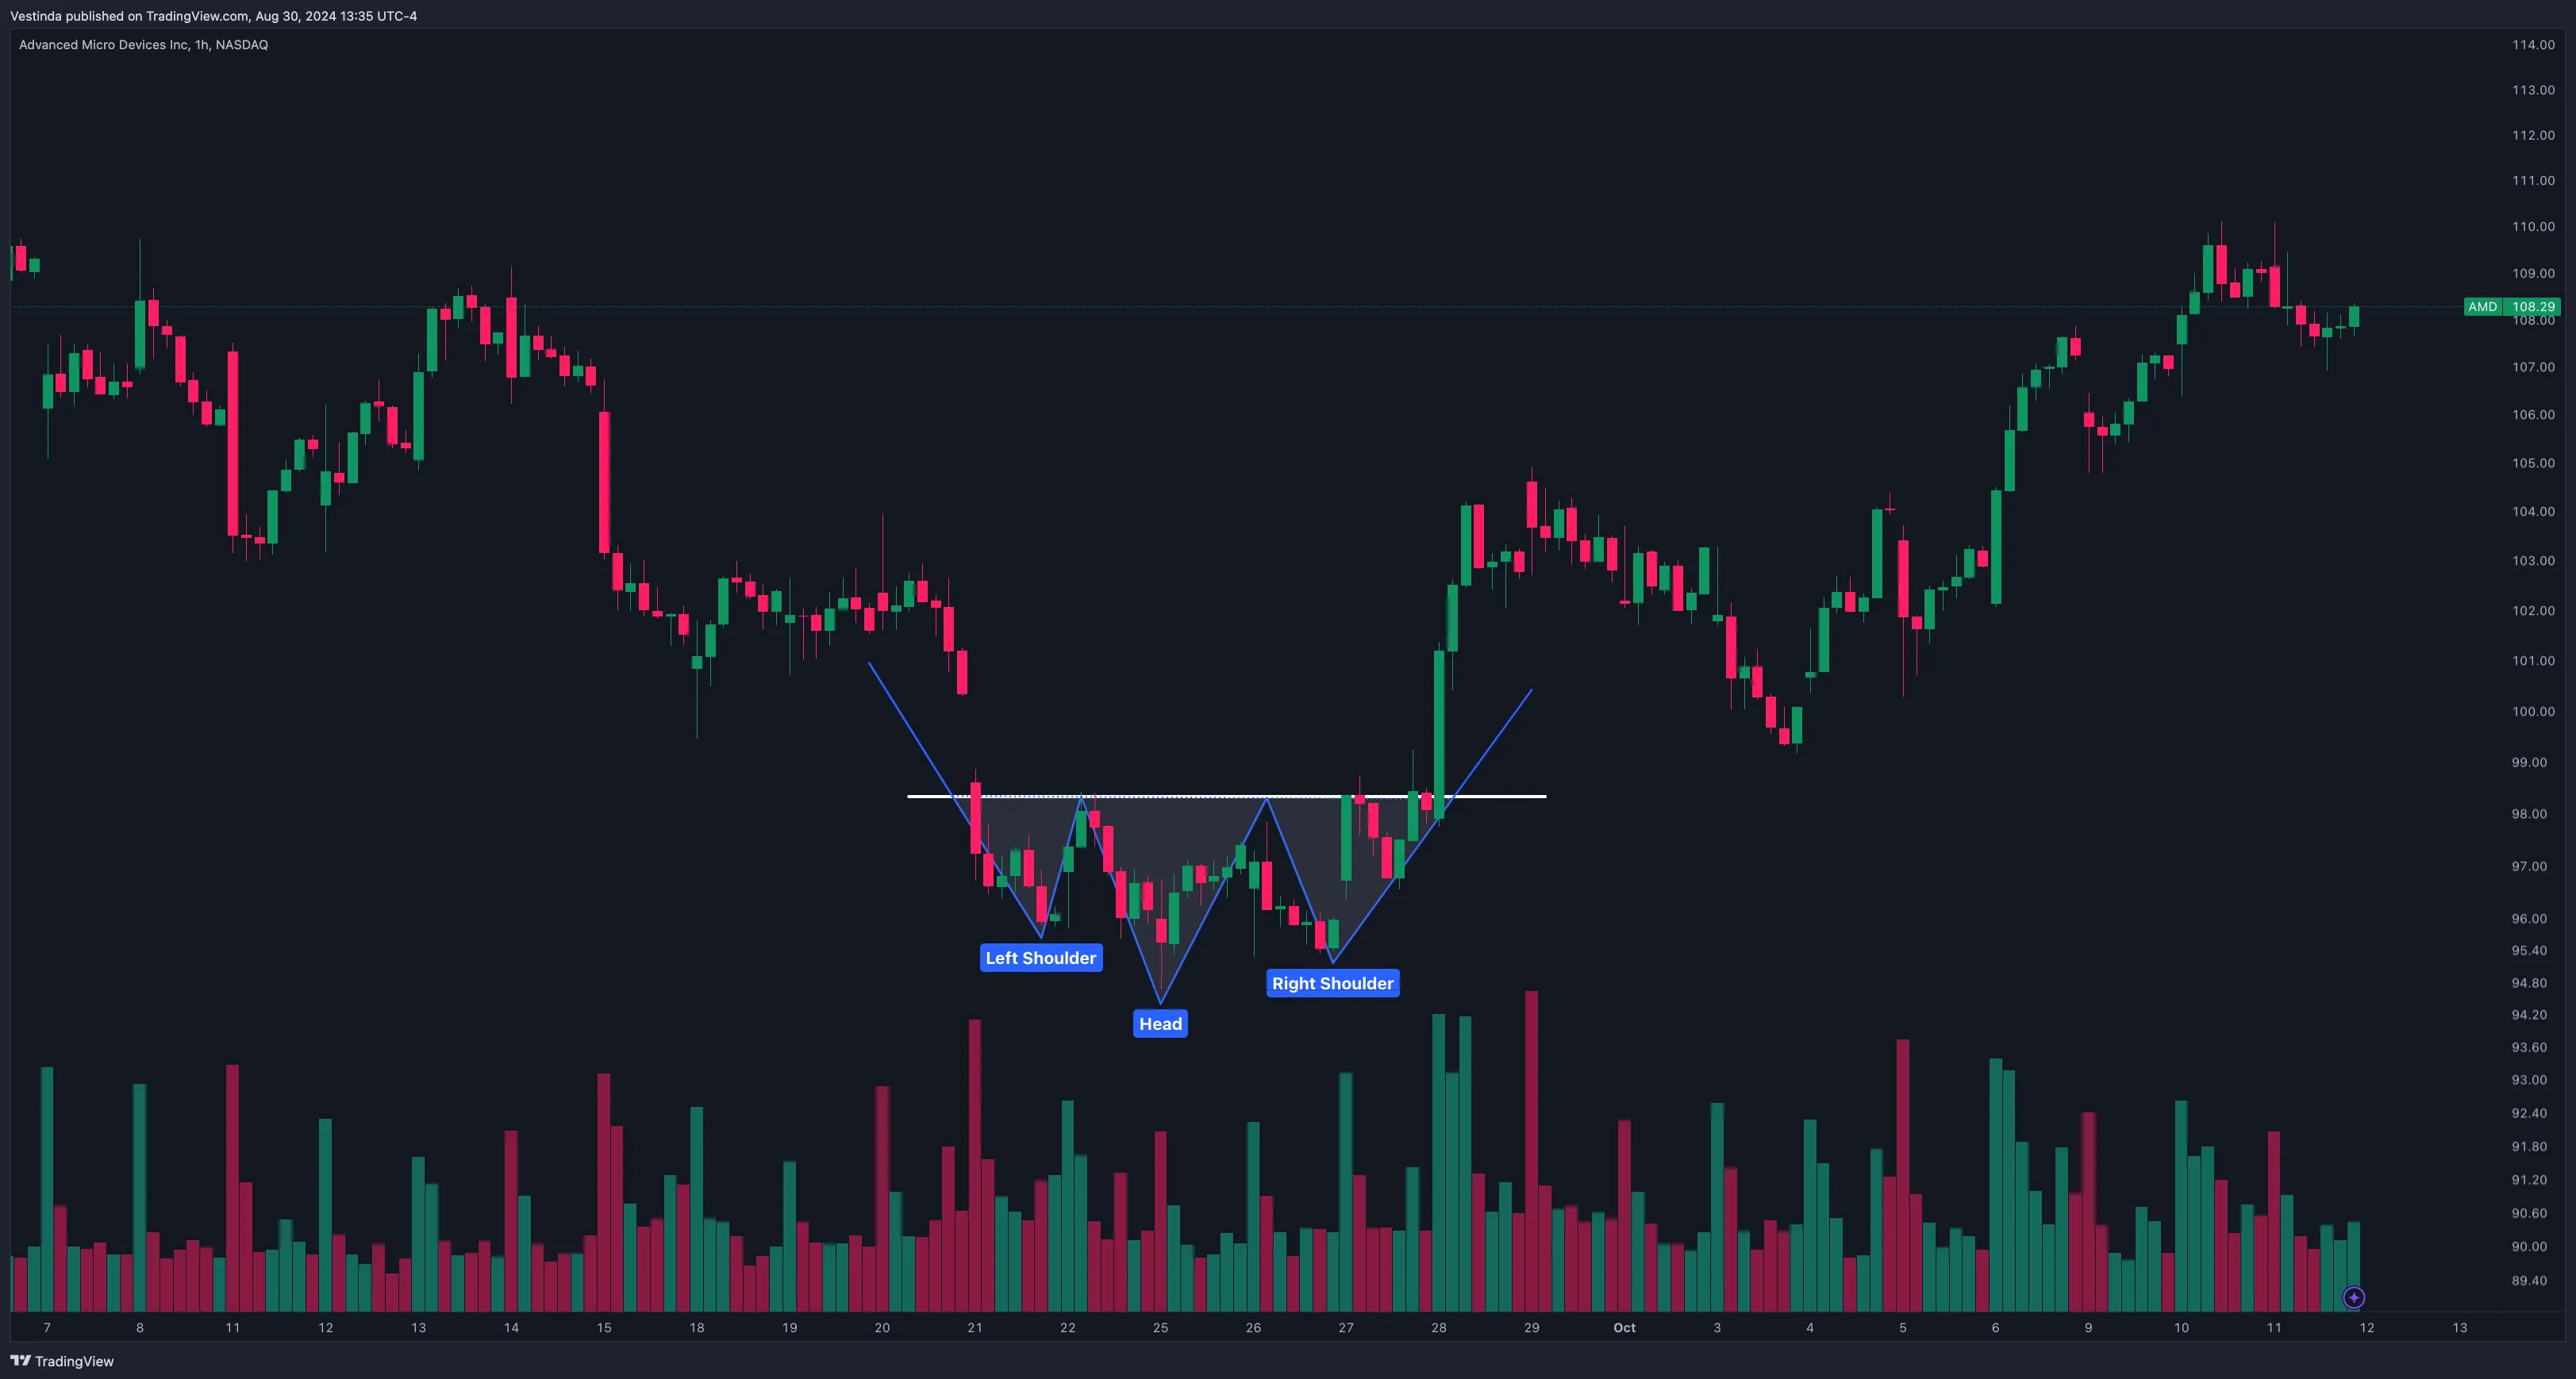
Application: This pattern is particularly effective in capturing trend reversals in AMD after significant uptrends or downtrends.
Double Top and Double Bottom
Concept: The Double Top is a bearish reversal pattern that forms after an uptrend, characterized by two peaks at roughly the same level. The Double Bottom is a bullish reversal pattern that forms after a downtrend, characterized by two troughs at roughly the same level.
How to Trade It:
- Double Top: Enter a short position when the price breaks below the support level between the two peaks.
- Double Bottom: Enter a long position when the price breaks above the resistance level between the two troughs.
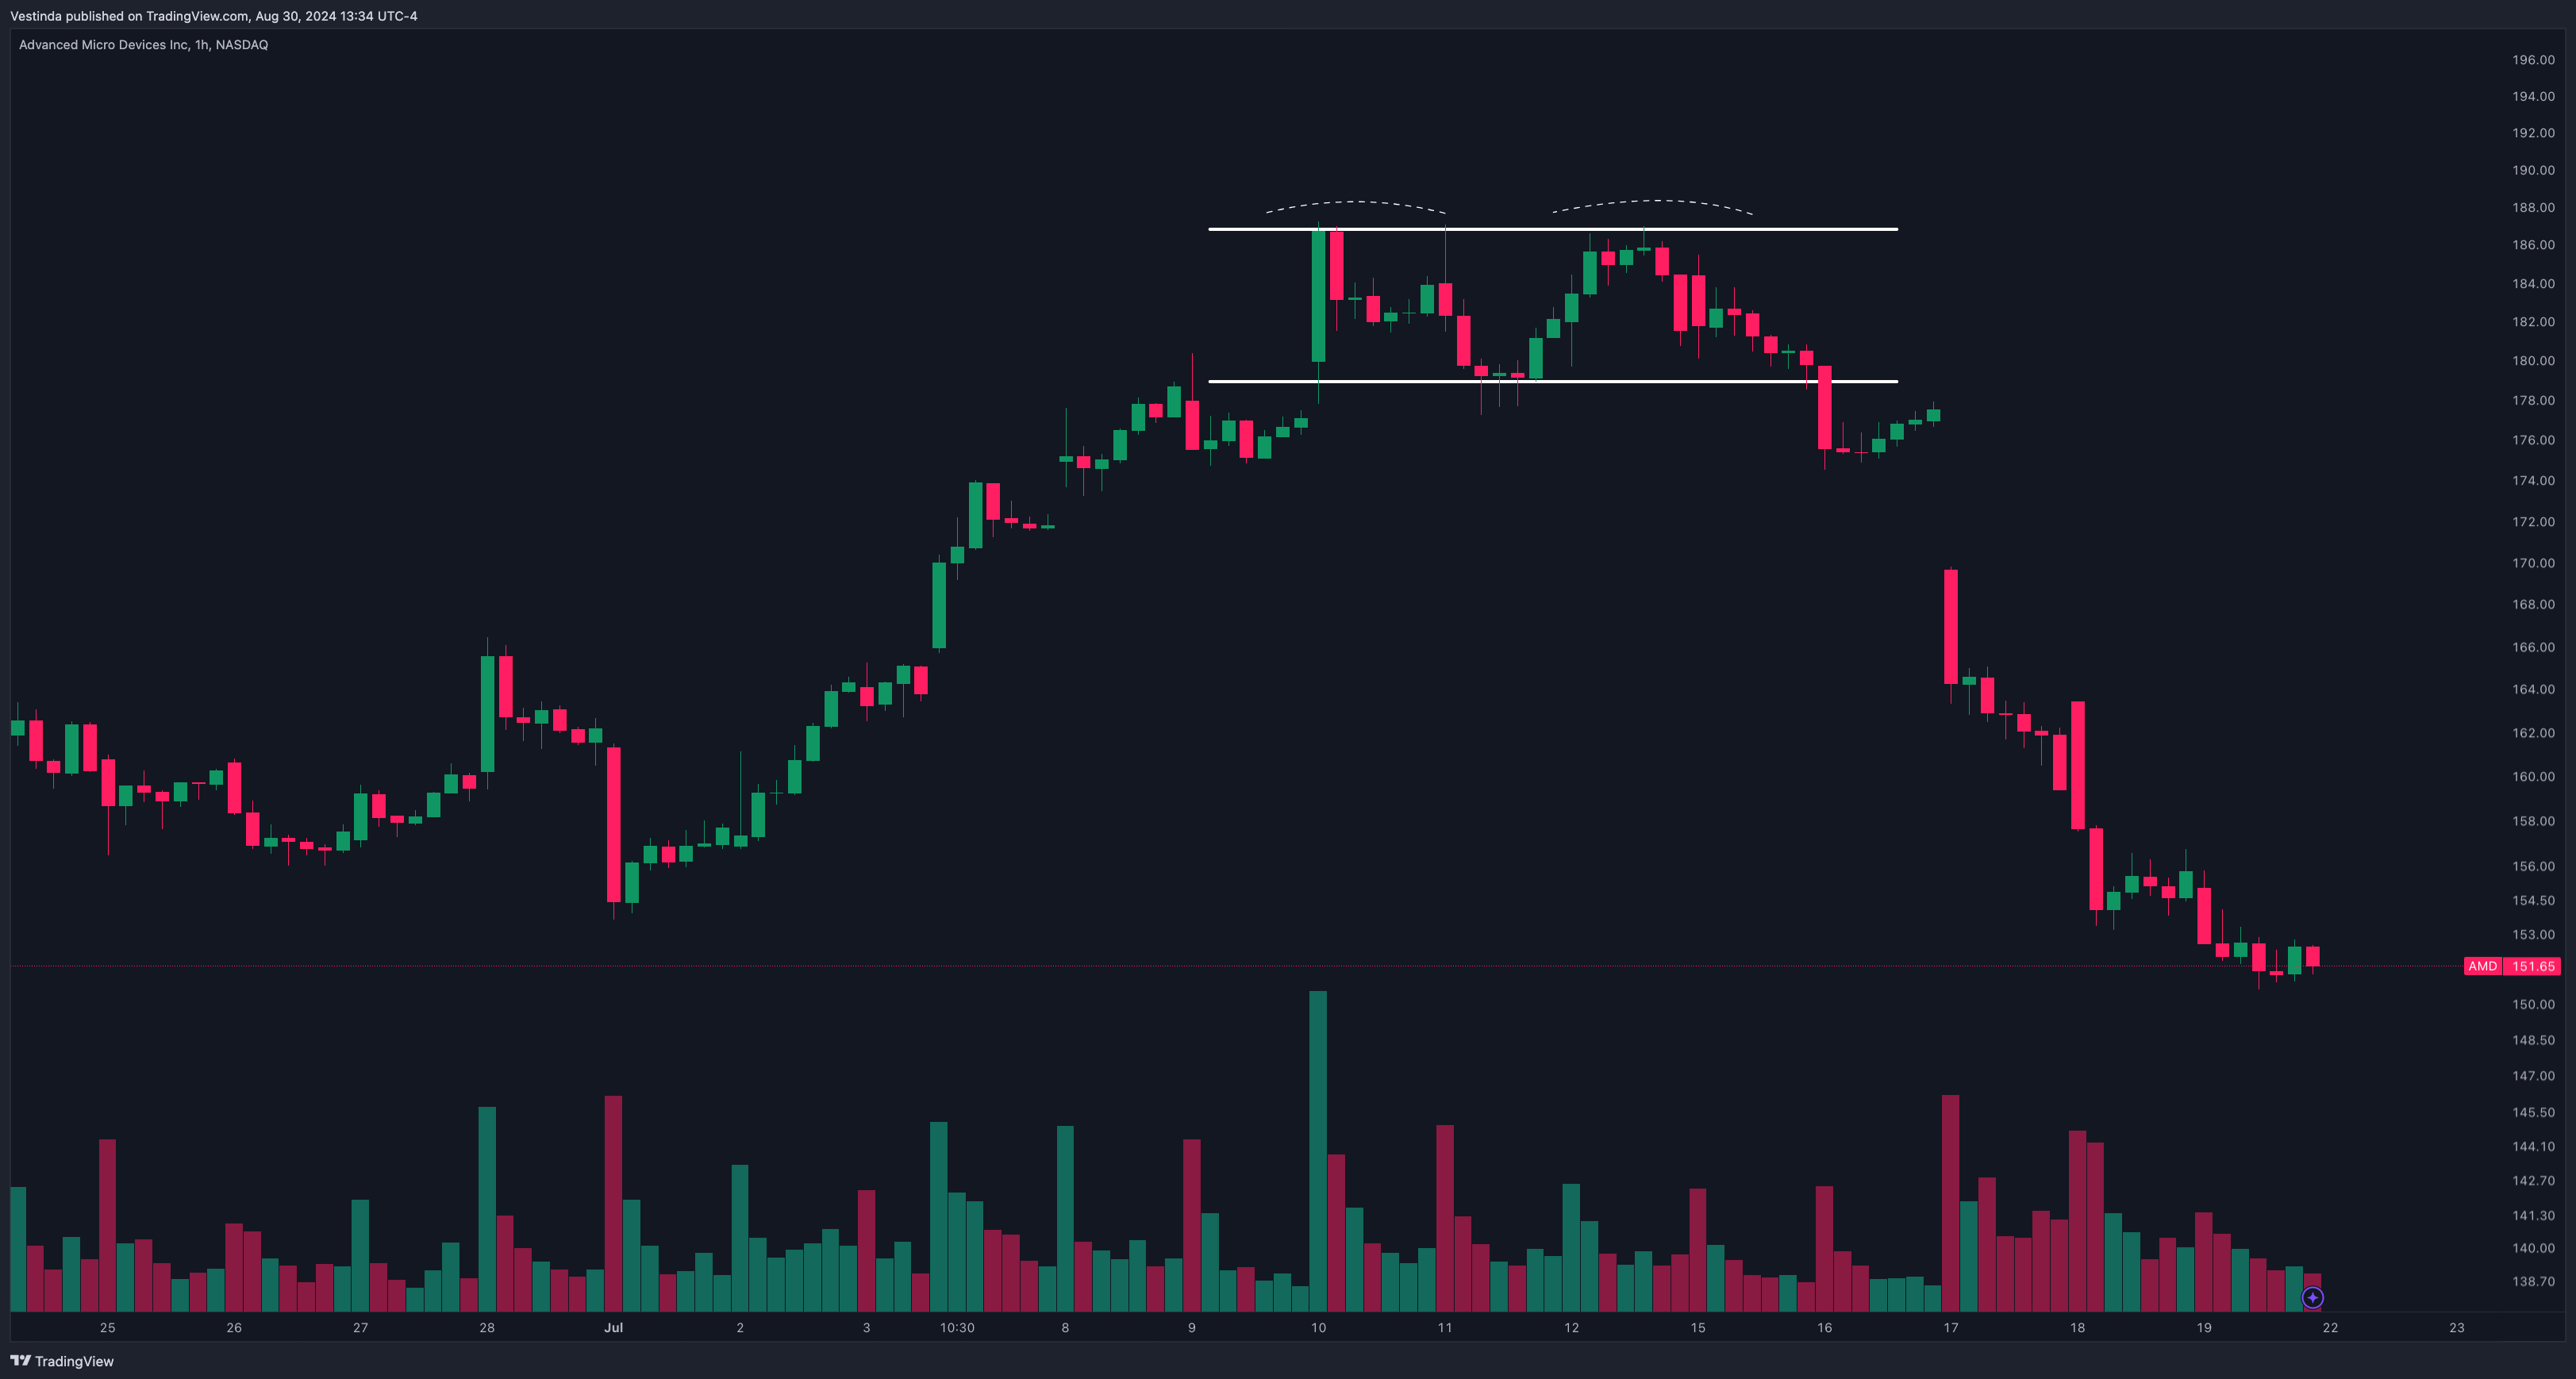
Application: These patterns are useful for identifying potential trend reversals in AMD’s price, especially after prolonged trends.
Ascending and Descending Triangles
Concept: Triangles are continuation patterns that typically form during periods of consolidation. An Ascending Triangle has a flat top resistance with rising lows, while a Descending Triangle has a flat bottom support with falling highs.
How to Trade It:
- Ascending Triangle: Buy when the price breaks above the flat resistance line, indicating a continuation of the uptrend.
- Descending Triangle: Sell when the price breaks below the flat support line, indicating a continuation of the downtrend.
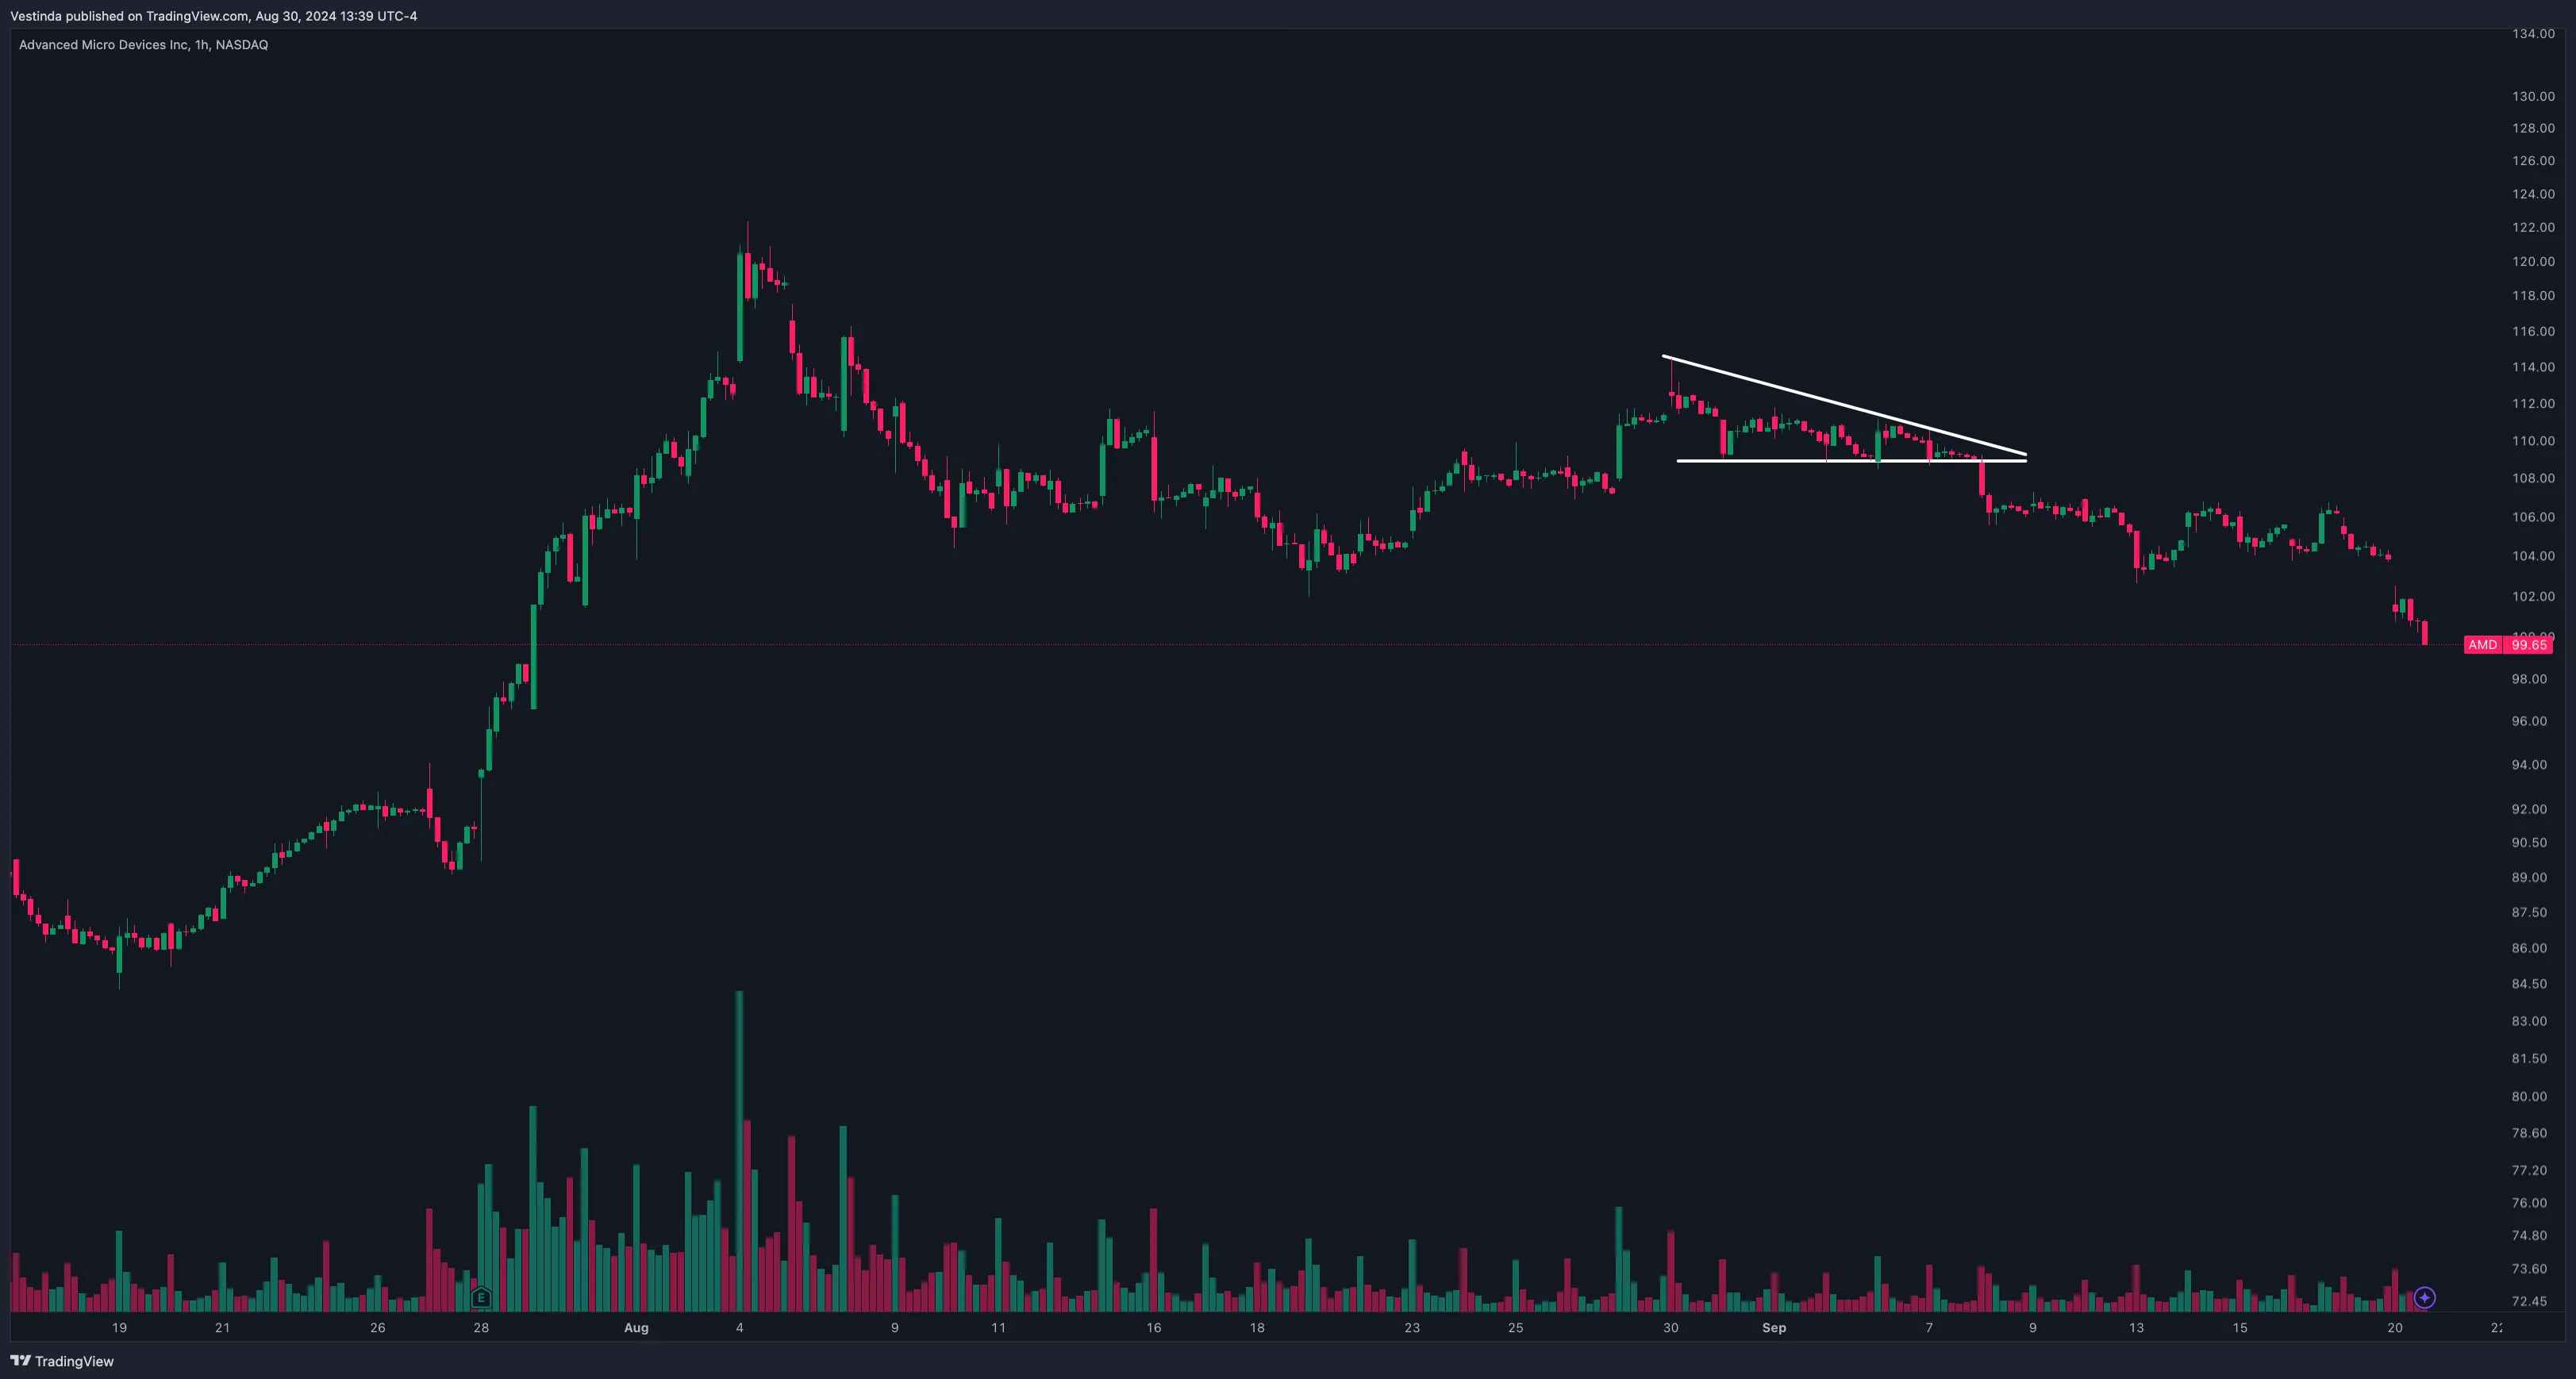
Application: These patterns are effective in trending markets, helping traders confirm the continuation of AMD’s price movement.
Cup and Handle Pattern
Concept: The Cup and Handle is a bullish continuation pattern where the price forms a "cup" shape followed by a small consolidation phase (the "handle") before breaking out.
How to Trade It:
- Buy Signal: Enter a long position when the price breaks above the resistance formed by the top of the handle, signaling a potential upward continuation.
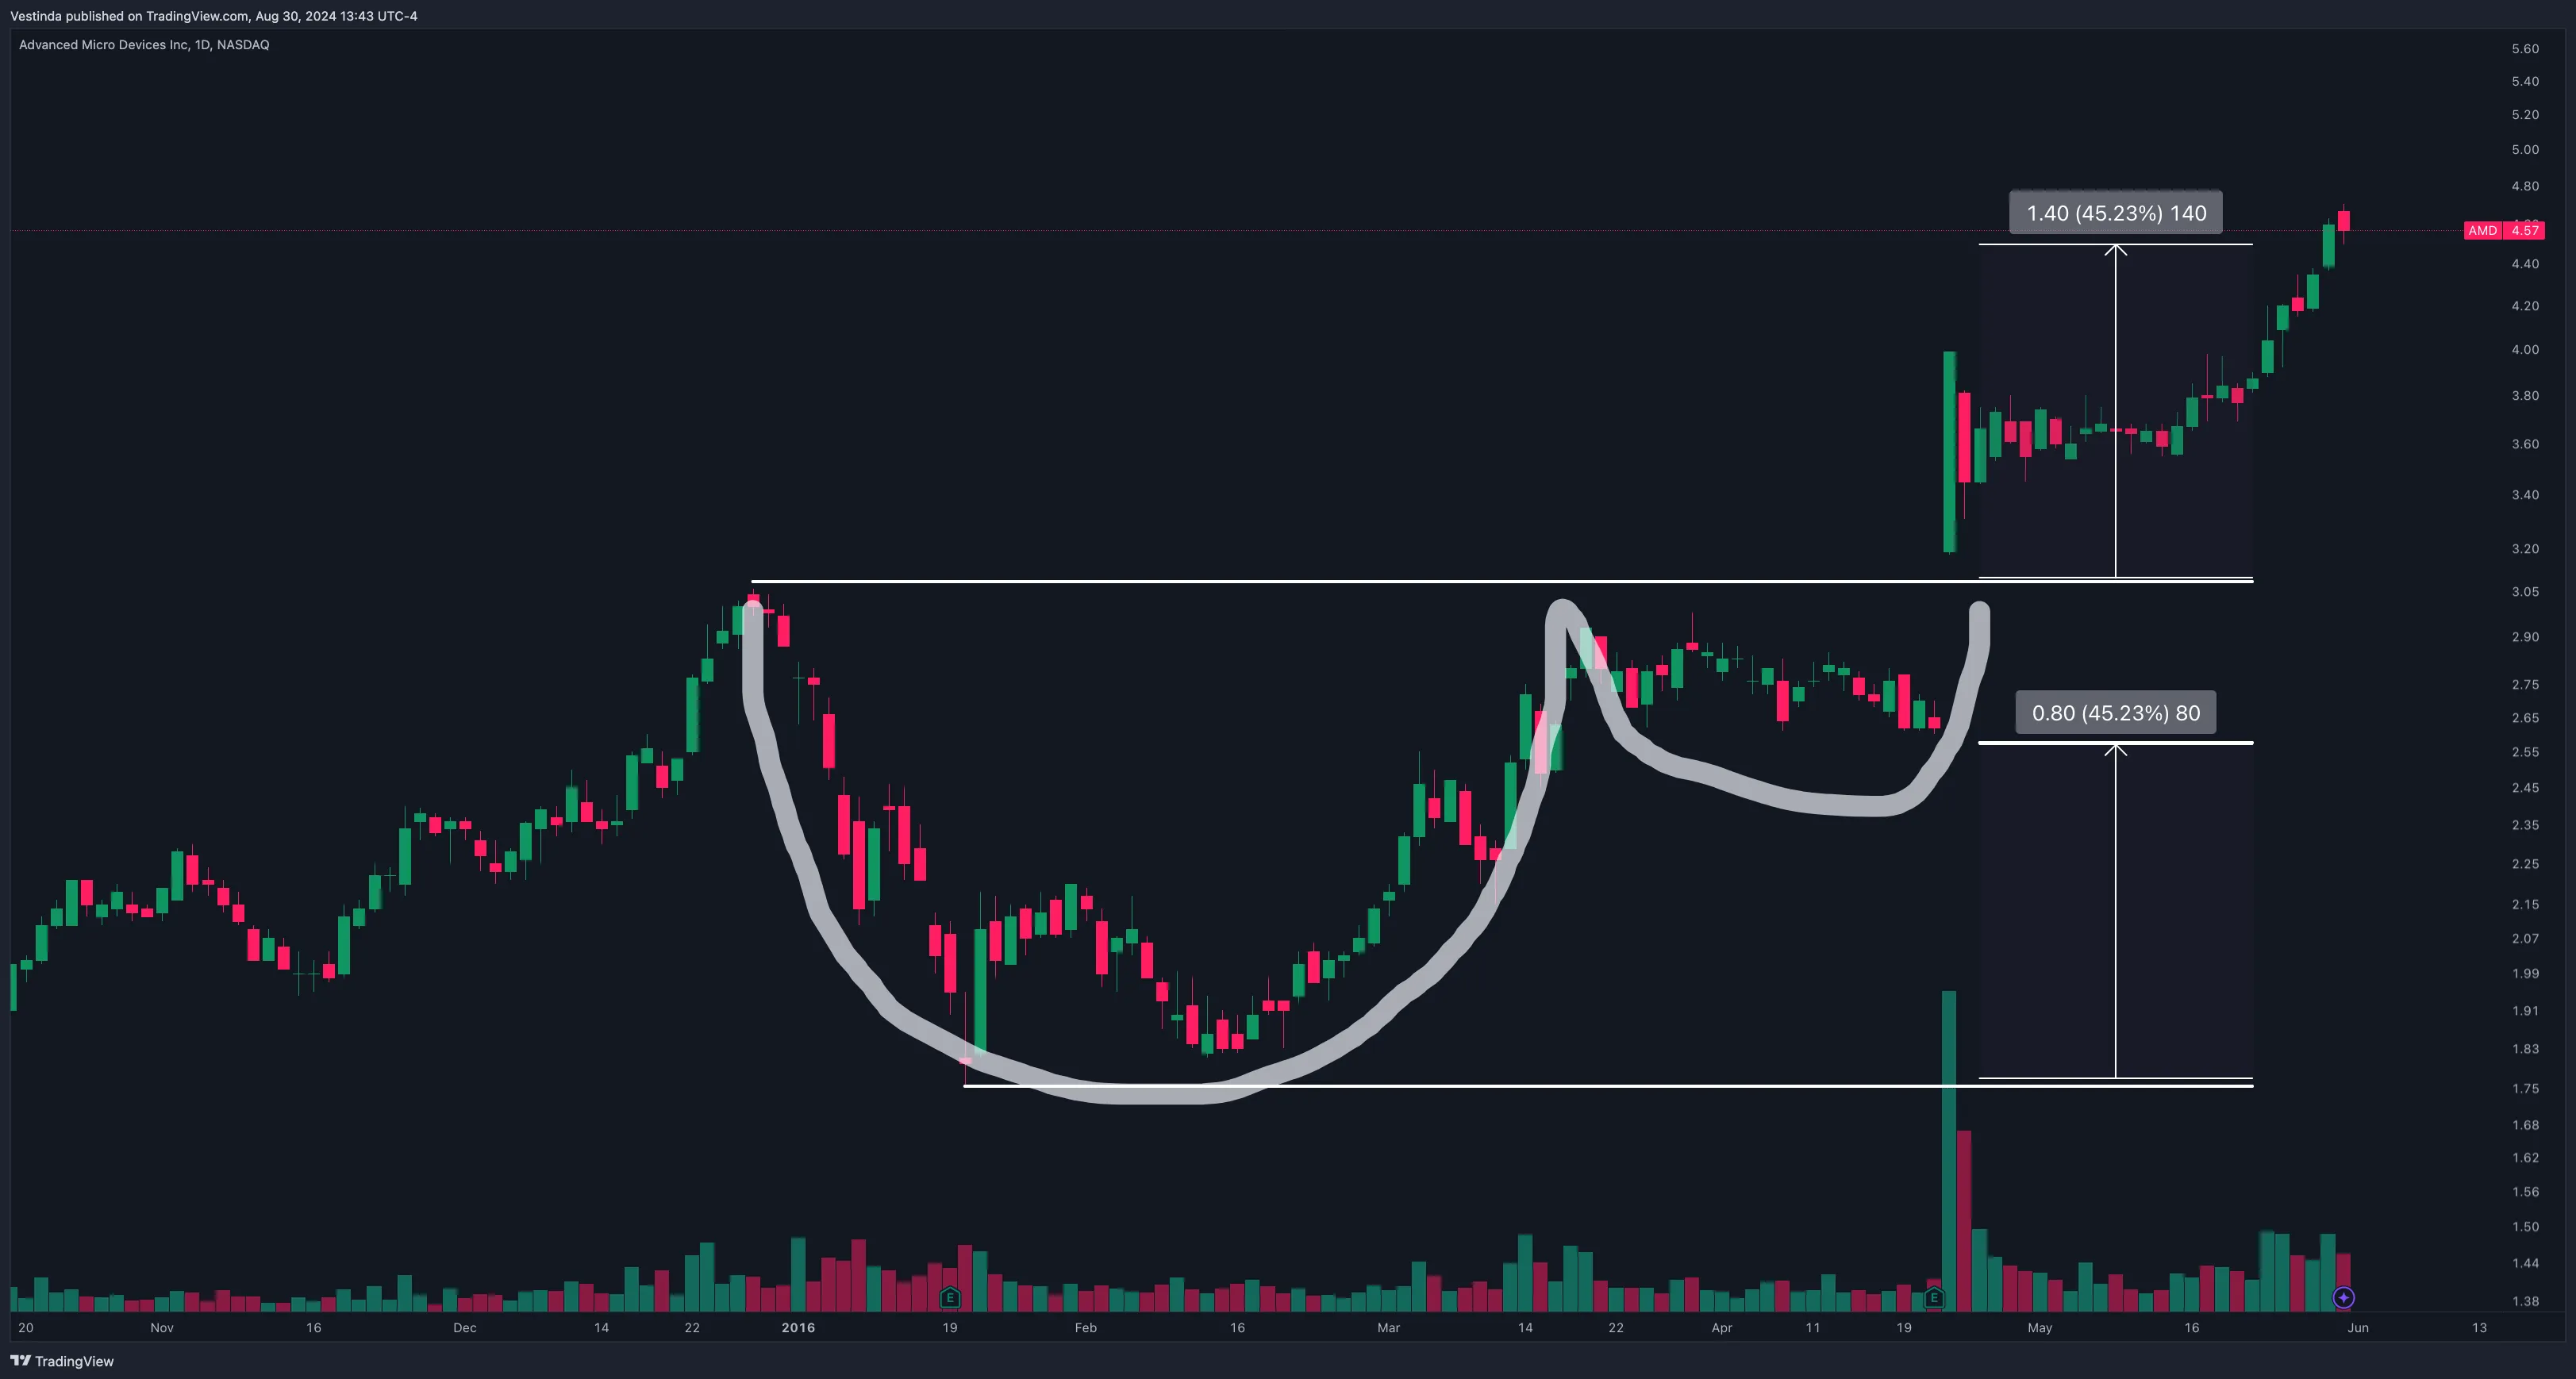
Application: This pattern is particularly useful for capturing long-term bullish trends in AMD after periods of consolidation.
Advanced Strategies Using AMD's Chart Patterns
Combining Patterns with Indicators
Why: Combining chart patterns with technical indicators like RSI, MACD, or Moving Averages can enhance the accuracy of your trades.
How: Use indicators to confirm the signals generated by chart patterns. For example, when trading a Head and Shoulders pattern, check if the RSI is indicating overbought conditions to validate a potential reversal.
Multiple Timeframe Analysis
Why: Analyzing chart patterns across multiple timeframes can provide a more comprehensive view of the market.
How: Identify a pattern on a higher timeframe (e.g., daily chart) to determine the overall trend, then zoom into a lower timeframe (e.g., 4-hour chart) to time your entries and exits.
Risk Management Techniques
Why: Trading AMD’s volatile price movements requires disciplined risk management to protect against significant losses.
How: Set stop-loss orders just outside key levels (e.g., below the neckline in a Head and Shoulders pattern) and use position sizing techniques to limit risk to a small percentage of your trading capital.
Decoding AMD's Price Chart Patterns
Gaps in AMD price charts can provide valuable information about market sentiment and potential future price movements. A gap occurs when there is a significant difference between the closing price of one trading session and the opening price of the next session. These gaps are caused by various factors, such as news releases, earnings announcements, or market volatility. When interpreting gaps, it is important to consider the type of gap and its location on the chart. Common types include breakaway gaps, continuation gaps, and exhaustion gaps. Breakaway gaps often signal the start of a new trend, while continuation gaps suggest a continuation of the current trend. Exhaustion gaps can indicate the end of a trend. Traders often use gap analysis to identify potential support and resistance levels, as well as entry and exit points for their trades. However, it is crucial to consider other technical indicators and market conditions before making trading decisions based solely on gaps in AMD price charts.
Sophisticated backtesting is not only possession of high-esteemed hedge funds anymore.
Impressive Team and support, Backtesting engine with detailed reports, The Strategy builder.

Great purchase!
I have always manually invested in stocks and cryptocurrencies, but after studying Vestinda, I must say it has enormous potential.

Mature platform for trading
Pro: Easy to use, Nice UX, A lot of customization for strategies, Back testing is an awesome tool, can check any strategy in history.

Frequently Asked Questions
Chart patterns can provide valuable insights into overbought or oversold conditions in AMD. Patterns like double tops, head and shoulders, or bearish engulfing can indicate potential overbought levels, suggesting a possible reversal or pullback. On the other hand, bullish engulfing, double bottoms, or ascending triangles may suggest oversold conditions where a stock may be due for a rebound. However, it is crucial to combine these patterns with other technical indicators and fundamental analysis for a more comprehensive assessment.
The accuracy of the head and shoulders pattern in predicting future price movements can vary. While it is a popular and widely recognized pattern, it is not foolproof and should be used in conjunction with other technical analysis tools. The pattern's accuracy depends on various factors such as market conditions, timeframe, and confirmation from other indicators. Traders should exercise caution and consider multiple factors before making trading decisions based solely on the head and shoulders pattern.
Continuation chart patterns indicate that the prevailing trend is likely to continue after a temporary pause, consolidation, or correction. Examples include flags, pennants, and triangles. These patterns are a sign of market digestion and often result in a continuation of the existing trend. On the other hand, reversal chart patterns suggest a potential shift in the current trend. Patterns like head and shoulders, double tops, and double bottoms signal a possible change in market direction. Traders use these patterns to identify potential turning points and seek to take advantage of new trends as they emerge.
Support and resistance levels are crucial components of AMD chart patterns. Support acts as a price level where buying interest is strong enough to prevent the stock from falling further. It serves as a floor that supports the stock's price and indicates a potential reversal. Resistance, on the other hand, acts as a price level where selling pressure becomes dominant and prevents the stock from rising further. It acts as a ceiling that limits upward price movement. Traders and analysts closely monitor these levels to make informed decisions regarding the stock's future price movement and potential entry or exit points.
A rising wedge pattern in AMD technical analysis typically indicates a bearish reversal. It is formed by converging trendlines with higher highs and higher lows, but with decreasing trading volume. Traders interpret this pattern as a potential trend reversal and a signal to sell or short the stock. Confirmation of the pattern occurs when the price breaks below the lower trendline. However, it is crucial to use additional technical indicators and price action analysis to validate the pattern and make informed trading decisions.
The best timeframe for chart patterns depends on an individual's trading style and objectives. Short-term traders often prefer smaller timeframes like 1-minute or 5-minute charts to identify quick patterns for day trading. Swing traders might find 1-hour or 4-hour charts more suitable, as they capture medium-term patterns. Long-term investors may utilize daily or weekly charts for identifying significant patterns over extended periods. The chosen timeframe should align with one's trading strategy, time availability, and risk tolerance, ensuring effective pattern analysis and decision-making. Ultimately, finding the ideal timeframe requires experimentation and understanding personal preferences and goals.
Conclusion
In conclusion, understanding AMD chart patterns can greatly enhance your trading strategy and give you a competitive edge in the stock market. By identifying and analyzing chart patterns, such as triangles, head and shoulders, and double tops/bottoms, you can anticipate potential price reversals or continuations in AMD's stock. However, it is important to use chart patterns alongside other analysis tools, consider market conditions, and watch for false signals. Additionally, patterns like the diamond top and bottom and gaps in price charts provide valuable insights into potential changes in AMD's stock price direction. By studying and interpreting these patterns, you can make informed trading decisions and navigate the stock market more effectively.

Successful traders rely on backtesting to be profitable.
Be like them with our
Free Backtesting Guide