
-
 Create
account -
 Build trading strategies
with no code -
 Validate
& Backtest -
 Automate
& start earning
Quant Strategies & Backtesting results for XRP
Here are some XRP trading strategies along with their past performance. You can validate these strategies (and many more) for free on Vestinda across thousands of assets and many years of historical data.
Quant Trading Strategy: ZLEMA Crossover with CMO on XRP
Based on the backtesting results for the trading strategy from December 10, 2018, to December 10, 2023, several key statistics can be observed. The profit factor stands at 1.34, indicating that for every unit of risk taken, a profit of 1.34 units was generated. The annualized return on investment (ROI) stands at 1.45%, which reflects the average annualized return of the strategy during the given period. The average holding time for trades was approximately 6 days, and there were an average of 0.01 trades per week. With a total of 5 closed trades, the strategy yielded a return on investment of 7.26%, while winning trades accounted for 40% of the total trades executed.

 XRPUSDT

Choose another period and try again.
Quant Trading Strategy: MVWAP and VWAP Crossover on XRP
The backtesting results for the trading strategy from December 8, 2018 to December 8, 2023, showcase promising statistics. The strategy demonstrates a profit factor of 1.6, indicating a favorable risk-to-reward ratio. The annualized return on investment stands at an impressive 130.74%, suggesting significant profitability over the analyzed period. On average, holdings were held for two weeks, reflecting a short-term trading approach. With an average of 0.21 trades per week, the strategy exhibits a disciplined trading frequency. The strategy generated 57 closed trades, with a winning trades percentage of 42.11%. Moreover, it significantly outperformed the buy and hold strategy by generating excess returns of 261.73%. Overall, these results suggest that the trading strategy has been successful and achieved notable profitability over the analyzed timeframe.
XRPUSDT
Choose another period and try again.
XRP (Ripple) Candlestick Patterns: A Complete Guide
Introduction
Candlestick patterns are among the most powerful tools for traders, offering insights into market sentiment and potential price movements. For XRP (Ripple), understanding these patterns can help traders identify bullish or bearish trends and make more informed decisions. This guide covers the most effective candlestick patterns for XRP trading, complete with examples and actionable tips.
Why Use Candlestick Patterns for XRP?
- Visual Clarity: Candlestick charts offer a clear visual representation of price action.
- Early Signals: Patterns can signal trend reversals or continuations before indicators confirm them.
- Versatility: Applicable across all timeframes, from intraday trading to long-term investing.
Key Bullish Candlestick Patterns for XRP
1. Bullish Engulfing
Description: A smaller red candle is followed by a larger green candle that completely engulfs it.
What It Indicates: Strong buying momentum, signaling a potential reversal from a downtrend.
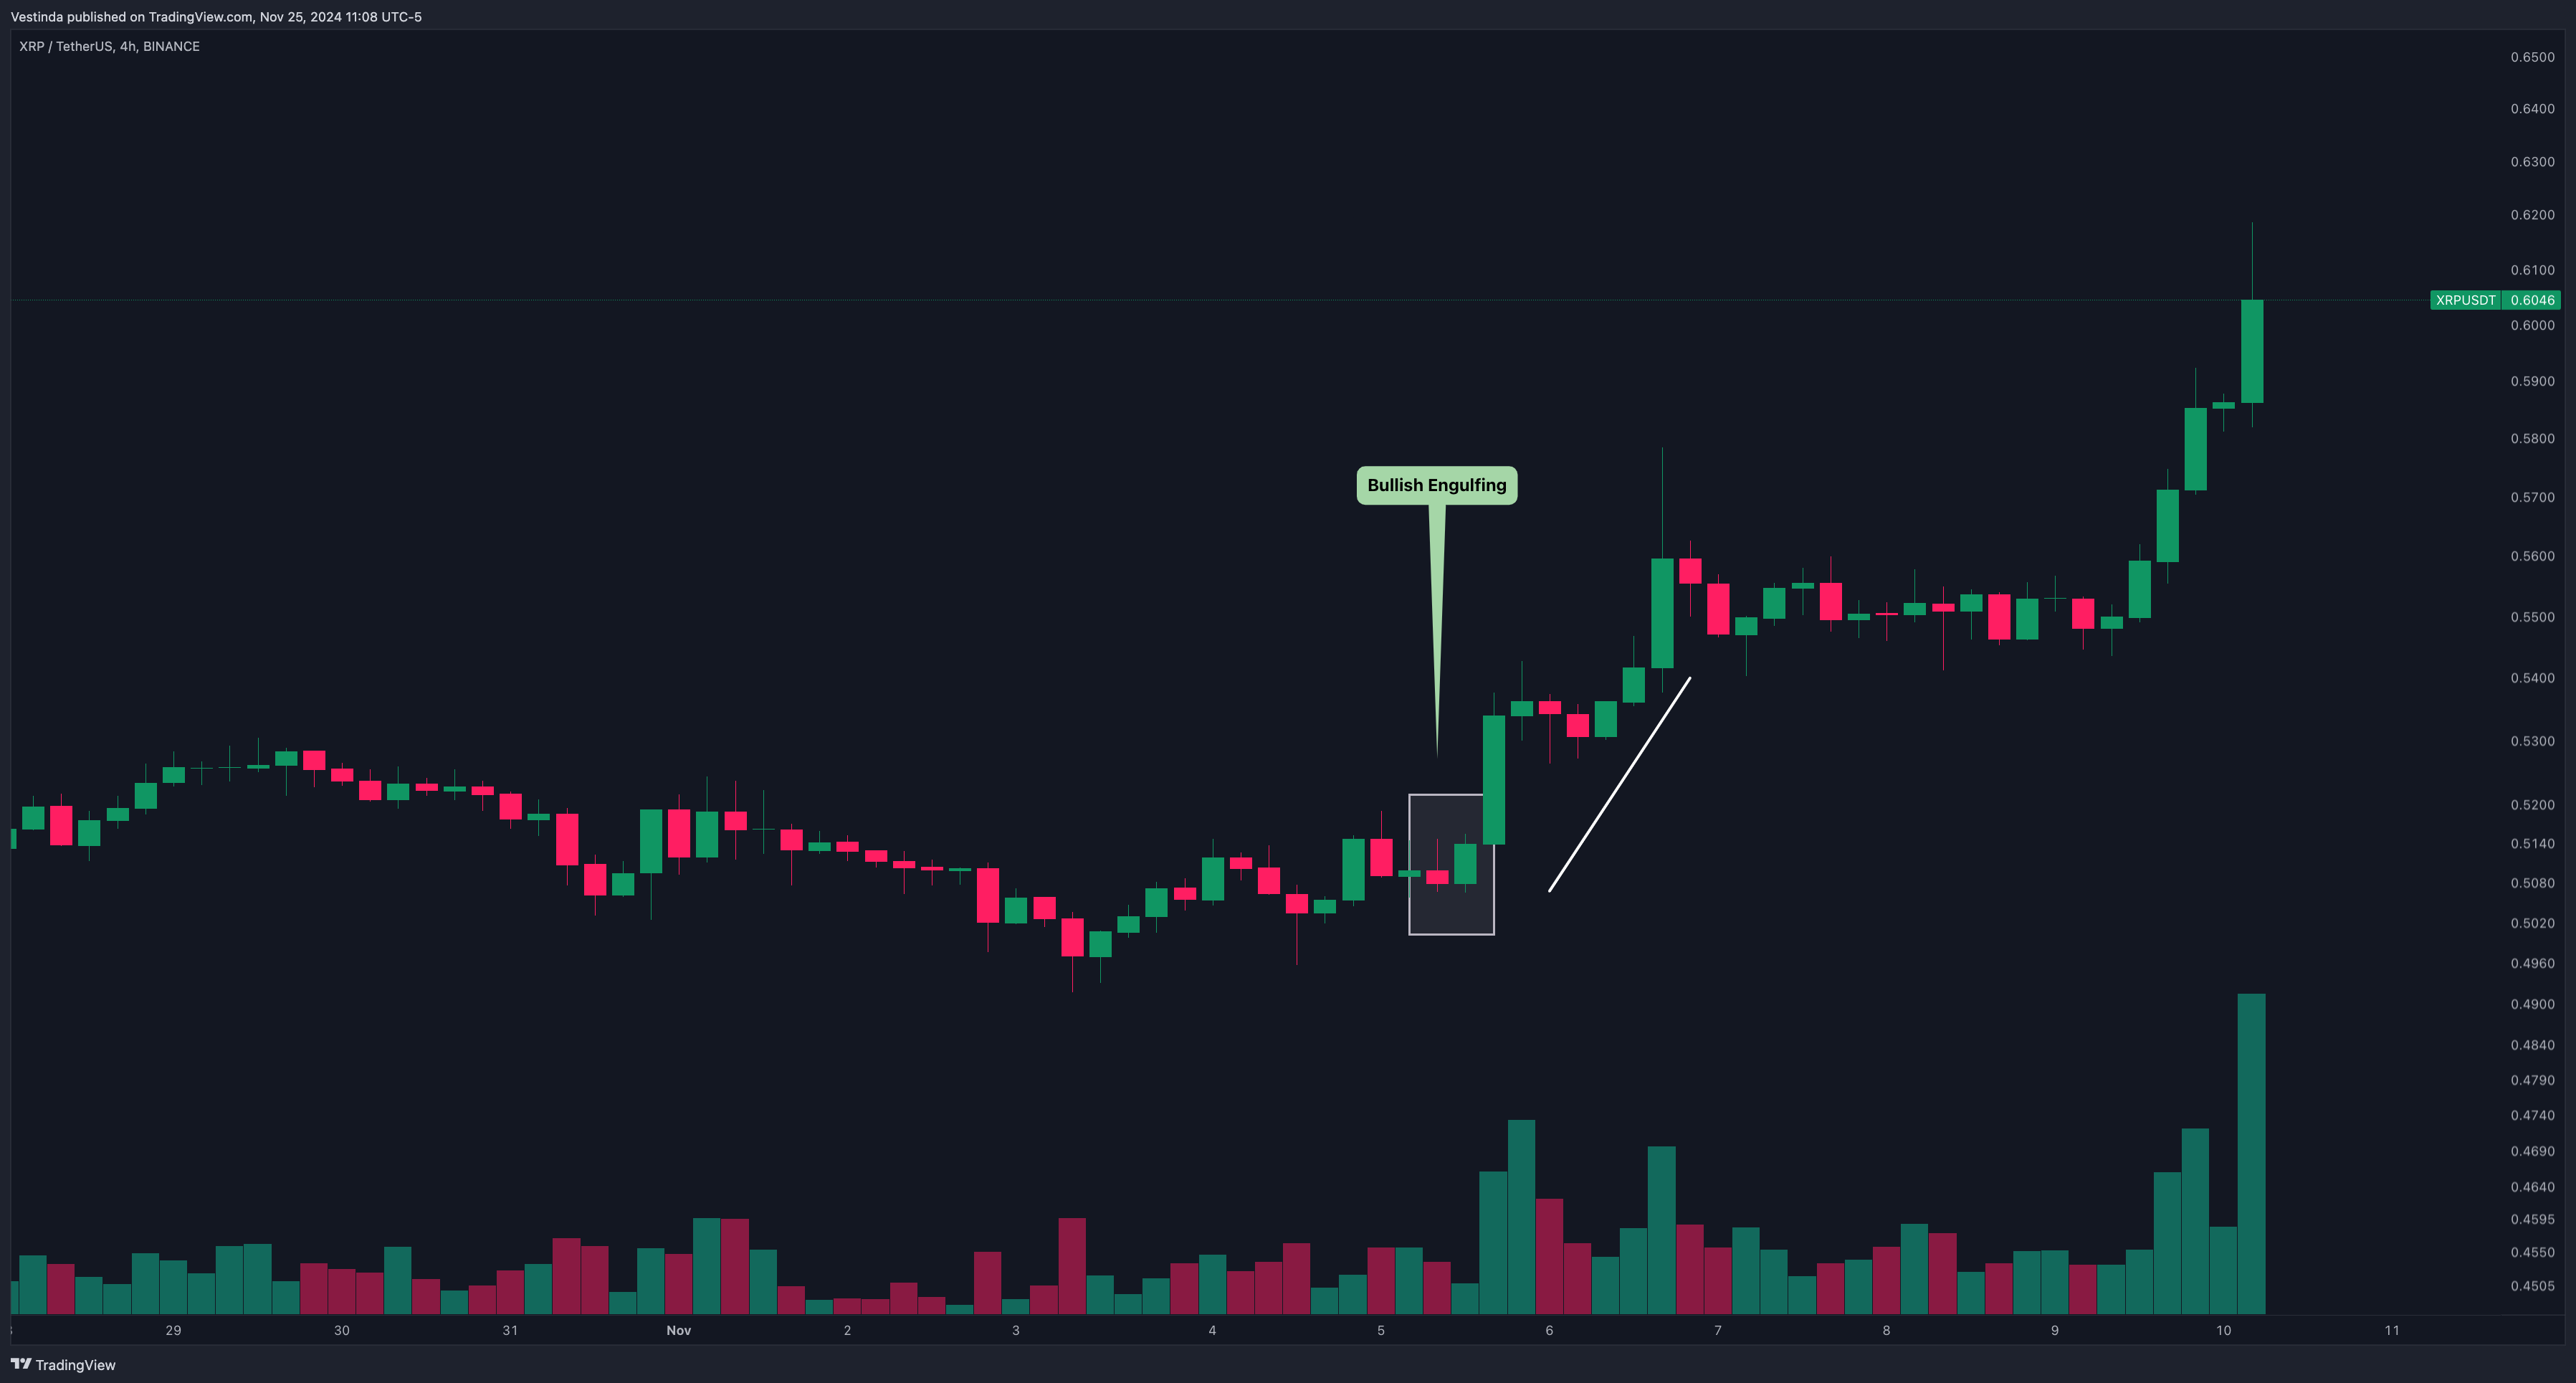
Example: On an XRP 4H chart, a bullish engulfing pattern near a support level often precedes upward price movement.
2. Morning Star
Description: A three-candle pattern with a long red candle, a small-bodied candle (indicating indecision), and a strong green candle.
What It Indicates: A potential reversal from bearish to bullish momentum.
Tip: Combine with RSI to confirm oversold conditions for stronger signals.
3. Hammer
Description: A single candle with a small body and a long lower shadow.
What It Indicates: Buyers stepping in after a sell-off, often signaling a reversal.
Tip: Look for hammers near XRP support levels to identify entry points.
Key Bearish Candlestick Patterns for XRP
1. Bearish Engulfing
Description: A smaller green candle is followed by a larger red candle that completely engulfs it.
What It Indicates: Increased selling pressure, signaling a potential reversal from an uptrend.

Example: Spot bearish engulfing patterns on XRP daily charts near resistance levels.
2. Evening Star
Description: A three-candle pattern with a long green candle, a small-bodied candle, and a strong red candle.
What It Indicates: A potential shift from bullish to bearish sentiment.
Tip: Confirm with MACD showing bearish divergence for more reliability.
3. Shooting Star
Description: A single candle with a small body and a long upper shadow.
What It Indicates: Rejection at higher levels, signaling a bearish reversal.
Example: Look for shooting stars during XRP price rallies to anticipate corrections.
Combination Patterns for XRP Trading
1. Double Bottom with Bullish Patterns
How It Works: Combine a bullish candlestick pattern (e.g., hammer) at the second bottom of a double-bottom formation for stronger confirmation.
Example: Use on 1H or 4H charts to capture trend reversals in XRP.
2. Breakout Confirmation
How It Works: Use bullish or bearish engulfing patterns near support or resistance breakouts to confirm trade entries.
Example: Enter long after a bullish engulfing pattern during a breakout above XRP’s resistance.
Practical Tips for Using Candlestick Patterns
- Combine with Indicators: Enhance accuracy by pairing candlestick patterns with RSI, MACD, or volume analysis.
- Look for Context: Patterns near key support/resistance levels or Fibonacci retracements are more reliable.
- Avoid Overtrading: Not every pattern guarantees success; always wait for confirmation.
- Use Multiple Timeframes: Check patterns on longer timeframes for trend direction and shorter ones for precise entry points.
Backtesting XRP Candlestick Patterns
1. Purpose
Evaluate the reliability of candlestick patterns on historical XRP data.
2. Tools
Platforms like TradingView for visual backtesting.
3. Metrics to Track
- Win rate, risk/reward ratio, and average return per trade.
Conclusion
Mastering candlestick patterns can significantly enhance your XRP trading strategies, providing early insights into potential price movements. By understanding bullish and bearish patterns, combining them with technical indicators, and validating them through backtesting, traders can achieve consistent success in Ripple’s dynamic market.
Ripple's Candlestick Patterns: XRP Trading Strategies
- Begin by familiarizing yourself with different candlestick patterns and their meanings.
- Using a reliable trading platform, open a chart for XRP (Ripple) and select a suitable time frame.
- Observe the candlestick formations on the chart and identify potential patterns.
- Confirm the patterns by analyzing the candlestick's body, wicks, and their position relative to the trend.
- Make trading decisions based on the reliable candlestick patterns that indicate bullish or bearish signals.
- Set stop-loss orders to manage risk and secure potential profits on your trades.
- Regularly review your trading strategy and refine it based on the effectiveness of candlestick patterns.
Ripple Volatility: Illuminating XRP with Candlestick Patterns
Candlestick patterns can be instrumental in predicting the volatility of XRP. These patterns, derived from the movement of prices over a given period of time, can provide insights into market sentiment and price fluctuations. By analyzing the shape, size, and position of candlestick patterns, traders can make more informed decisions about the future direction of XRP's volatility. Whether it's a bullish engulfing pattern or a bearish harami, these patterns can offer valuable clues about potential price movements. However, it is important to remember that candlestick patterns are not foolproof indicators and should be used in conjunction with other technical analysis tools and market research. With the right interpretation and analysis, candlestick patterns can be a useful tool for XRP traders seeking to predict and capitalize on volatility.
XRP Trend Gauge with Candlestick Patterns
Using candlestick patterns for XRP trend strength analysis is a valuable technique for traders. These patterns provide visual representations of price data, allowing investors to identify potential reversals and trends. By analyzing XRP candlestick patterns, traders can determine the strength of the current market trend and make informed trading decisions. For example, a long bullish candlestick pattern may indicate a strong uptrend, while a long bearish pattern suggests a potential downtrend. By combining candlestick patterns with other technical indicators, traders can further enhance their analysis and increase the accuracy of their predictions. Therefore, incorporating candlestick patterns into XRP trend strength analysis can be a powerful tool for investors seeking to optimize their trading strategies.
"Bearish Harami Pattern: XRP's Downward Signal"
The Bearish Harami Pattern is a candlestick pattern that suggests a potential reversal in the price of XRP. It occurs when a smaller bullish candle is engulfed by a larger bearish candle. This pattern indicates that buying pressure has weakened and selling pressure may be increasing. Traders often see the Bearish Harami Pattern as a signal to take a bearish stance, possibly opening short positions or selling existing positions. However, it is important to note that this pattern alone does not guarantee a reversal in price. Traders should use other technical indicators and confirmatory signals to make well-informed trading decisions.
XRP: Exploring Mastery in Momentum Trading
The Rising and Falling Three Methods is a continuation pattern often observed in technical analysis of stock price charts. It consists of a series of five candlesticks that suggest a temporary interruption in the prevailing trend.
The pattern can be either bullish or bearish, depending on whether it occurs during an uptrend or a downtrend, respectively. In a rising three methods pattern, the first candlestick is a long bullish one, followed by three small, bearish candles. The fifth and final candle is another long bullish one. This pattern indicates that the market is taking a breather before continuing its upward movement.
Conversely, in a falling three methods pattern, the first candlestick is a long bearish one, followed by three small, bullish candles. The fifth candle is another long bearish one. This pattern suggests a temporary pause in a downtrend before the market resumes its downward movement.
Traders and investors often look for these patterns as they can provide valuable insights into future price movements.
Sophisticated backtesting is not only possession of high-esteemed hedge funds anymore.
Impressive Team and support, Backtesting engine with detailed reports, The Strategy builder.

Great purchase!
I have always manually invested in stocks and cryptocurrencies, but after studying Vestinda, I must say it has enormous potential.

Mature platform for trading
Pro: Easy to use, Nice UX, A lot of customization for strategies, Back testing is an awesome tool, can check any strategy in history.

Frequently Asked Questions
To recognize a bearish harami pattern on a candlestick chart, look for a small bullish candlestick followed by a larger bearish candlestick. The bearish candlestick should have a body that is completely engulfed within the body of the previous bullish candlestick. This indicates a potential reversal in the prevailing bullish trend, as the bearish harami suggests a period of indecision or weakening momentum. It is important to further confirm this pattern with other technical indicators or analysis before making any trading decisions.
Reading candles for beginners involves understanding the basic elements of a candlestick chart. Each candle represents a specific time period and displays the open, close, high, and low prices within that timeframe. A bullish (green) candle indicates an upward movement in price, while a bearish (red) candle suggests a downward movement. The body of the candle shows the opening and closing prices, while the upper and lower shadows represent the price range during that time. Analyzing patterns and formations formed by these candles can provide insights into market sentiment and potential future price movements. Practice and further education can enhance candle reading skills.
To use candlestick patterns in conjunction with moving averages, firstly, identify a strong trend using moving averages. Then, look for candlestick patterns that align with the trend, such as bullish engulfing patterns during an uptrend or bearish engulfing patterns during a downtrend. These patterns can offer confirmation of trend direction and potential entry or exit signals. Additionally, if a candlestick pattern forms near a moving average, it can act as a support or resistance level, providing further insight into potential price reversals or continuations. Combining candlestick patterns with moving averages can enhance trading decisions and improve overall accuracy.
A spinning top candlestick in trading represents indecision between buyers and sellers. It is characterized by a small body with upper and lower shadows of similar length. The formation indicates a balance between bullish and bearish forces. Traders interpret this candlestick pattern as a potential reversal signal. It suggests that the prevailing trend may be weakening, and a shift in market sentiment is possible. Nevertheless, confirmation from subsequent price action is necessary to make informed trading decisions based on the spinning top candlestick.
Yes, candlestick patterns can be used to identify trend exhaustion in the financial markets. Examples of such patterns include the bearish engulfing pattern, shooting star, and evening star. These patterns typically occur after a prolonged uptrend, signaling potential exhaustion and a possible trend reversal. Traders and investors often look for these candlestick patterns to help them make informed decisions about exiting positions or considering a counter-trend strategy. However, it is important to note that candlestick patterns should be used in conjunction with other technical analysis tools for more accurate trend exhaustion identification.
Conclusion
In conclusion, understanding and utilizing XRP (Ripple) Candlestick Patterns can greatly enhance your decision-making process in the dynamic cryptocurrency market. These patterns provide valuable insights into market sentiment and help traders identify potential entry and exit points. By familiarizing yourself with different candlestick patterns and their meanings, analyzing formations, and confirming patterns, you can make more informed trading decisions. However, it is important to remember that candlestick patterns should be used in conjunction with other technical analysis tools and market research. With the right interpretation and analysis, candlestick patterns can be a useful tool for XRP traders seeking to predict and capitalize on market volatility.

Successful traders rely on backtesting to be profitable.
Be like them with our
Free Backtesting Guide