Sophisticated backtesting is not only possession of high-esteemed hedge funds anymore.
Impressive Team and support, Backtesting engine with detailed reports, The Strategy builder.

Great purchase!
I have always manually invested in stocks and cryptocurrencies, but after studying Vestinda, I must say it has enormous potential.

Mature platform for trading
Pro: Easy to use, Nice UX, A lot of customization for strategies, Back testing is an awesome tool, can check any strategy in history.

Algorithmic Strategies & Backtesting results for XAU
Here are some XAU trading strategies along with their past performance. You can validate these strategies (and many more) for free on Vestinda across thousands of assets and many years of historical data.
Algorithmic Trading Strategy: Medium Term Investment on XAU
According to the backtesting results for the trading strategy from September 25, 2023, to October 25, 2023, the statistics reveal some positive outcomes. The strategy's profit factor stands at 1.67, indicating a favorable ratio between the gross profit and gross loss generated. The annualized return on investment (ROI) stands at 7.17%, suggesting a steady growth rate over a year. On average, the strategy holds positions for one day, indicating a short-term trading approach. With an average of 0.7 trades per week, the strategy is generating moderate trading activity. There were three closed trades during this period, resulting in a return on investment of 0.59%. Additionally, the strategy achieved a respectable winning trades percentage of 66.67%. These backtesting results suggest promising performance for the trading strategy during the specified period.

 XAUUSD

Choose another period and try again.
Algorithmic Trading Strategy: RAVI Reversals with Ichimoku Conversion and Shadows on XAU
During the backtesting period from October 25, 2022, to October 25, 2023, the trading strategy yielded a profit factor of 0.93, indicating that the strategy generated less profits than losses. The annualized return on investment (ROI) stood at -1.49%, implying a negative return over the period. The average holding time for trades was 1 day and 14 hours, suggesting a relatively short-term trading approach. With an average of 1.22 trades per week, the trading frequency was relatively low. The strategy executed a total of 64 closed trades. Of these trades, only 34.38% were winning trades, reflecting a lower success rate. Overall, the backtesting results indicate suboptimal performance for the trading strategy during this period.
XAUUSD
Choose another period and try again.
Gilded Candlestick Insights: Trading Patterns for XAU
- Learn and understand the basic candlestick patterns.
- Analyze the XAU chart to identify patterns such as doji, hammer, and engulfing.
- Confirm the pattern by checking if it appears at a key support or resistance level.
- Consider the prevailing trend and the volume of trading activity.
- Place a buy or sell order based on the pattern and its implications.
- Set a stop-loss order to limit potential losses.
- Monitor the trade and adjust the stop-loss or take-profit levels if necessary.
Profitable Candlestick Patterns for Trading XAUUSD
Gold (XAUUSD) is a favored instrument among traders, known for its safe-haven status and volatility during market uncertainties. One of the most effective ways to trade XAUUSD is by using candlestick patterns, which provide visual cues about market sentiment and potential reversals. In this guide, we’ll explore profitable candlestick patterns for trading XAUUSD, helping you gain an edge in the market and make informed trading decisions.
Why Use Candlestick Patterns for XAUUSD?
- Market Sentiment Insight: Candlestick patterns reveal shifts in market sentiment, giving early signals of trend reversals or continuations.
- Universal Application: These patterns can be applied across various timeframes, making them suitable for both short-term and long-term trading.
- Easy to Identify: Recognizing key candlestick patterns requires practice, but once mastered, they provide reliable trading signals.
Key Profitable XAUUSD Candlestick Patterns
Bullish Engulfing Pattern
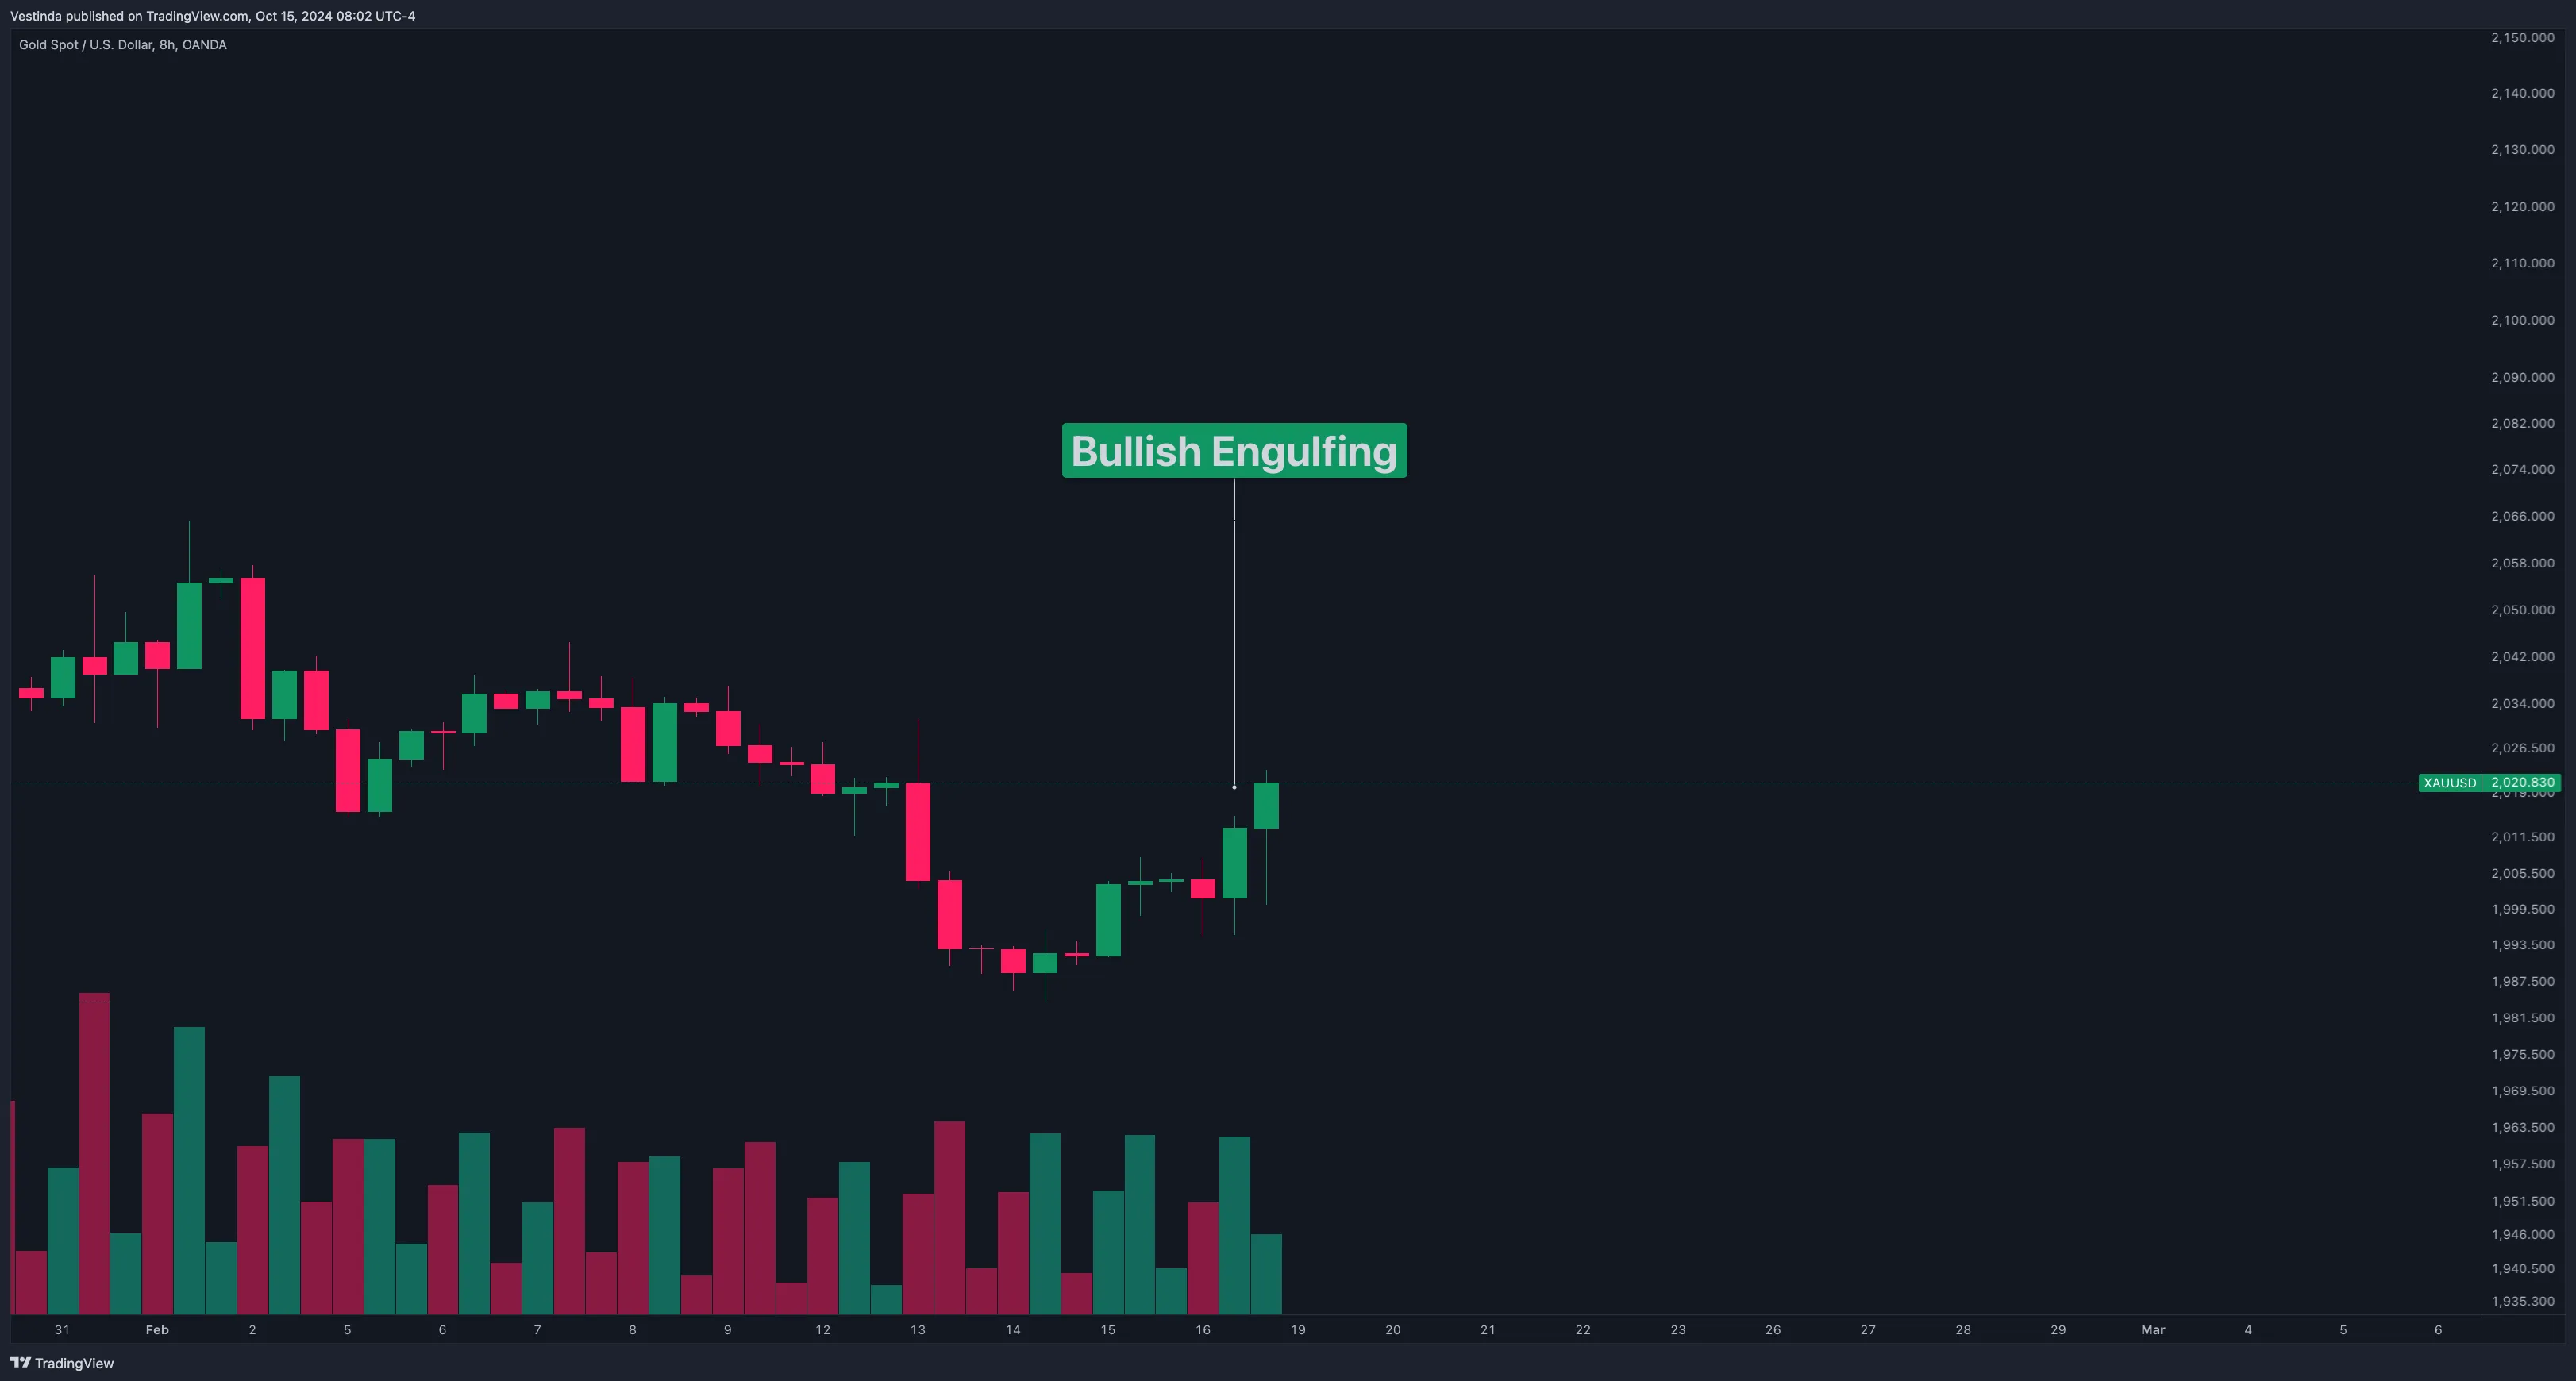
Concept: A reversal pattern that indicates a potential shift from a downtrend to an uptrend.
How to Identify: A smaller bearish candle is followed by a larger bullish candle that completely engulfs the previous candle’s body.
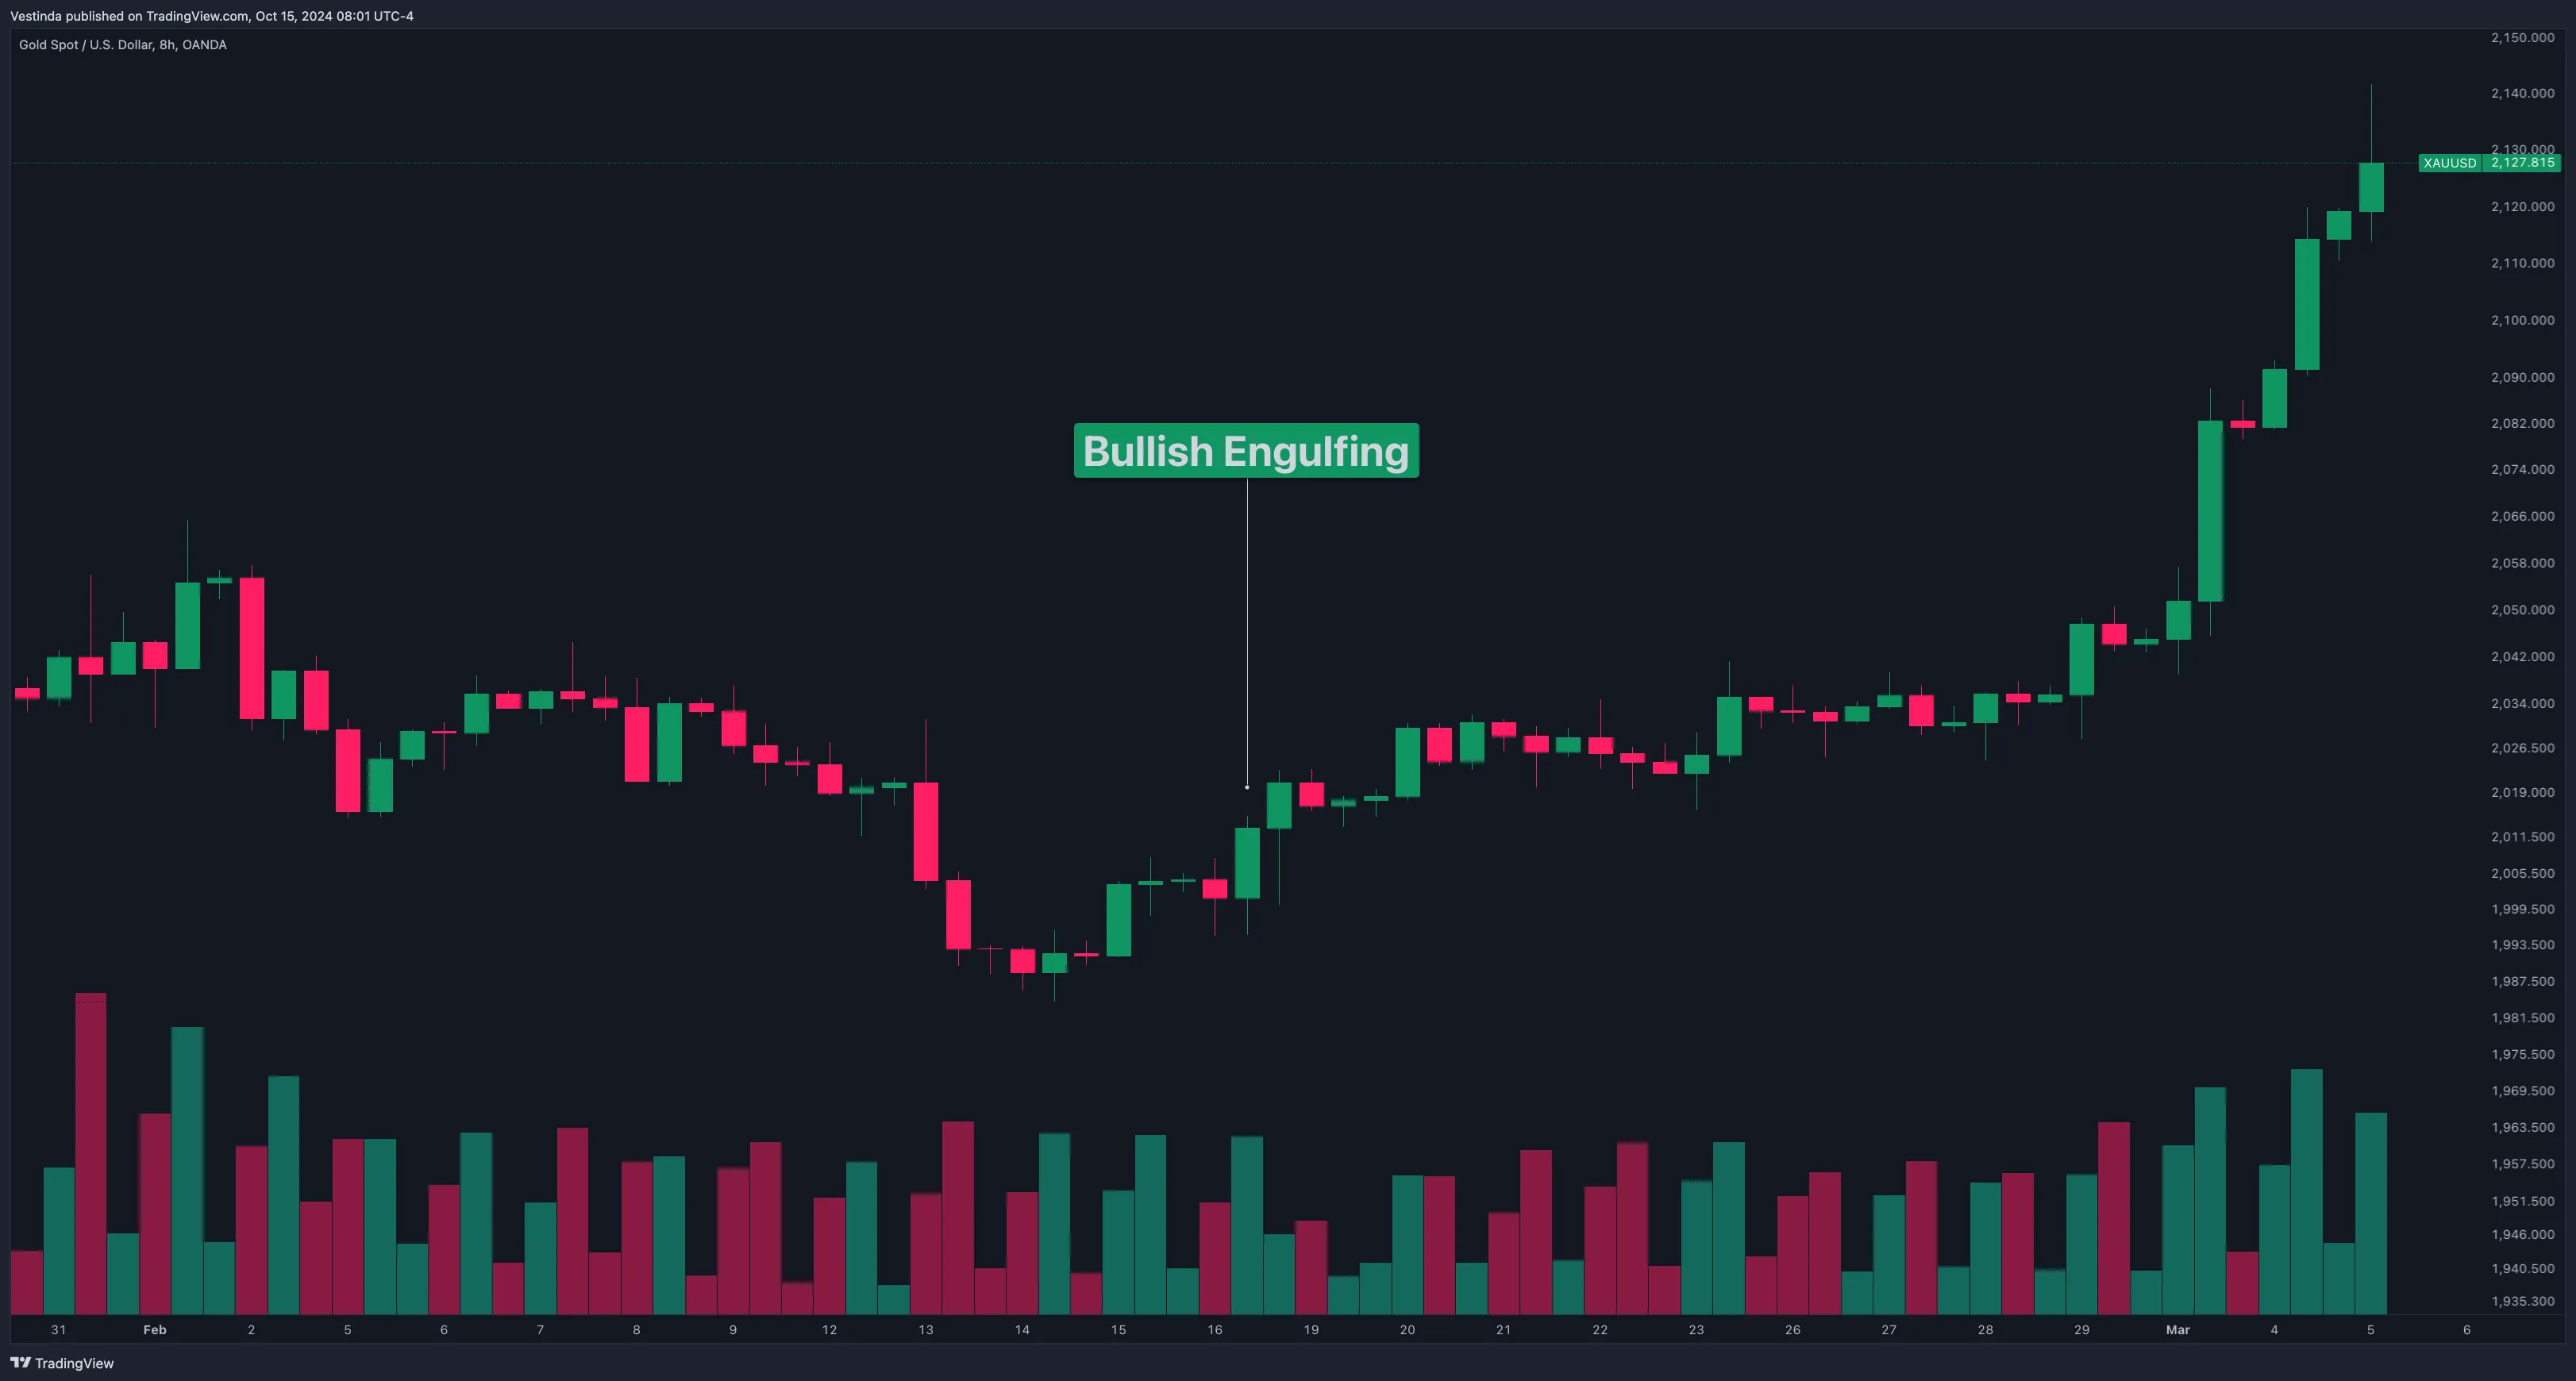
Entry and Exit: Enter a long position after the bullish engulfing candle closes. Set a stop-loss below the low of the pattern and take profit at the next resistance level.
Bearish Engulfing Pattern
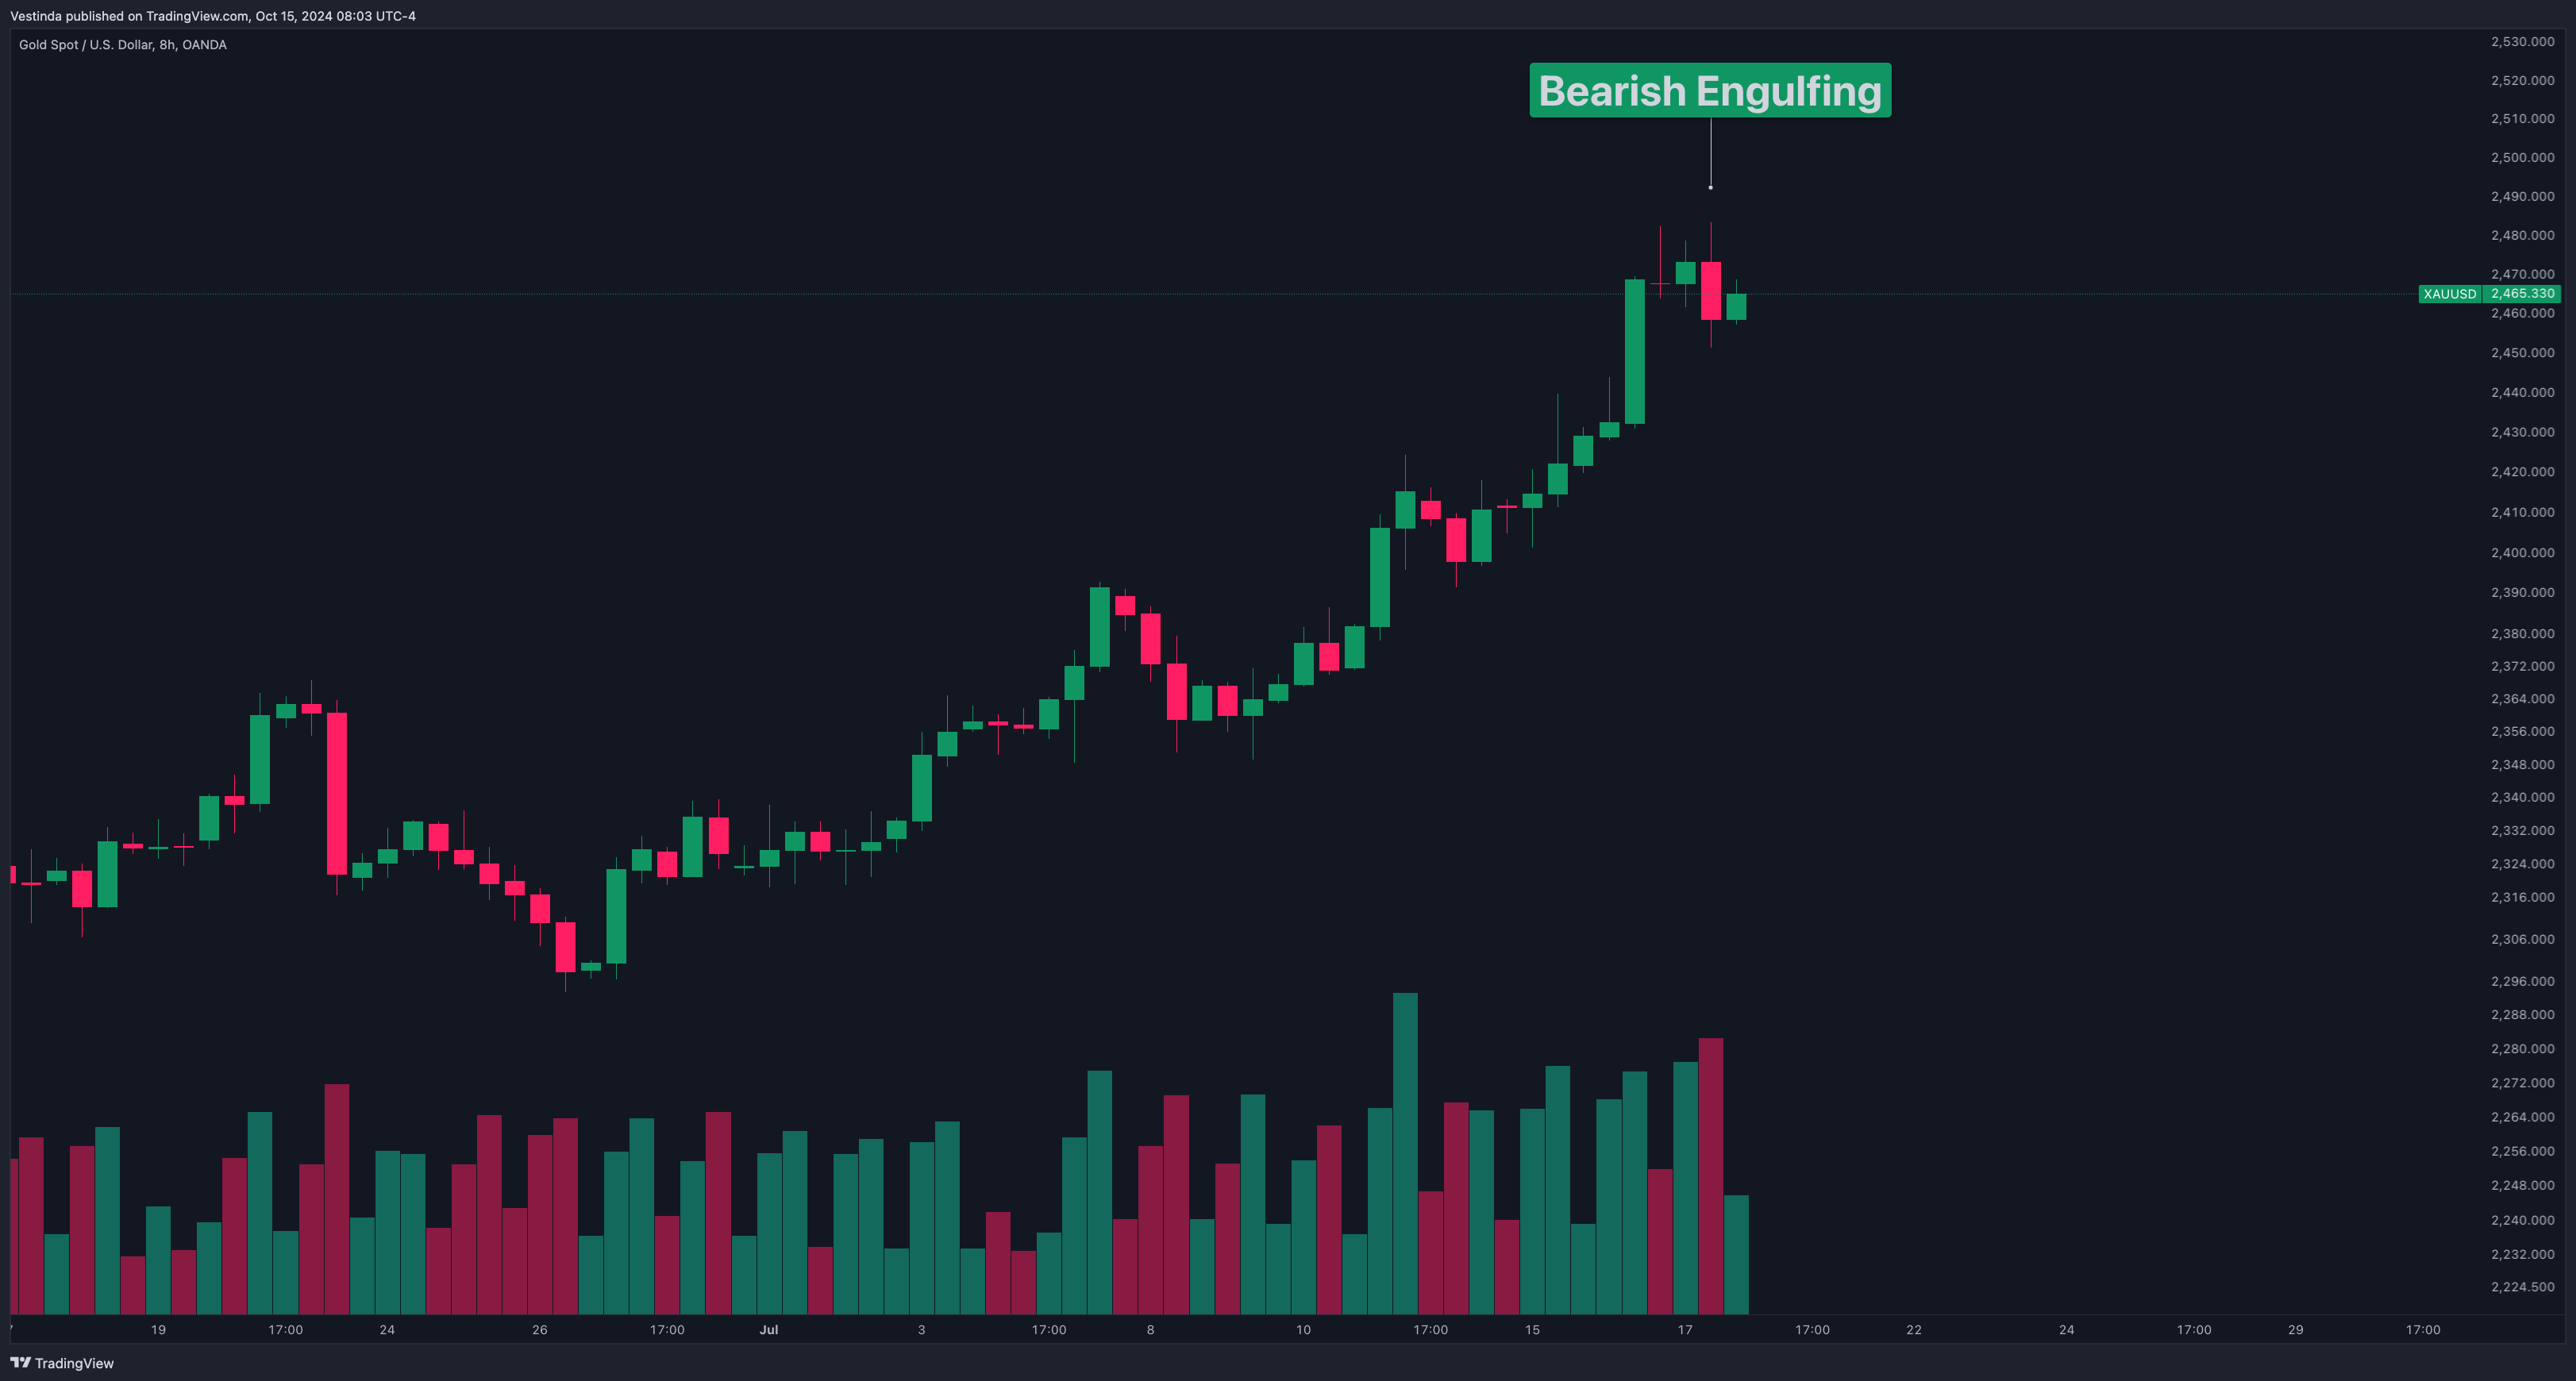
Concept: A reversal pattern that signals a potential shift from an uptrend to a downtrend.
How to Identify: A smaller bullish candle is followed by a larger bearish candle that completely engulfs the previous candle’s body.
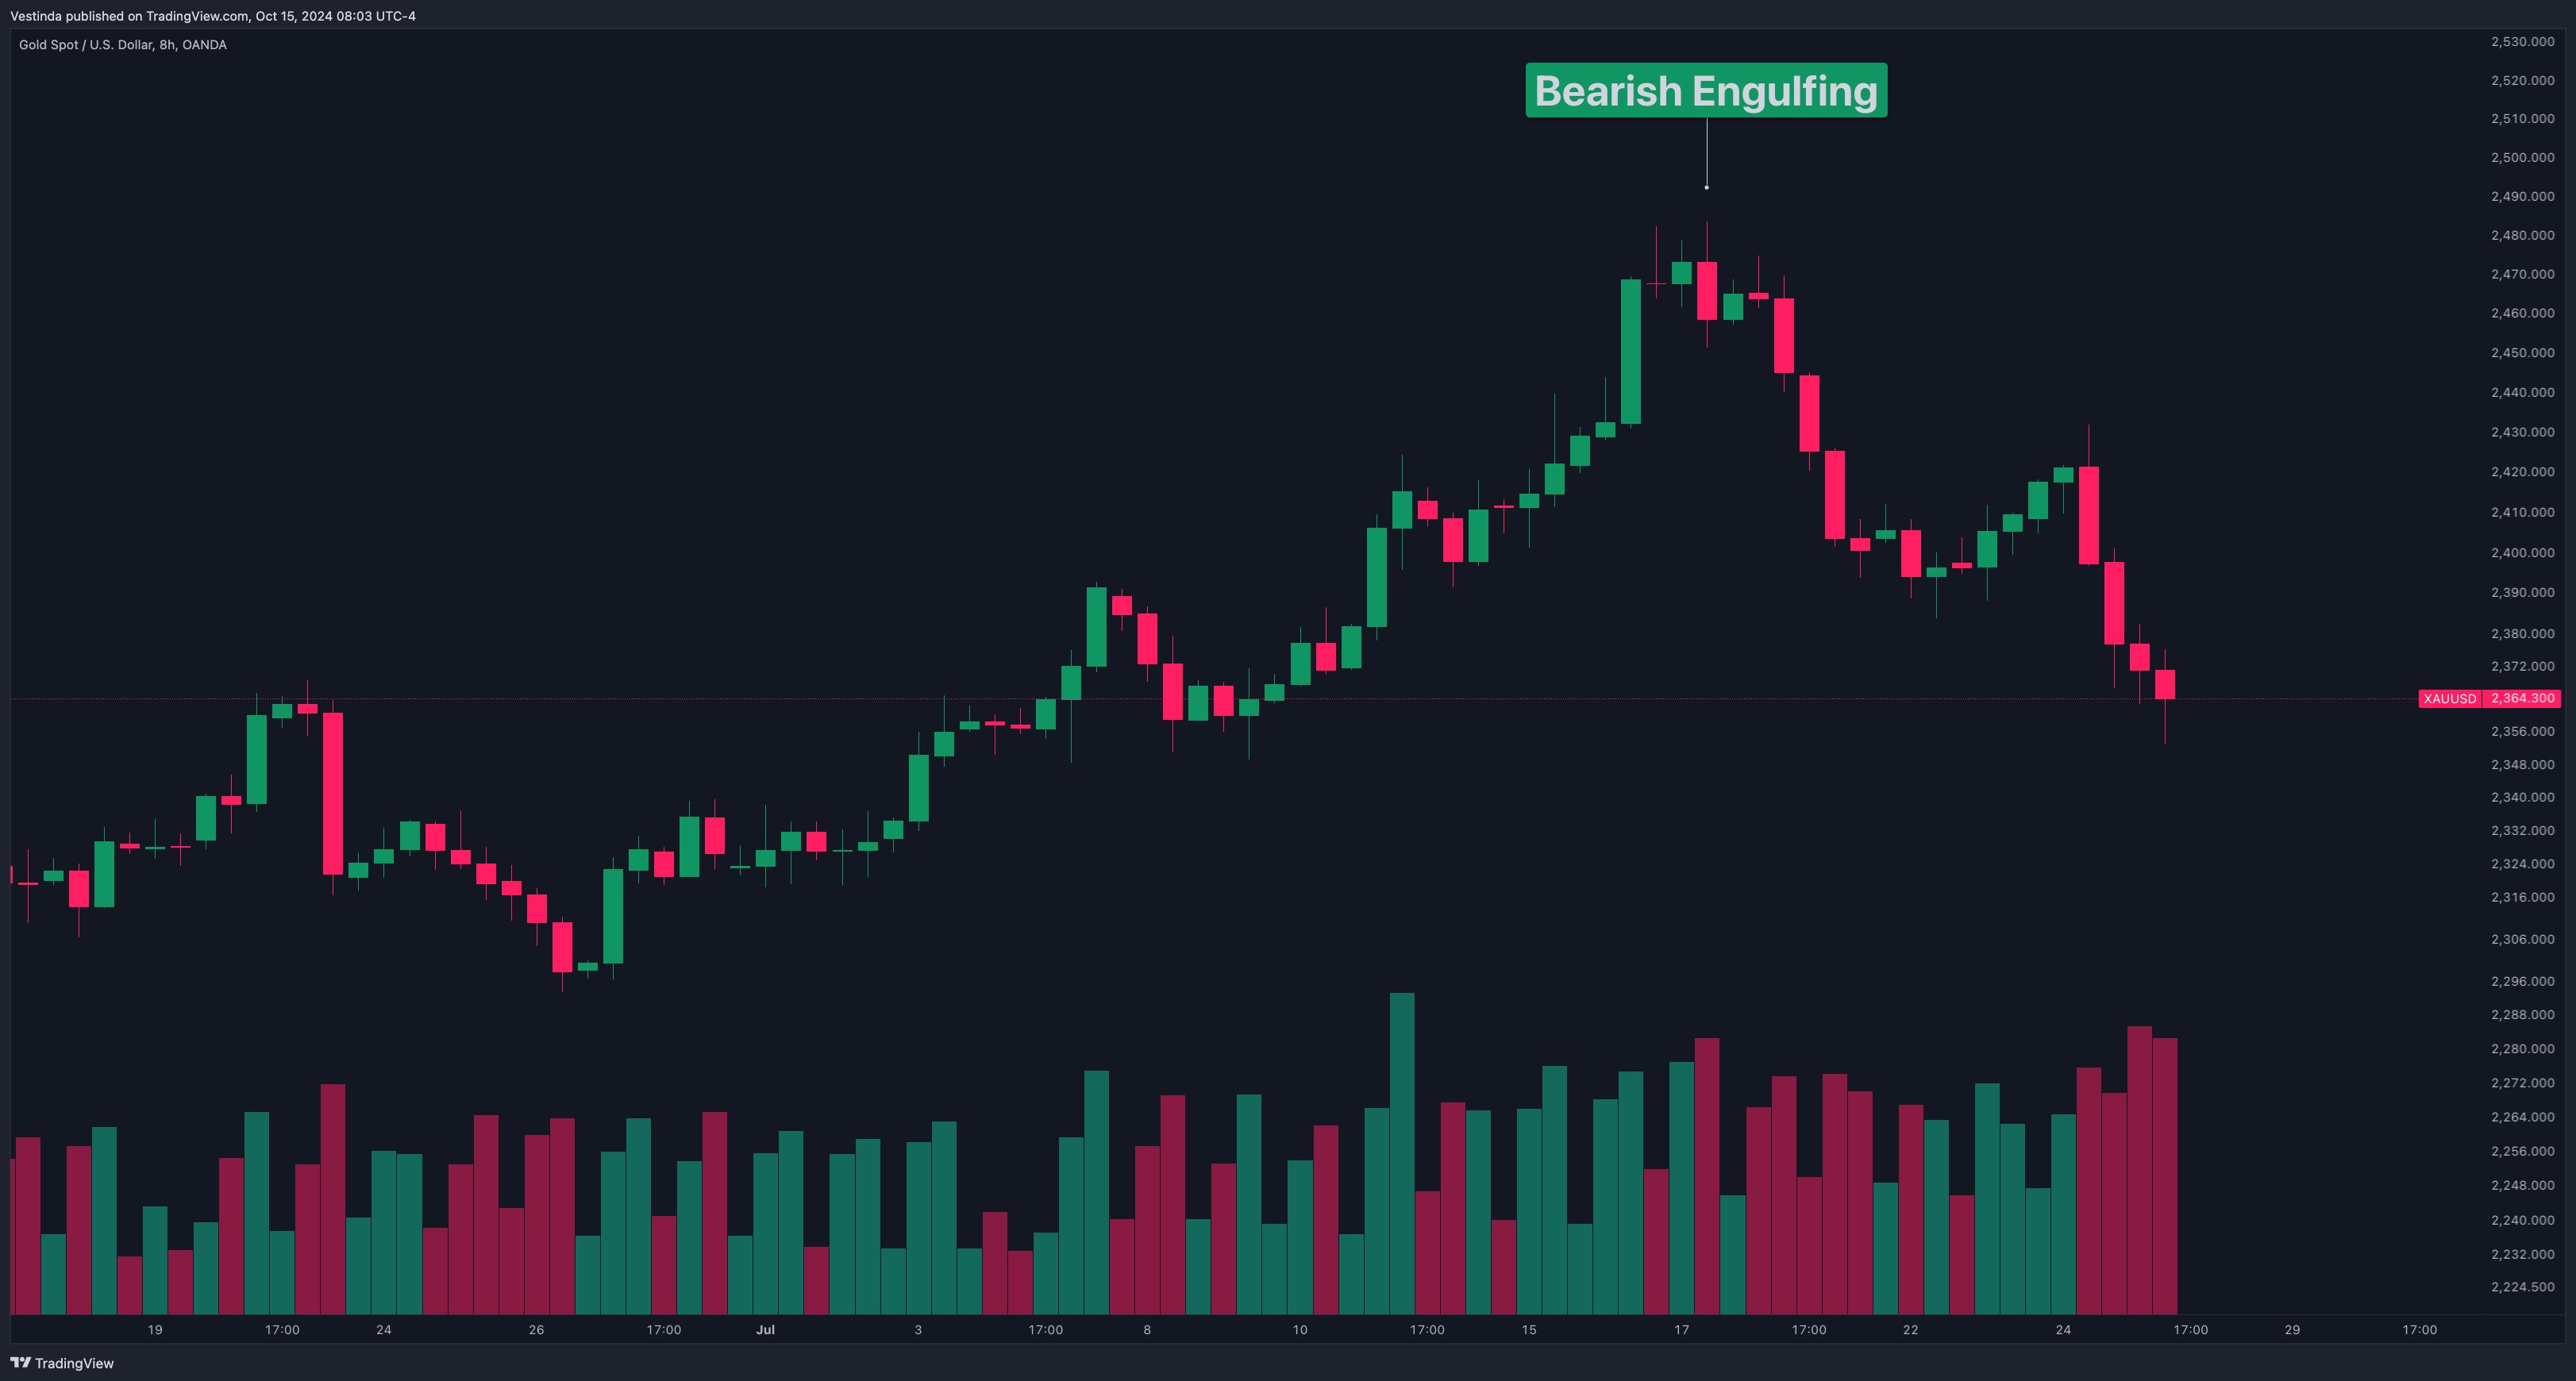
Entry and Exit: Enter a short position after the bearish engulfing candle closes. Set a stop-loss above the high of the pattern and take profit at the next support level.
Hammer and Inverted Hammer
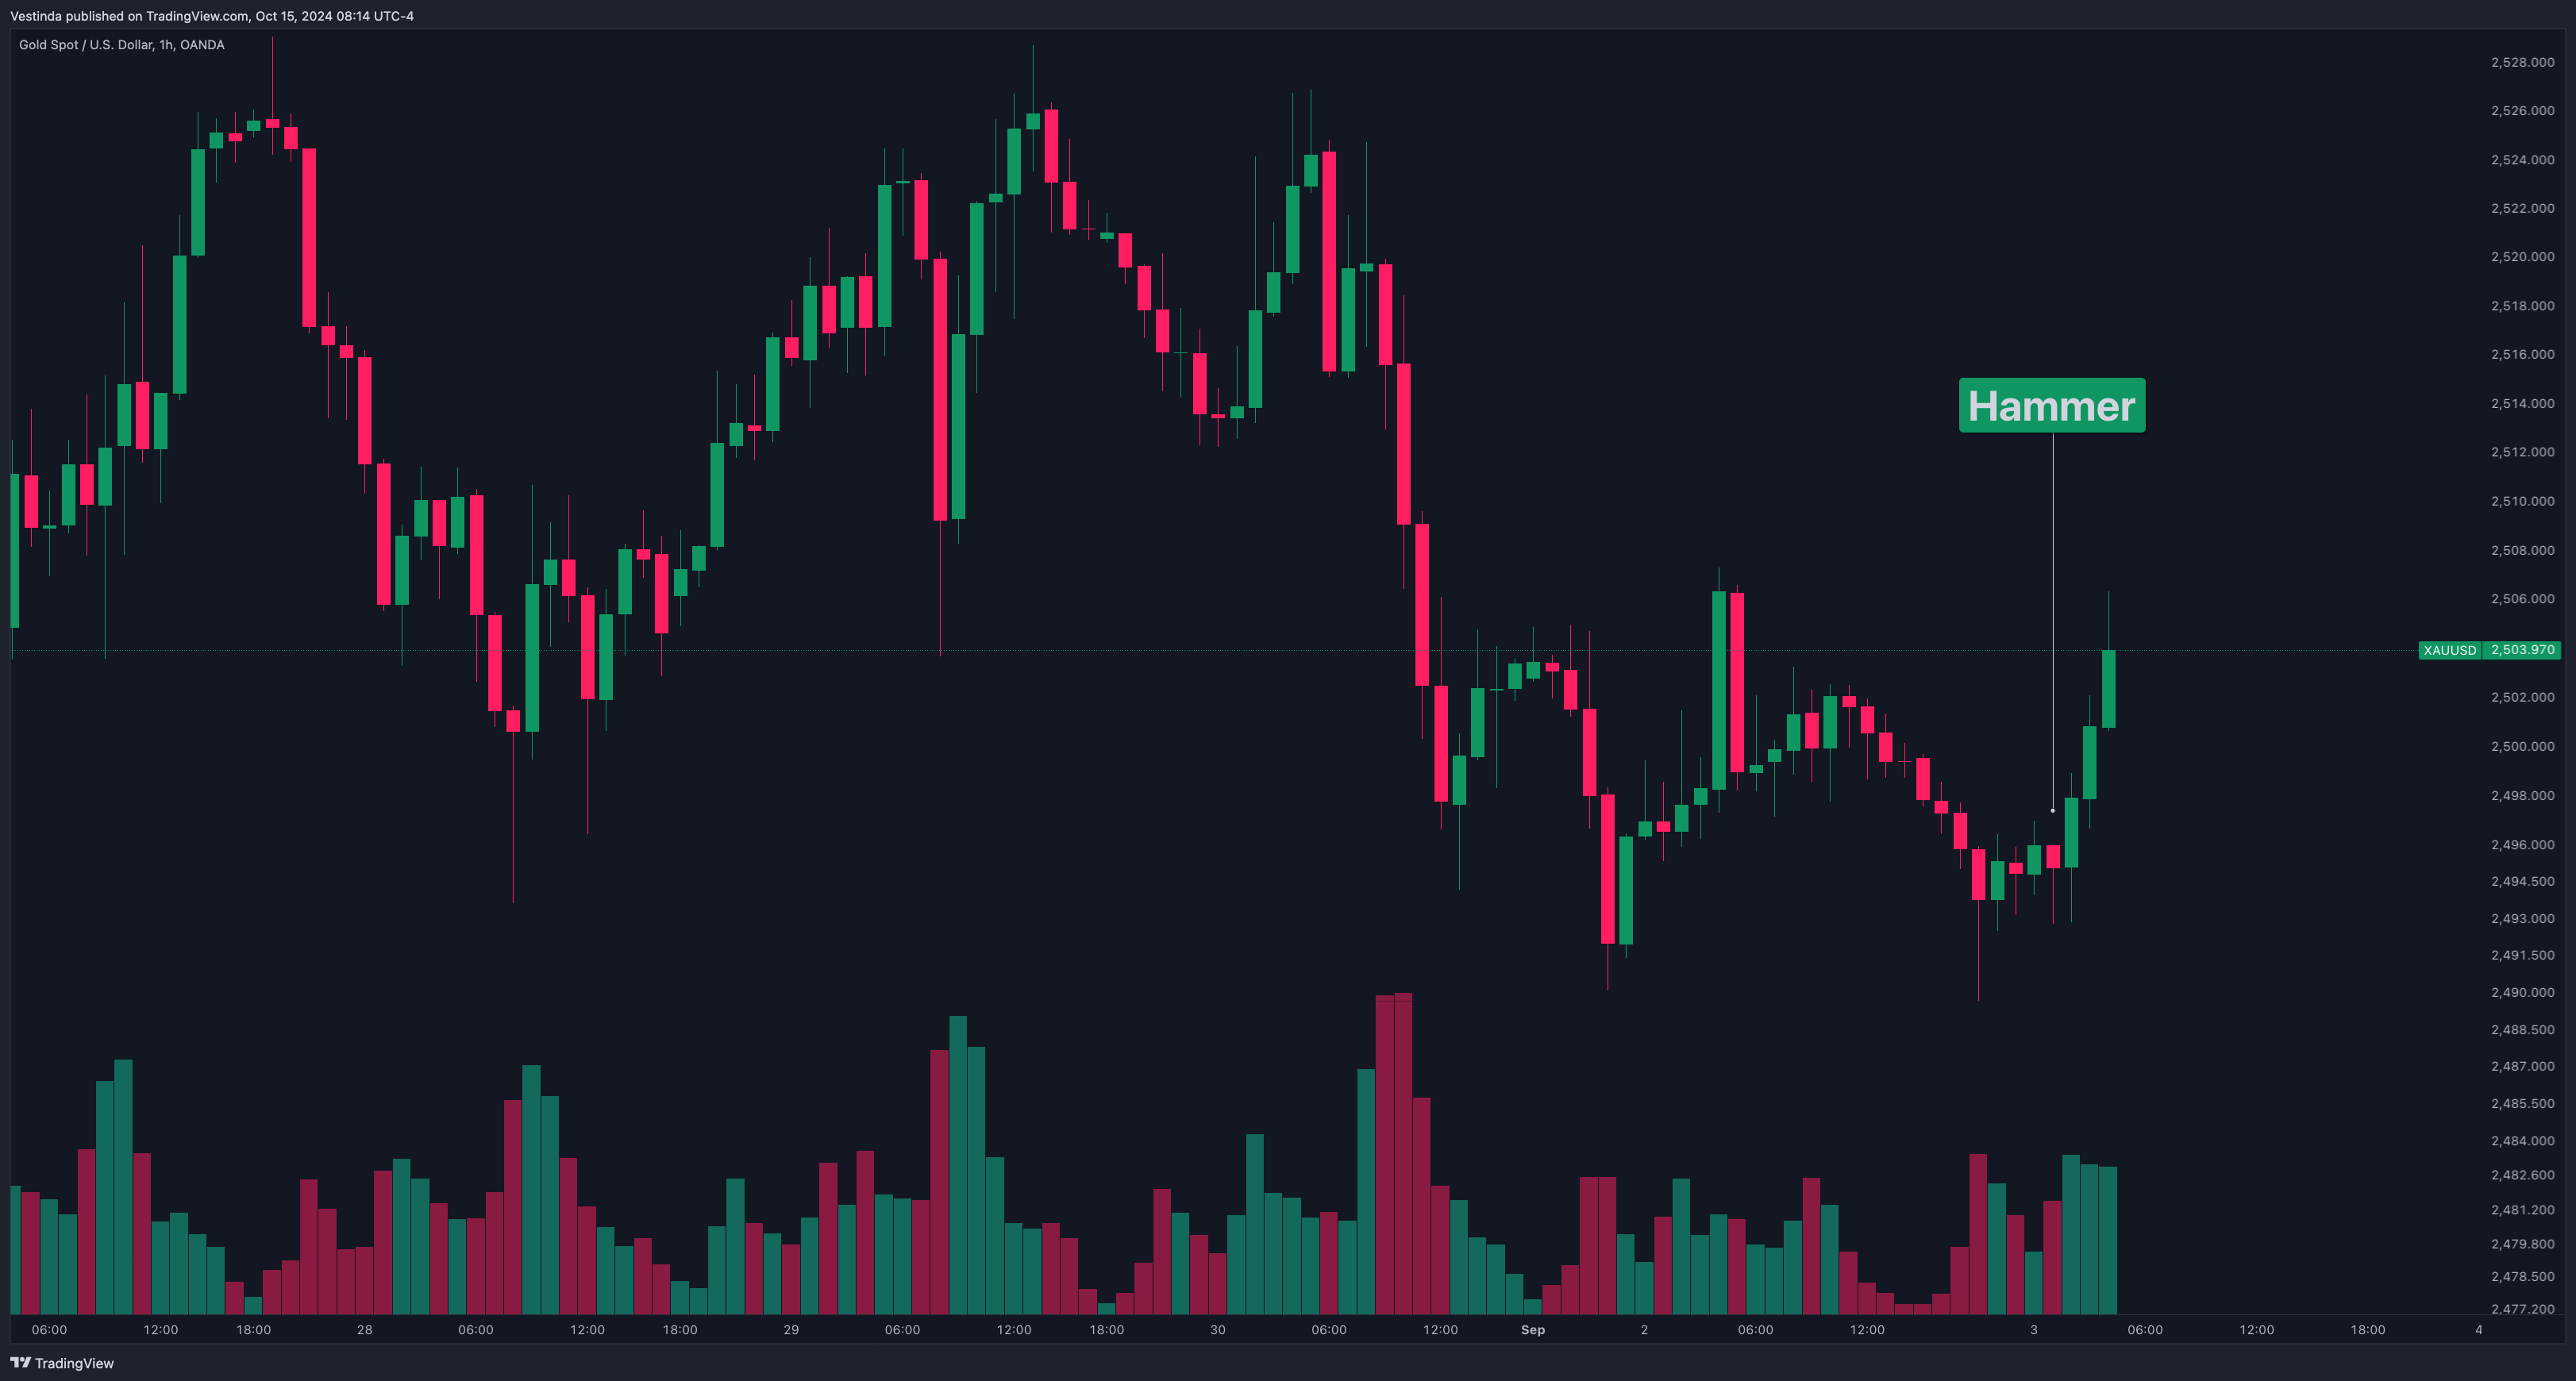
Concept: A hammer indicates a potential reversal from a downtrend, while the inverted hammer signals a reversal from an uptrend.
How to Identify: The candle has a small body with a long lower shadow (hammer) or upper shadow (inverted hammer).
Entry and Exit: For a hammer, enter a long position after the candle closes. For an inverted hammer, enter a short position. Use recent lows or highs for stop-loss placement.
Marubozu White and Marubozu Black
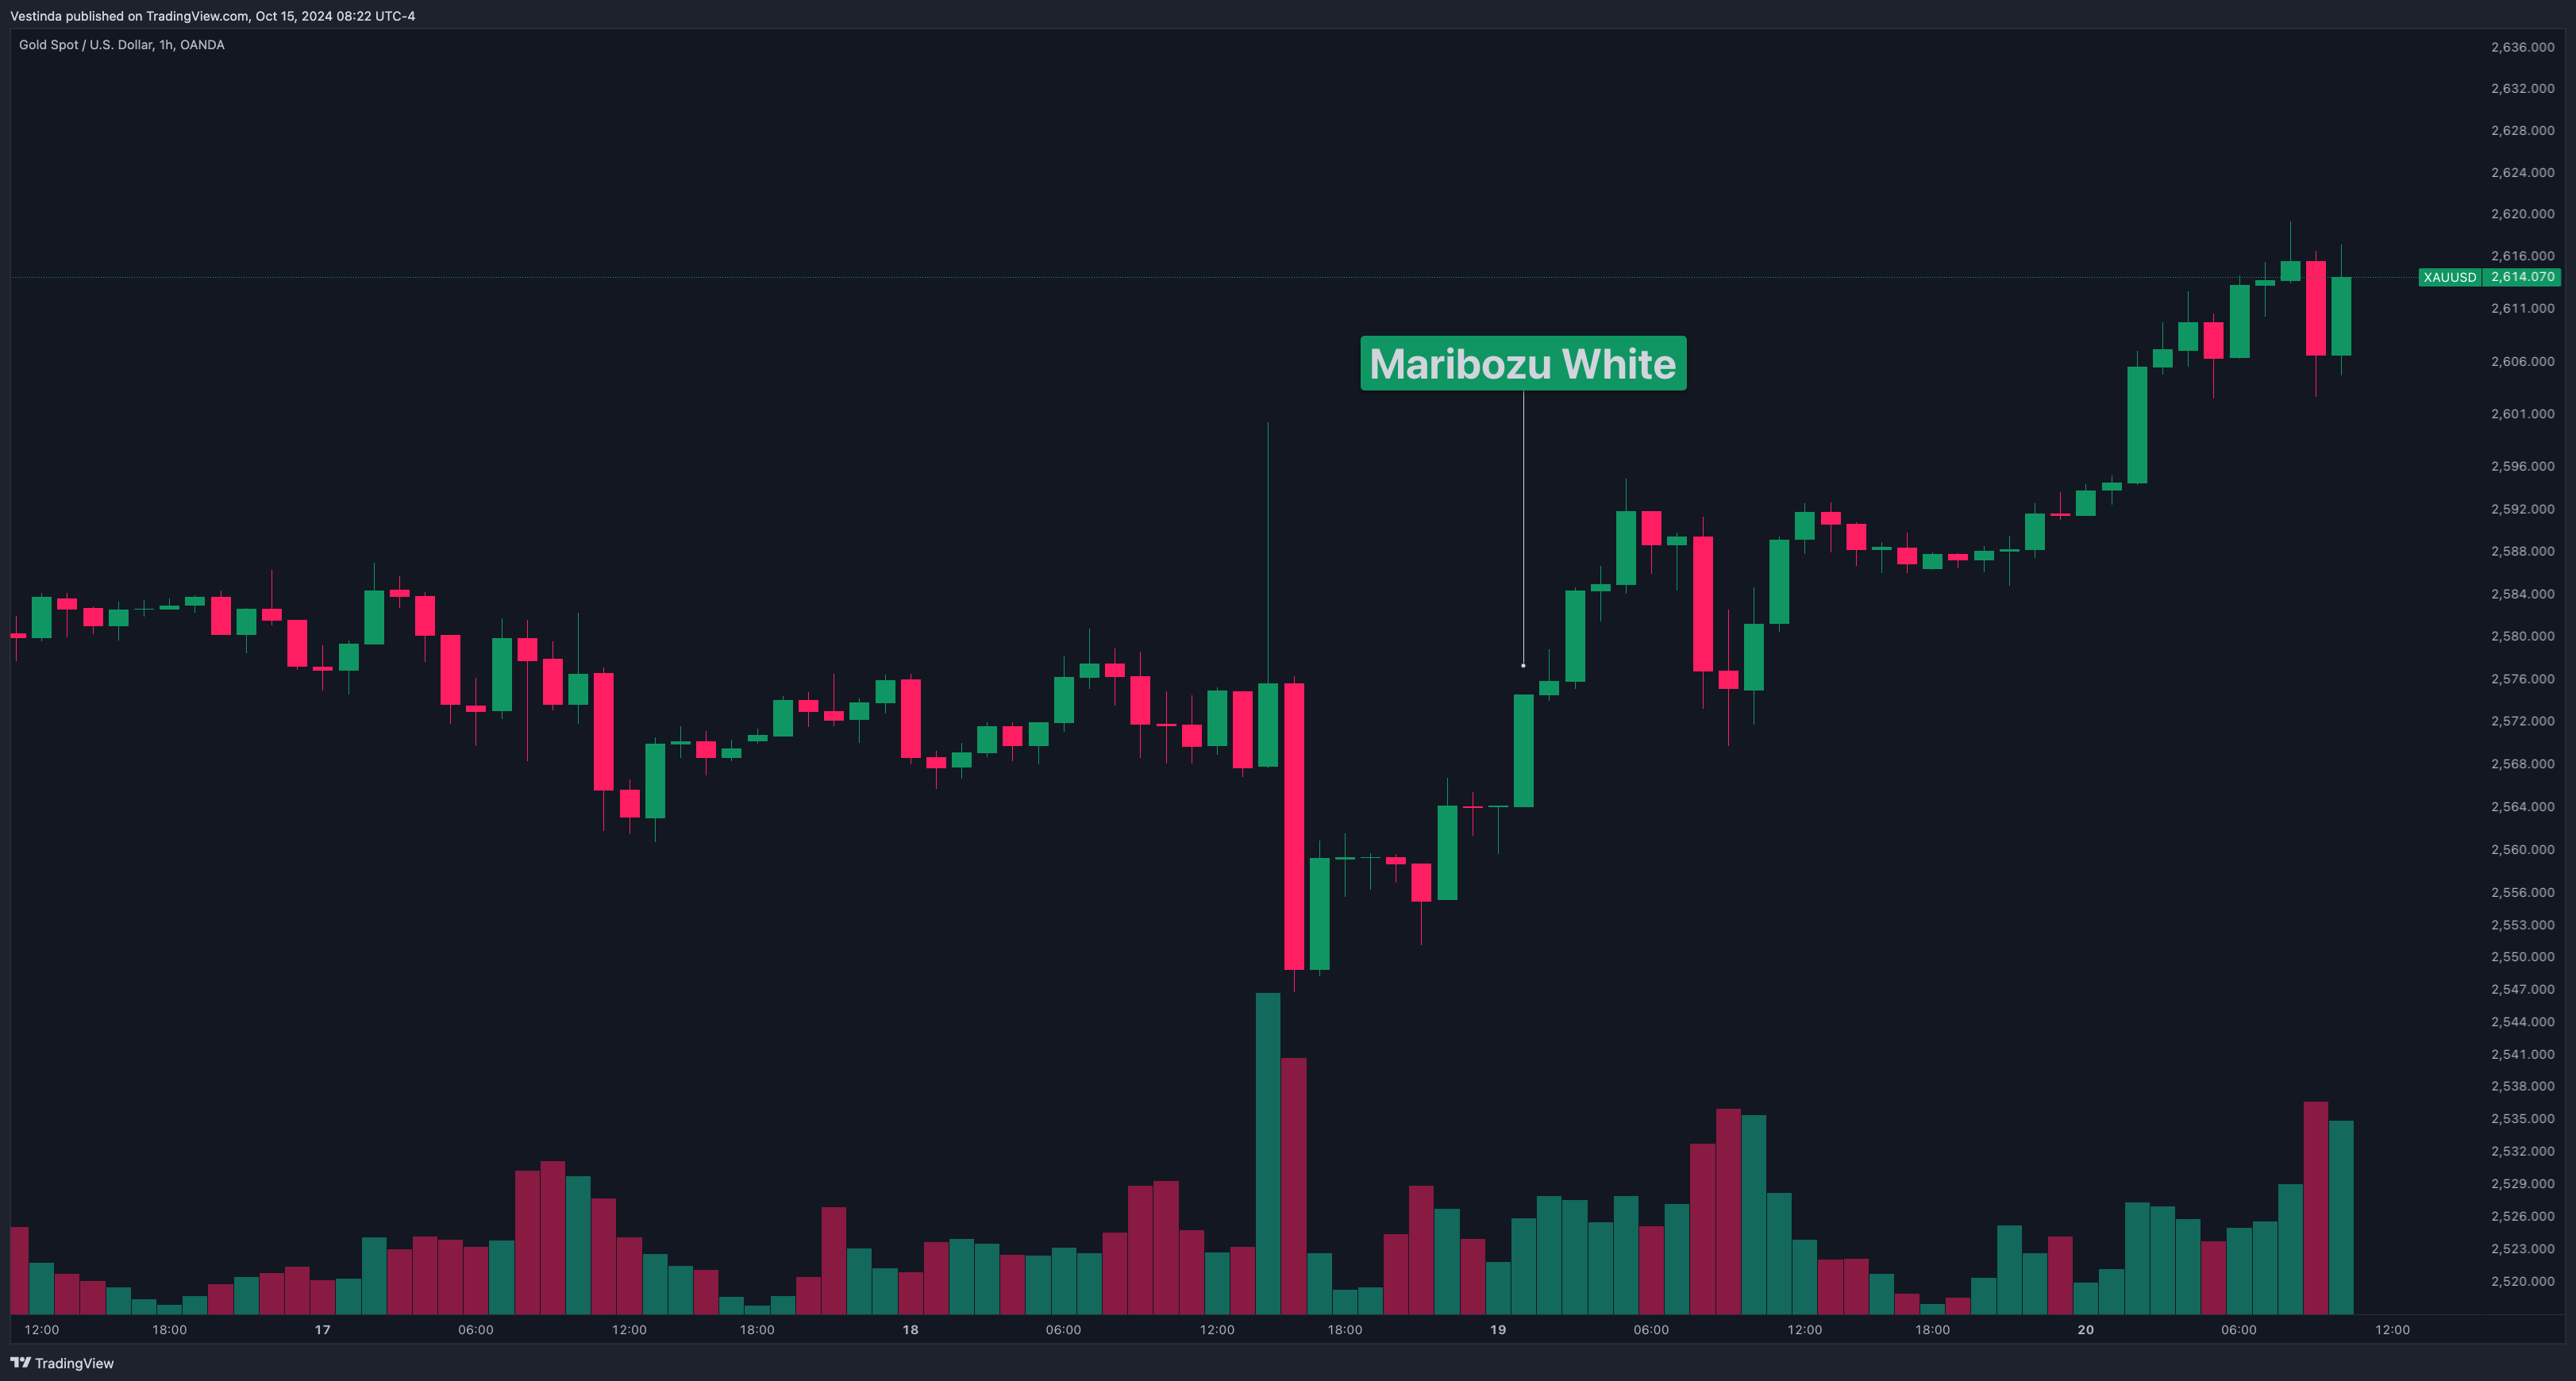
Concept: These are strong candlestick patterns that signal bullish (Marubozu White) or bearish (Marubozu Black) momentum.
How to Identify: Marubozu White: A long bullish candle with no wicks, meaning the open is equal to the low and the close is equal to the high. Marubozu Black: A long bearish candle with no wicks, meaning the open is equal to the high and the close is equal to the low.
Entry and Exit: Enter a long position on a Marubozu White, especially if it forms near support. For Marubozu Black, enter a short position, particularly if it forms near resistance. Place a stop-loss just outside the pattern and take profit at key levels.
How to Use XAUUSD Candlestick Patterns Effectively
Combine with Support and Resistance
Why: Candlestick patterns are more reliable when they form near key support or resistance levels.
How to Use: Look for patterns like bullish engulfing near support levels and bearish engulfing near resistance levels to confirm entry points.
Apply with Moving Averages
Why: Moving averages help identify the overall trend and can act as dynamic support or resistance levels.
How to Use: Use a 50-day or 200-day moving average to confirm whether the market is in an uptrend or downtrend. Enter trades when candlestick patterns align with the trend direction.
Volume Confirmation
Why: Volume spikes add weight to candlestick patterns, indicating stronger momentum.
How to Use: Enter trades only when the candlestick pattern is confirmed by higher-than-average volume, which suggests institutional involvement.
Risk Management for XAUUSD Candlestick Trading
Position Sizing
Concept: Determine the size of each trade based on your overall risk tolerance and the distance to your stop-loss level.
How to Implement: Use a percentage of your trading capital (e.g., 1-2%) for each trade to manage risk effectively.
Stop-Loss Placement
Concept: Use stop-loss orders to protect your capital and limit potential losses.
How to Implement: Place stop-loss levels below the low of bullish patterns or above the high of bearish patterns to avoid unnecessary risk.
Take-Profit Targets
Concept: Lock in profits at key levels to avoid giving back gains.
How to Implement: Place take-profit orders at the next support (for short trades) or resistance (for long trades) levels, or use a trailing stop to secure profits while letting the trade run.
XAU: Reversal Signal with Bearish Harami Pattern
The Bearish Harami Pattern is a candlestick pattern that usually appears after an uptrend. It suggests a potential reversal in the market. The pattern consists of two candlesticks. The first candlestick is a large bullish candle, followed by a smaller bearish candle that is completely engulfed by the previous candle. This indicates a loss of momentum and a possible shift in sentiment from bullish to bearish. Traders often look for confirmation through other technical indicators before making any trading decisions. For example, if the pattern appears near a resistance level or if there is bearish divergence in the RSI indicator, it can provide stronger confirmation of a potential bearish reversal. Traders who identify this pattern may consider selling or taking short positions, targeting lower price levels. In the XAU market, this pattern can be relevant for traders looking to capitalize on potential downward movements in the price of gold.
Candlestick Patterns' Impact on XAU Price Analysis
The role of candlestick patterns in XAU price analysis is crucial. These patterns provide valuable information about the market sentiment and can help predict future price movements.
Candlestick patterns such as the doji, hammer, and shooting star can indicate potential reversals or continuations in the XAU price. They can also provide insights into the strength or weakness of the current trend. When combined with other technical analysis tools, candlestick patterns can enhance the reliability of XAU price forecasts.
For example, a bullish engulfing pattern, where a long green candlestick engulfs the previous red candlestick, suggests a potential upward reversal in the XAU price. On the other hand, a bearish harami pattern, where a small green candlestick is engulfed by a larger red candlestick, may indicate a potential downward reversal.
Traders and investors often rely on candlestick patterns to make informed trading decisions in the XAU market. Understanding and correctly interpreting these patterns can improve the accuracy of XAU price analysis and increase the probability of profitable trades.
Candlestick Insights and XAU Fibonacci Analysis
Candlestick patterns are graphical representations of price movements that can help predict market trends. They use a combination of open, high, low, and close prices to form patterns that indicate potential reversals or continuations in the price movement. These patterns can be used in conjunction with Fibonacci retracement levels, which are mathematical ratios derived from the Fibonacci sequence. Fibonacci retracement levels help identify support and resistance levels where prices might reverse. When used together, candlestick patterns and Fibonacci retracement levels can provide valuable insights for traders. For example, if a candlestick pattern suggests a potential reversal and a Fibonacci retracement level aligns with that pattern, it can signal a high-probability trading opportunity. XAU, the symbol for Gold Spot, can benefit from the analysis of candlestick patterns and Fibonacci retracement levels due to its price volatility and global importance as a safe-haven asset.
-
 Create
account -
 Discover profitable
strategies -
 Connect exchange
& start earning
Frequently Asked Questions
No, candlesticks do not have to match. Mixing candlestick designs, shapes, or colors can actually add visual interest and create a unique and eclectic look to your space. The beauty of using different candlesticks is that it allows you to showcase your personal style and creativity. By mixing and matching candlesticks, you can create a dynamic and visually appealing arrangement that reflects your individual taste and adds personality to your home décor.
The reverse candle indicator is a technical analysis tool used in trading to identify potential trend reversals in the market. It analyzes candlestick patterns and their formations to predict when a current trend may change direction. This indicator looks for specific candlestick patterns, such as doji, shooting star, or hammer, that may indicate a shift in market sentiment. Traders use this tool to take advantage of possible trend reversals and make informed trading decisions. However, it is important to note that the reverse candle indicator should be used in conjunction with other tools and indicators for more accurate analysis and confirmation.
To identify a bullish engulfing pattern on a candlestick chart, look for two consecutive candles. The first candle should have a smaller body and be bearish (red or filled), indicating a downtrend. The second candle should have a larger body and be bullish (green or hollow). The body of the second candle should completely engulf the body of the first candle, indicating a reversal in the trend. This pattern suggests that buyers have gained control over the market, increasing the likelihood of a price rise. Confirming signals such as increased volume and other technical indicators can strengthen the validity of this pattern.
The psychology behind a bullish harami pattern in technical analysis suggests a shift in sentiment from bearishness to potential bullishness. It occurs when a smaller bullish candlestick is formed within the body of a larger bearish candlestick. Traders interpret this pattern as a sign of a potential trend reversal, as it reflects a decrease in selling pressure followed by a possible increase in buying pressure. The bullish harami indicates that buyers might be stepping in after a downtrend, signaling a potential price increase.
Reversal candles are candlestick patterns that indicate a potential change in the direction of a financial market. These patterns occur when the price action completes a specific formation that suggests a shift in market sentiment. Examples of reversal candles include the hammer, shooting star, engulfing, and doji patterns. Reversal candles often appear at key support or resistance levels and can signal the end of an uptrend or downtrend. Traders and analysts closely watch these patterns for potential trading opportunities and to anticipate trend reversals, helping them make informed decisions in the financial markets.
Yes, candlestick patterns can be applied to different timeframes. Candlestick patterns are formed by the open, high, low, and close prices of a specific time period, such as 1 minute, 1 hour, or 1 day. These patterns indicate market sentiment and help in predicting future price movements. Traders can analyze candlestick patterns on various timeframes to identify potential trading opportunities. While longer timeframes like daily charts provide more reliable signals, shorter timeframes like intraday charts can offer more frequent trading opportunities. Adapting candlestick analysis to different timeframes allows traders to gain insights into price patterns and make informed trading decisions.
Conclusion
In conclusion, XAU (Gold Spot) Candlestick Patterns are a powerful tool for traders in the financial market. By understanding the meaning and formation of these patterns, traders can make informed decisions and improve their trading strategies. Candlestick patterns provide valuable insights into market sentiment and can help predict future price movements. When combined with other technical analysis tools, such as Fibonacci retracement levels, they can enhance the accuracy of price forecasts and increase the probability of profitable trades. XAU, being a globally important safe-haven asset, can greatly benefit from the analysis of candlestick patterns and Fibonacci retracement levels. By leveraging these tools, traders can navigate the unpredictable world of trading with confidence and maximize their profits.

Successful traders rely on backtesting to be profitable.
Be like them with our
Free Backtesting Guide