
Sophisticated backtesting is not only possession of high-esteemed hedge funds anymore.
Impressive Team and support, Backtesting engine with detailed reports, The Strategy builder.

Great purchase!
I have always manually invested in stocks and cryptocurrencies, but after studying Vestinda, I must say it has enormous potential.

Mature platform for trading
Pro: Easy to use, Nice UX, A lot of customization for strategies, Back testing is an awesome tool, can check any strategy in history.

Quant Strategies & Backtesting results for SOL
Here are some SOL trading strategies along with their past performance. You can validate these strategies (and many more) for free on Vestinda across thousands of assets and many years of historical data.
Quant Trading Strategy: Follow the trend on SOL
The backtesting results for the trading strategy, conducted from November 18, 2020, to December 8, 2023, demonstrate promising statistics. The strategy exhibits a profit factor of 2.04, indicating that the total profit generated is more than double the losses incurred. Moreover, the annualized return on investment (ROI) stands at an impressive 949.03%, suggesting substantial growth over the tested period. On average, trades were held for one week, and there were approximately 0.37 trades per week. The strategy executed a total of 60 trades, with a winning trades percentage of 31.67%. Notably, the return on investment reached an exceptional 2875.84%, highlighting the potential profitability of this strategy.

 SOLUSDT

Choose another period and try again.
Quant Trading Strategy: Lock and keep profits on SOL
Based on the backtesting results from February 26, 2021, to October 22, 2023, the trading strategy exhibited promising statistics. The strategy yielded a profit factor of 1.9, indicating a favorable ratio between profits and losses. The annualized return on investment (ROI) stood at an impressive 287.56%. On average, positions were held for approximately 6 weeks and 5 days before being closed. The strategy had a conservative approach, with only 0.05 trades executed per week. From a total of 8 closed trades, the strategy achieved a winning trades percentage of 50%. Moreover, it outperformed the buy and hold approach by generating excess returns of 289.05%. These backtesting results suggest the potential effectiveness of the trading strategy during the given period.
SOLUSDT
Choose another period and try again.
SOL (Solana) Candlestick Patterns: A Comprehensive Guide
Introduction
Candlestick patterns are a cornerstone of technical analysis, offering traders valuable insights into market sentiment and potential price movements. For Solana (SOL), a cryptocurrency known for its liquidity and volatility, understanding these patterns can significantly enhance trading decisions. This comprehensive guide explores key candlestick patterns, their implications, and actionable strategies for traders.
Why Candlestick Patterns Matter in SOL Trading?
- Visual Simplicity: Candlesticks provide a clear and concise representation of price action.
- Early Signal Detection: Patterns highlight potential reversals or continuations before indicators confirm.
- Adaptable Across Timeframes: Useful for both short-term scalping and long-term strategies.
Key Candlestick Patterns for SOL Trading
1. Bullish Reversal Patterns
1. Hammer
Description: A small body with a long lower shadow, often forming after a downtrend.
What It Indicates: Potential reversal to the upside.
Trading Strategy:
- Enter long above the hammer’s high.
- Place a stop-loss below the hammer’s low.
2. Bullish Engulfing
Description: A larger green candle completely engulfs the previous red candle.
What It Indicates: Strong buying momentum, reversing the prior downtrend.

Trading Strategy:
- Enter long after the close of the engulfing candle.
- Set a stop-loss below the engulfing candle’s low.
2. Bearish Reversal Patterns
1. Shooting Star
Description: A small body with a long upper shadow, often forming after an uptrend.
What It Indicates: Potential reversal to the downside.
Trading Strategy:
- Enter short below the shooting star’s low.
- Place a stop-loss above the shooting star’s high.
2. Bearish Engulfing
Description: A larger red candle completely engulfs the previous green candle.
What It Indicates: Strong selling momentum, reversing the prior uptrend.
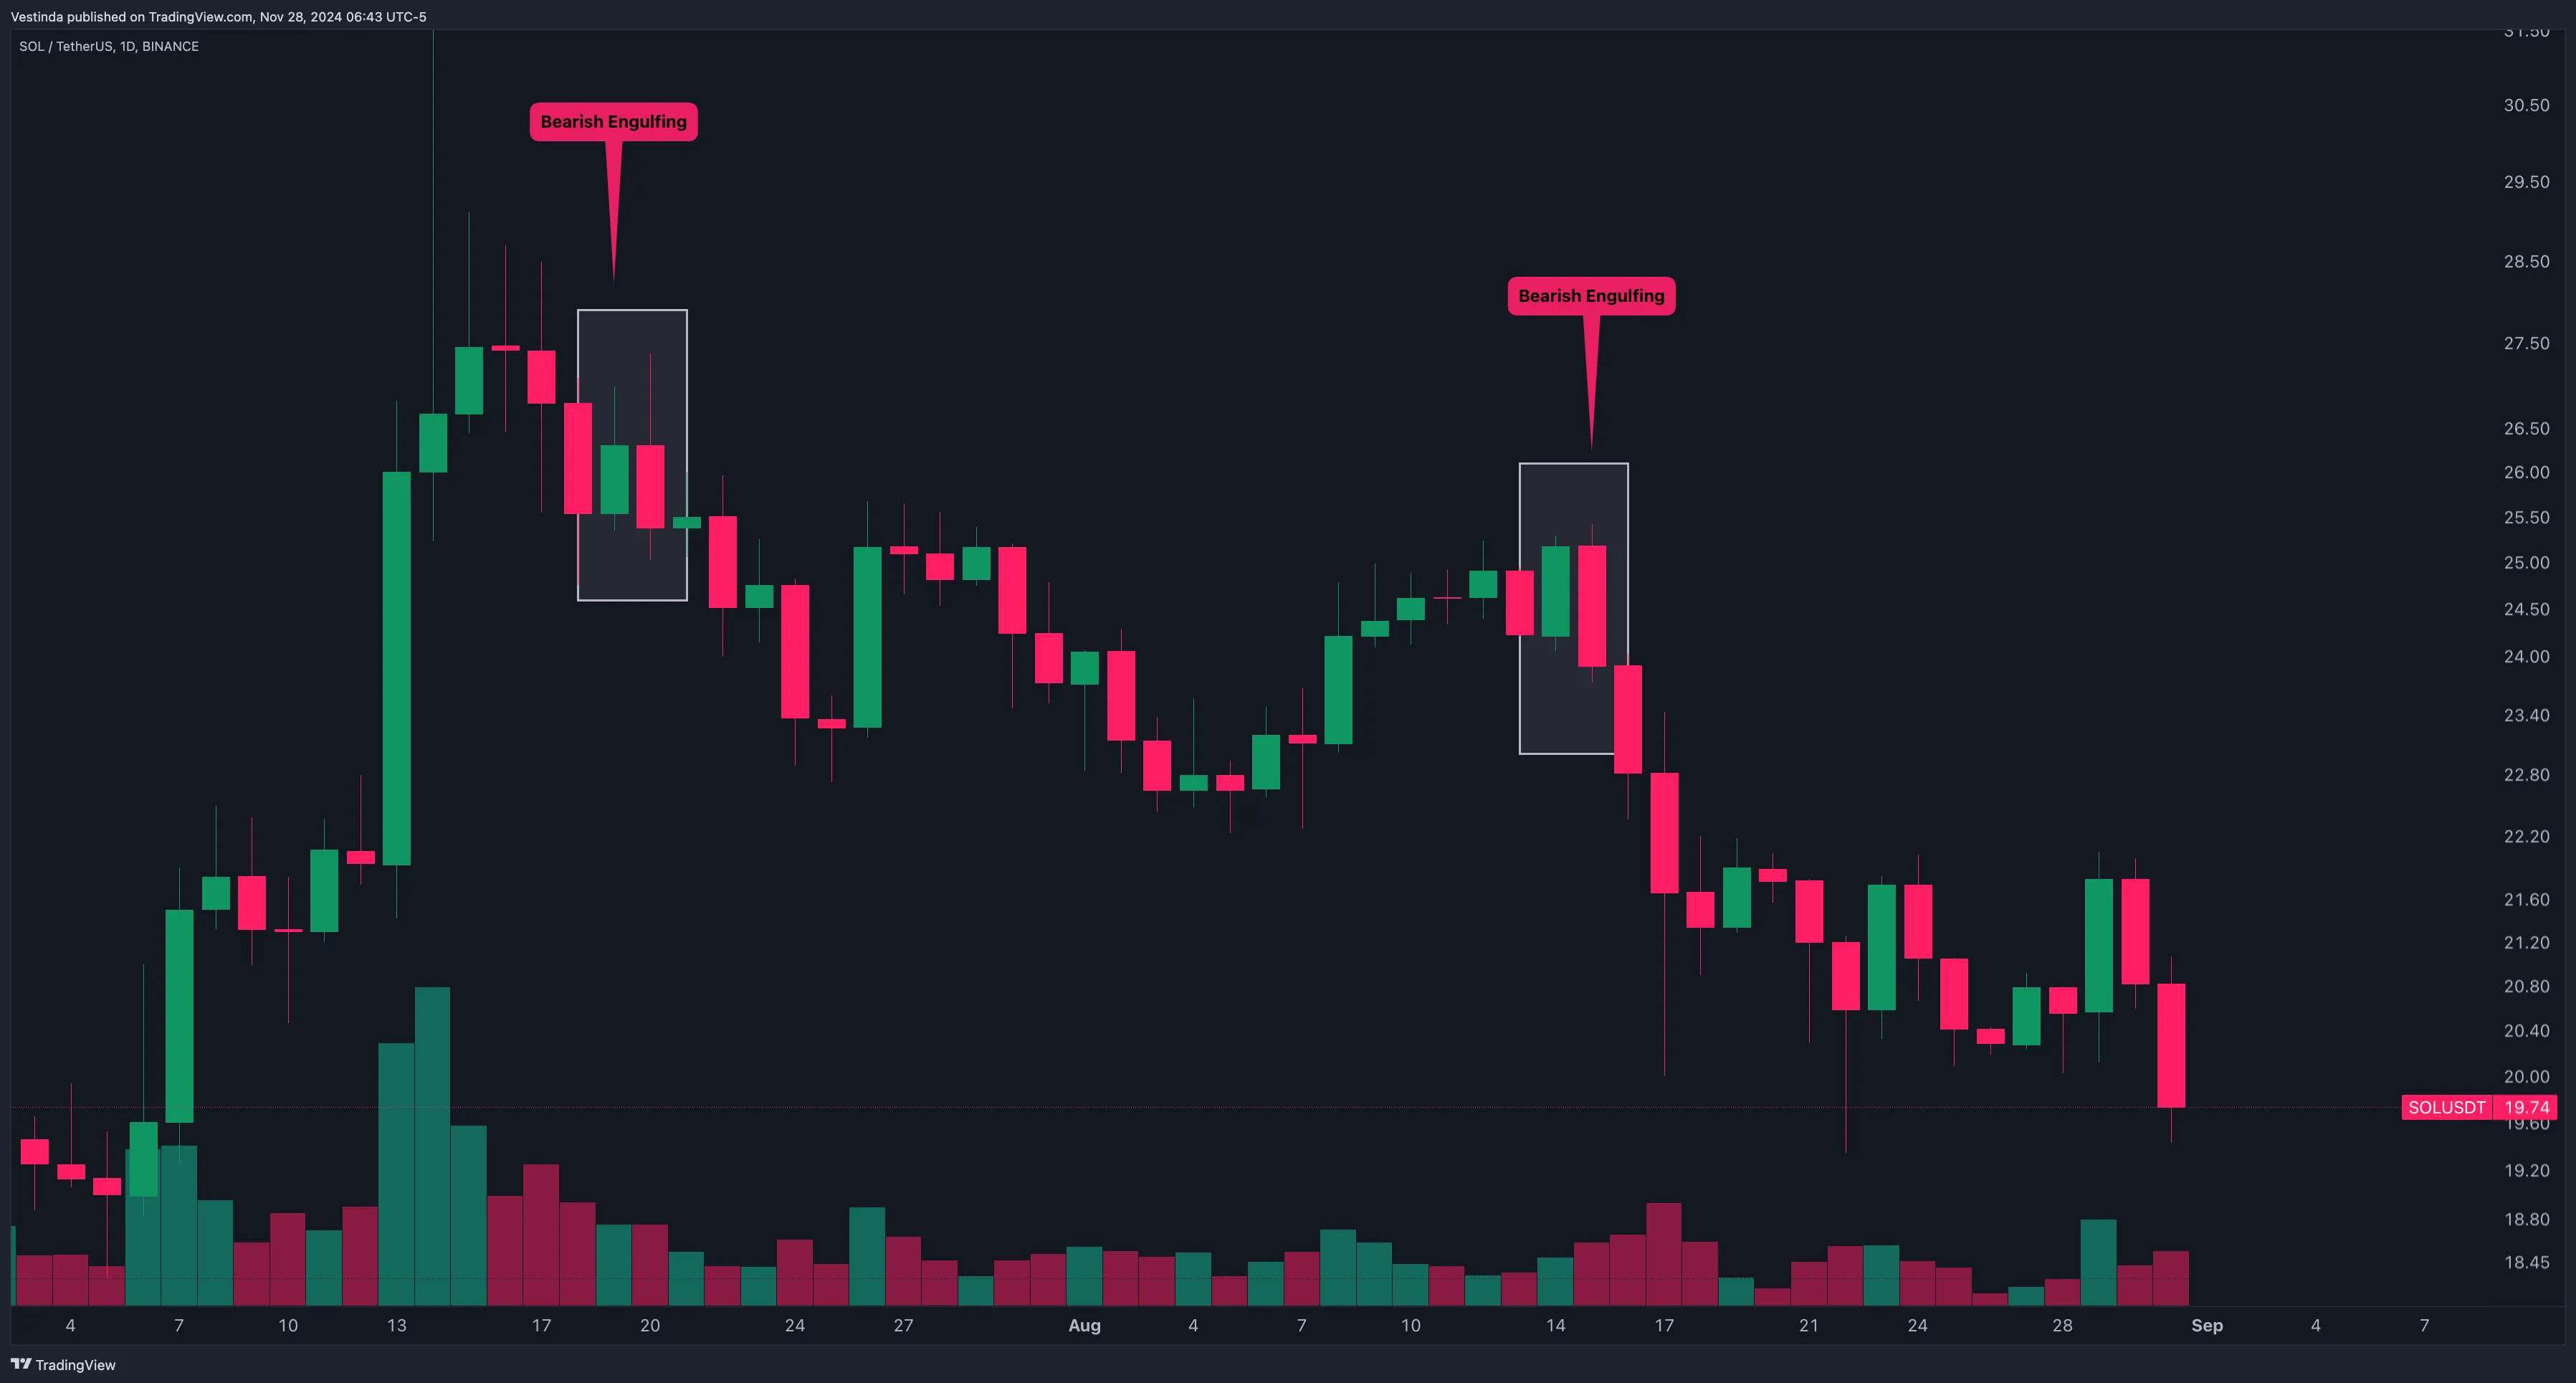
Trading Strategy:
- Enter short after the close of the engulfing candle.
- Set a stop-loss above the engulfing candle’s high.
Continuation Patterns for SOL Trading
1. Doji
Description: A candle with a small or no body, indicating indecision in the market.
What It Indicates: A potential continuation of the trend after consolidation.
Trading Strategy:
- Wait for the next candle to confirm the direction before entering a trade.
- Use support or resistance levels for additional confirmation.
2. Marubozu (White and Black)
Description:
- White Marubozu: A full green candle with no wicks, signaling strong bullish momentum.
- Black Marubozu: A full red candle with no wicks, signaling strong bearish momentum.
What It Indicates: A continuation of the prevailing trend.
Trading Strategy:
- Trade in the direction of the Marubozu with a tight stop-loss at the candle’s midpoint.
How to Trade SOL with Candlestick Patterns
1. Combine with Indicators
Use RSI or MACD to validate the strength of reversal or continuation patterns.
Example: Confirm a bullish hammer with an RSI below 30.
2. Monitor Key Levels
Look for patterns forming near support or resistance zones for higher reliability.
Example: Trade a bullish engulfing pattern at a key support level.
3. Set Clear Entry and Exit Rules
Enter trades only after the pattern completes and shows clear momentum.
Use stop-loss and take-profit levels based on recent swing highs/lows.
Example Trade Setup
Scenario:
Pattern: Bullish Engulfing on the 4-hour chart.
Setup: SOL is trading at $20 after a downtrend, and a bullish engulfing pattern forms.
Execution:
- Enter long at $21 (above the engulfing candle’s high).
- Place a stop-loss at $19.50 (below the engulfing candle’s low).
- Take-profit at $25, targeting the next resistance level.
Common Mistakes to Avoid
- Trading Patterns in Isolation: Always combine patterns with volume, indicators, or key levels for confirmation.
- Ignoring Timeframe Context: Patterns on shorter timeframes may lead to false signals; align trades with higher timeframe trends.
- Overtrading: Focus on high-probability patterns instead of chasing every setup.
Conclusion
Candlestick patterns offer a powerful way to anticipate price movements in Solana’s market. By mastering patterns like hammers, engulfing candles, and Marubozus, traders can gain a strategic edge. Combine these patterns with robust risk management and technical analysis tools to maximize profitability and navigate SOL’s dynamic market confidently.
SOL Candlestick Patterns: Trading Insights and Strategies
- Learn the basic candlestick patterns: doji, hammer, engulfing, etc.
- Identify the patterns on Solana (SOL) price charts using technical analysis tools.
- Analyze the pattern's significance and its potential impact on SOL's price movement.
- Consider other factors such as timeframe, volume, and overall market conditions.
- Make informed trading decisions based on the pattern's implications and your risk tolerance.
- Enter a trade position (buy or sell) when your analysis confirms the pattern's validity.
- Set a stop loss and take profit levels to manage and protect your trades.
- Monitor the trade and adjust your stop loss or exit strategy accordingly.
Bullish Harami Pattern: Unlocking SOL's Potential
The Bullish Harami Pattern is a reversal pattern that can appear on SOL charts. It consists of two candlesticks: a larger bearish candlestick followed by a smaller bullish candlestick. The bullish candlestick is completely contained within the range of the previous bearish candlestick. This pattern suggests a potential trend reversal from bearish to bullish. It indicates that buyers might be stepping in to drive the price higher after a period of selling pressure. Traders often see this pattern as a bullish signal and may interpret it as a possible buying opportunity. However, it is important to confirm the pattern with additional indicators or analysis before making any trading decisions.
SOL Candlestick Patterns: Trade Insights and Analysis
Candlestick patterns are essential tools in SOL day trading. They provide valuable insights into market trends and potential price movements. By analyzing the shape, size, and color of candlesticks, traders can make better-informed decisions. For example, a bullish engulfing candlestick pattern indicates a potential uptrend, while a bearish engulfing pattern suggests a possible downturn. Other popular candlestick patterns in SOL day trading include the doji, hammer, shooting star, and hanging man. These patterns can help traders identify key entry and exit points for their trades. However, it is important to remember that candlestick patterns should not be used in isolation but rather in conjunction with other technical indicators and analysis tools. By combining these tools, SOL day traders can increase their chances of success and navigate the volatile cryptocurrency market more effectively.
SOL's Advancing and Declining Trend Analysis
The Rising and Falling Three Methods is a candlestick chart pattern in technical analysis. It consists of five candles, where the middle three candles are smaller and within the range of the first and fifth candles. The pattern can indicate a continuation or reversal of an existing trend.
In a Rising Three Methods pattern, the first and fifth candles are long and in the direction of the trend, while the three smaller candles are typically in a downward direction. This pattern suggests a temporary pause within an uptrend, with a high probability of the upward movement continuing. Traders can look for a bullish entry point after the pattern forms.
Conversely, a Falling Three Methods pattern occurs within a downtrend, where the first and fifth candles are bearish, and the smaller candles are typically bullish. This pattern suggests a temporary consolidation within a downtrend, indicating a potential continuation in the downward movement. Traders may consider a bearish entry point once the pattern is complete.
These patterns are commonly used by traders to identify potential trend reversals or continuations in the SOL market.
SOL-ving Breakouts and Breakdowns with Candlestick Patterns
Candlestick patterns are essential for trading SOL breakouts and breakdowns. The bullish engulfing pattern, a short-sentence signal, indicates a potential upward trend reversal. It forms when a small bearish candle is followed by a larger bullish candle. Another pattern to watch for is the piercing pattern, which suggests a possible bullish reversal. This pattern consists of a long bearish candle followed by a bullish candle that opens below the previous candle's low but closes above its midpoint. For SOL breakdowns, the bearish harami pattern, recognized by a small bullish candle followed by a larger bearish candle, could indicate a potential downward trend reversal. Additionally, the evening star pattern, seen when a bullish candle is followed by a small-bodied candle and a bearish candle, may also suggest a future decline. Traders should learn to interpret these candlestick patterns for successful SOL trading strategies.
-
Track your
Crypto Portfolio -
Copy Crypto trading
strategies -
Build trading strategies
with no code
-
Backtest trading strategies
on Crypto, Forex, Stocks, etc. -
Demo Trading
Risk-free Paper Trading -
Automate trading strategies
with Live Trading
Frequently Asked Questions
Candlestick patterns can be effectively used for breakout trading by identifying potential trend reversals or continuation signals. Look for patterns such as the bullish or bearish engulfing, doji, or three black crows near key support or resistance levels. These patterns indicate market sentiment shifting, often leading to price breakouts. Confirm the pattern with volume analysis or additional indicators, and set your entry and exit points accordingly. Always use proper risk management techniques and consider the overall market trend to increase the probability of a successful breakout trade.
Yes, professional traders often use candlestick patterns as part of their technical analysis. Candlestick patterns provide valuable information about the behavior of buyers and sellers during a specific time frame, which helps traders make informed decisions. These patterns can indicate potential trend reversals, continuation patterns, and entry/exit points. Candlestick patterns, such as doji, engulfing, and hammer, are commonly employed by professionals to identify potential market movements and make profitable trades. However, it is important to note that candlestick patterns should not be solely relied upon but used in conjunction with other technical indicators and fundamental analysis for a comprehensive trading strategy.
To recognize a bearish harami pattern on a candlestick chart, look for a small bullish candlestick followed by a larger bearish candlestick. The bullish candlestick represents the first day's trading, and the bearish candlestick represents the second day's trading. The bearish candlestick should open above the previous day's close and close below the previous day's open, forming a smaller body than the first candlestick. This indicates a potential reversal in the bullish trend and suggests that selling pressure is starting to outweigh buying pressure. Traders often see this pattern as a bearish signal to consider selling or shorting the asset in question.
A bearish engulfing pattern on a candlestick chart can be recognized when a small bullish candle is followed by a larger bearish candle that completely engulfs the previous candle's body. The bearish candle opens higher than the bullish candle's close and closes below the bullish candle's open, forming a clear bearish signal. Traders look for this pattern as it suggests a potential reversal in the upward trend, indicating a shift towards selling pressure in the market. Consequently, this could present an opportunity to take a bearish position and profit from the anticipated downward movement.
The key difference between a bullish and bearish harami cross lies in the overall market trend and candlestick formation. A bullish harami cross occurs during a downtrend when a small bullish candle is engulfed by a larger bearish candle. This pattern suggests a potential reversal towards an upward trend. On the other hand, a bearish harami cross appears in an uptrend when a small bearish candle is engulfed by a larger bullish candle. This signals a possible trend reversal towards a downward direction. By analyzing the candlestick's size, market trend, and the sequence of bullish and bearish candles, one can effectively differentiate between the two patterns.
Conclusion
In conclusion, SOL (Solana) Candlestick Patterns are valuable tools used in cryptocurrency trading to predict price movements. By understanding the meaning and significance of different candlestick patterns, traders can make informed decisions and improve their trading strategies. It is important to use technical analysis tools to identify these patterns on SOL price charts and consider other factors such as timeframe, volume, and overall market conditions. When analyzing candlestick patterns, it is crucial to confirm them with additional indicators or analysis before making any trading decisions. Candlestick patterns should not be used in isolation but in conjunction with other technical indicators and analysis tools to increase the chances of success in navigating the volatile cryptocurrency market. Trading SOL breakouts and breakdowns using candlestick patterns can be an effective strategy, such as identifying bullish engulfing and piercing patterns for upward trend reversals and bearish harami and evening star patterns for downward trend reversals. By mastering SOL Candlestick Patterns, traders can enhance their ability to analyze price charts and develop successful trading strategies in the crypto market.

Successful traders rely on backtesting to be profitable.
Be like them with our
Free Backtesting Guide