
-
 Create
account -
 Discover profitable
strategies -
 Connect exchange
& start earning
Algorithmic Strategies & Backtesting results for SHIB
Here are some SHIB trading strategies along with their past performance. You can validate these strategies (and many more) for free on Vestinda across thousands of assets and many years of historical data.
Algorithmic Trading Strategy: Lock and keep profits on SHIB
Based on the backtesting results from May 10, 2021, to October 20, 2023, the trading strategy showed promising statistics. The profit factor stood at 1.47, indicating that for every dollar invested, $1.47 was earned. The annualized return on investment (ROI) reached an impressive 42.39%, showcasing the strategy's profitability over the analyzed period. The average holding time for trades was around 3 weeks and 5 days, suggesting a relatively short-term approach. With an average of 0.07 trades per week and a total of 9 closed trades, the strategy demonstrated a moderate level of activity. Although the winning trades percentage was 33.33%, the strategy outperformed the buy-and-hold approach by generating excess returns of 795.23%, further highlighting its effectiveness.

 SHIBUSDT

Choose another period and try again.
Algorithmic Trading Strategy: Long Term Investment on SHIB
The backtesting results for the trading strategy conducted from October 20, 2022, to October 20, 2023, revealed promising statistics. The strategy displayed a profit factor of 1.66, indicating that the gains outweighed the losses. The annualized return on investment (ROI) stood at 10.01%, suggesting a commendable performance. On average, the holding time per trade spanned approximately 1 week and 1 day, while the strategy generated an average of 0.07 trades per week. With a total of 4 closed trades, this strategy exhibited a winning trade percentage of 75%. Notably, it outperformed the buy and hold approach, generating excess returns of 58.99%. Overall, these results suggest a reliable and successful trading strategy.
SHIBUSDT
Choose another period and try again.
SHIB (Shiba Inu) Chart Patterns: A Comprehensive Analysis
Introduction
Chart patterns are an integral part of technical analysis, providing insights into potential market movements. For Shiba Inu (SHIB), a highly volatile cryptocurrency, understanding these patterns can be crucial for traders seeking profitable opportunities. This guide explores key chart patterns and their application in trading SHIB.
Why Chart Patterns Matter in SHIB Trading?
- Market Psychology: Patterns reflect the collective behavior of market participants.
- Actionable Insights: They help traders identify potential breakouts, reversals, and trend continuations.
- Scalability: Applicable across various timeframes, from short-term scalping to long-term investments.
Common Chart Patterns in Shiba Inu Trading:
1. Bullish Reversal Patterns:
These patterns indicate a potential shift from a downtrend to an uptrend.
1. Double Bottom:
- Description: Two consecutive lows of similar depth followed by a breakout above resistance.
- Significance: Signals the exhaustion of selling pressure and the onset of buying momentum.

- Trading Strategy:
- Buy Signal: Enter long when SHIB’s price breaks above the neckline (resistance level).
- Stop-Loss: Place below the second low.
- Take-Profit: Target the height of the pattern added to the breakout point.
2. Inverse Head and Shoulders:
- Description: A three-trough pattern with the middle trough (head) deeper than the two side troughs (shoulders).
- Significance: Suggests a reversal from bearish to bullish sentiment.

- Trading Strategy:
- Buy Signal: Enter long after a breakout above the neckline.
- Stop-Loss: Place below the right shoulder.
- Take-Profit: Project the height of the head above the neckline.
2. Bearish Reversal Patterns:
These patterns signal a potential transition from an uptrend to a downtrend.
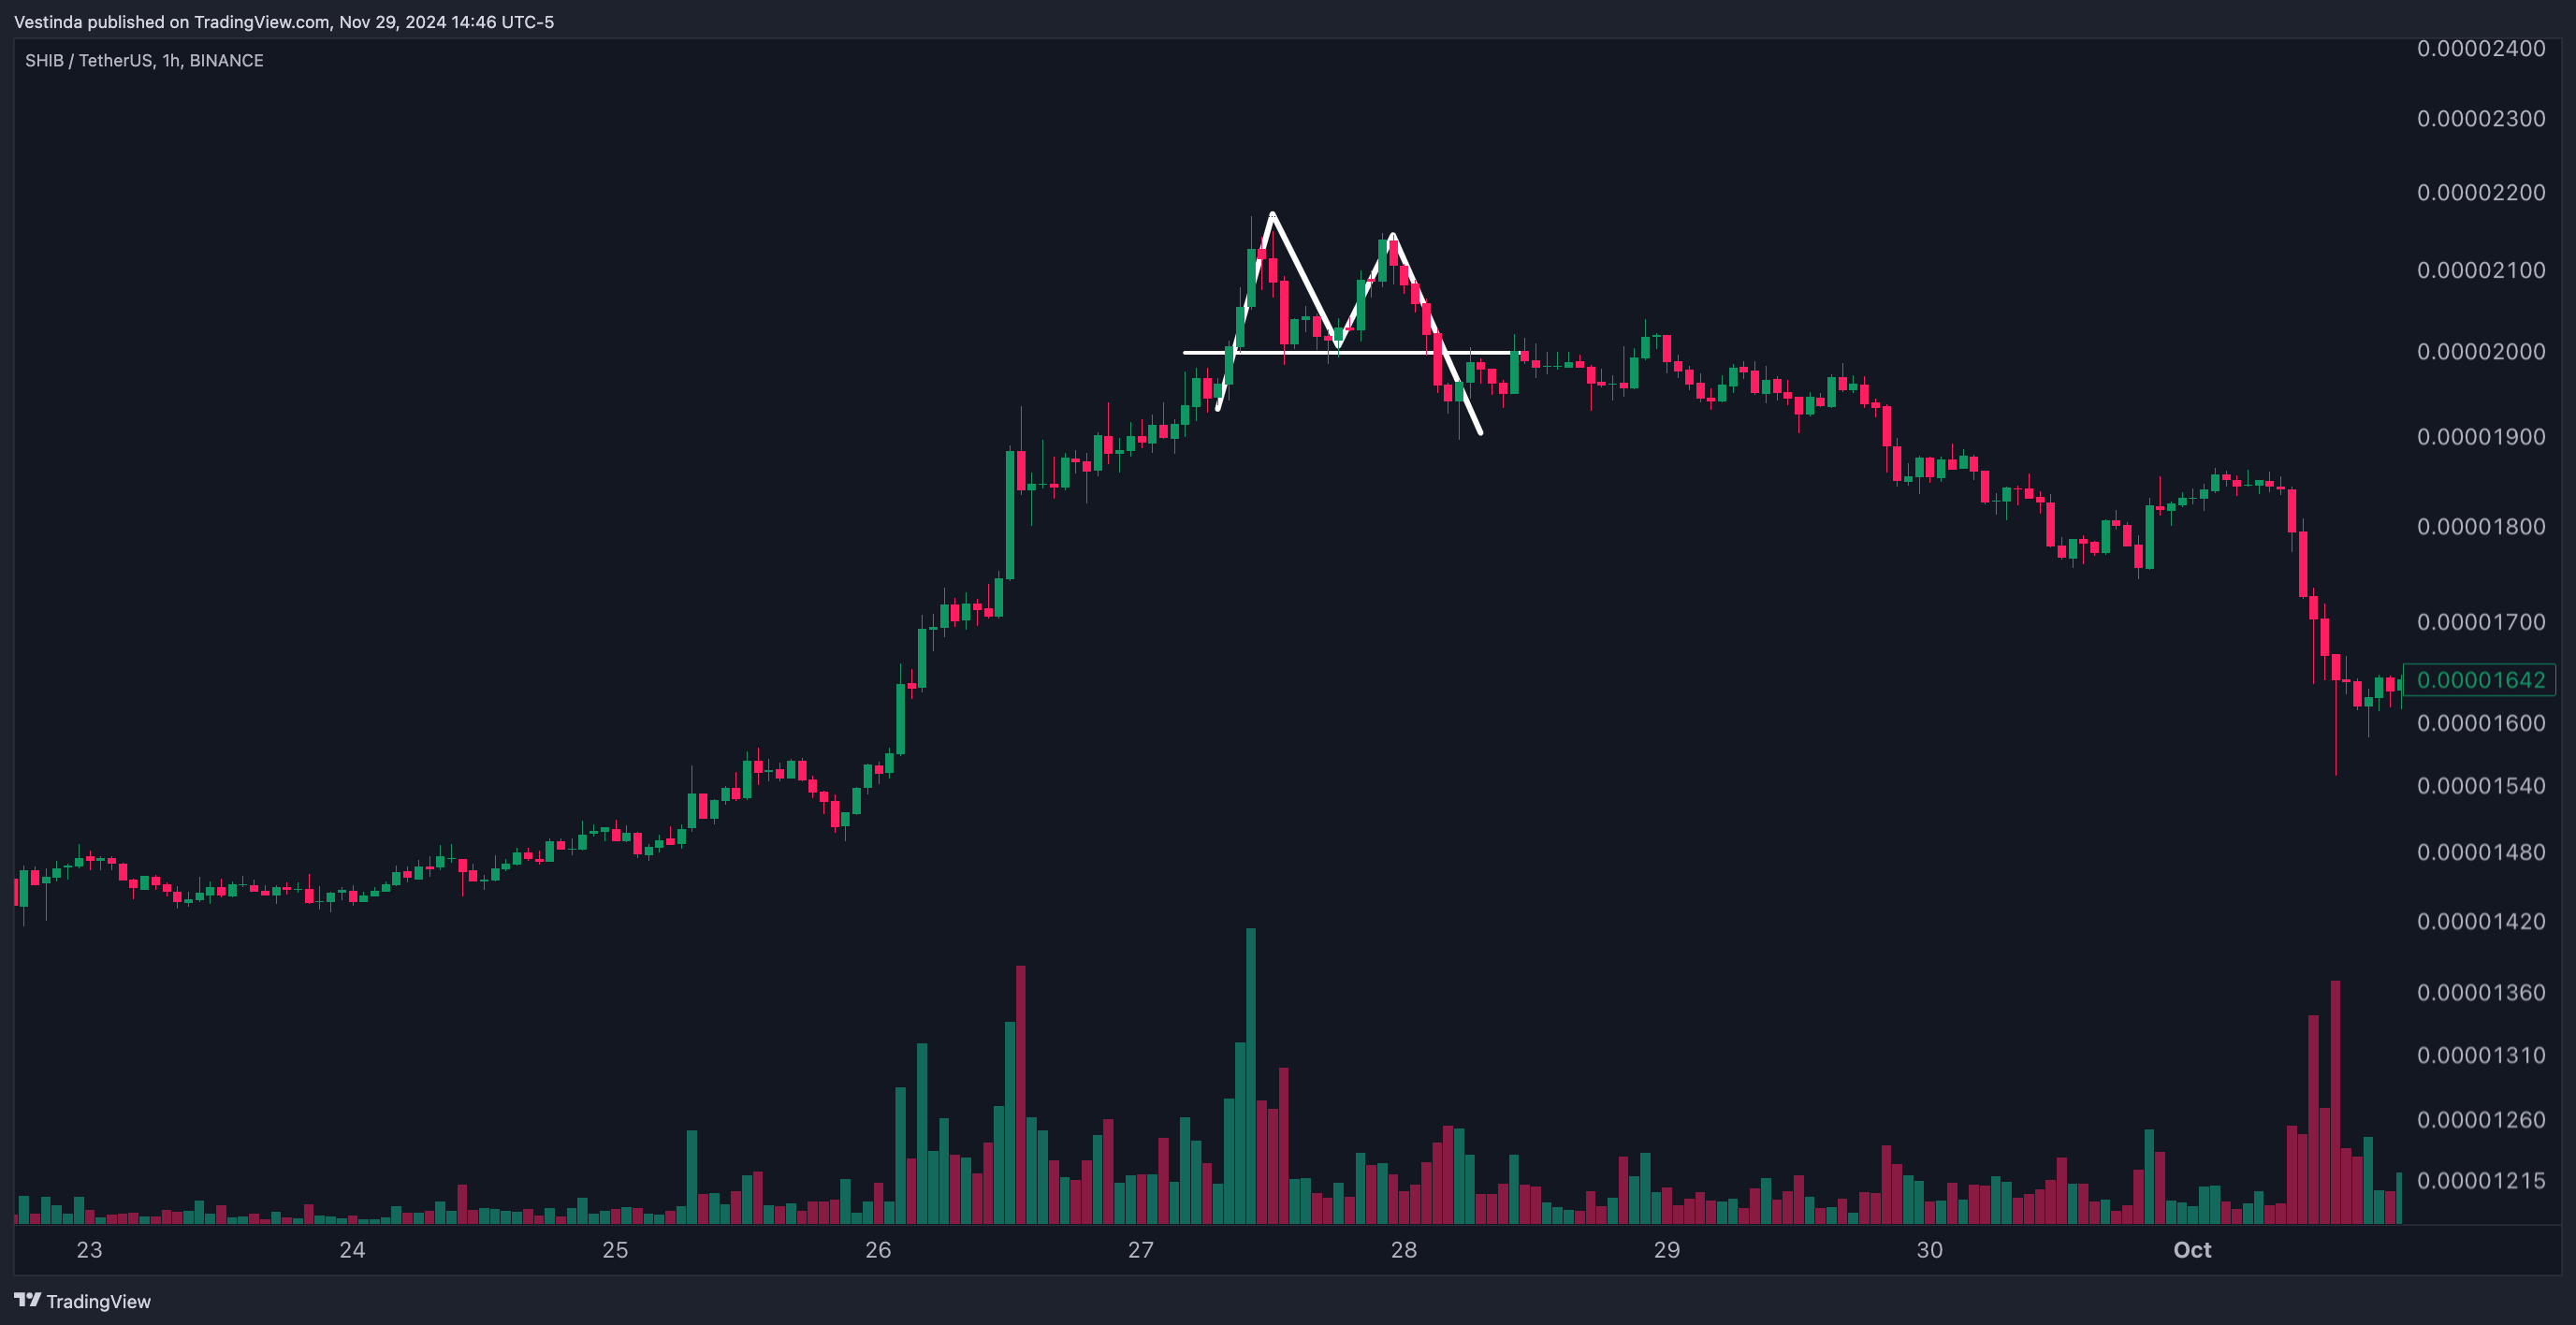
1. Double Top:
- Description: Two consecutive peaks of similar height, followed by a breakout below support.
- Significance: Indicates waning buying momentum and potential bearish reversal.
- Trading Strategy:
- Sell Signal: Enter short when SHIB’s price breaks below the neckline (support level).
- Stop-Loss: Place above the second peak.
- Take-Profit: Target the height of the pattern subtracted from the breakout point.
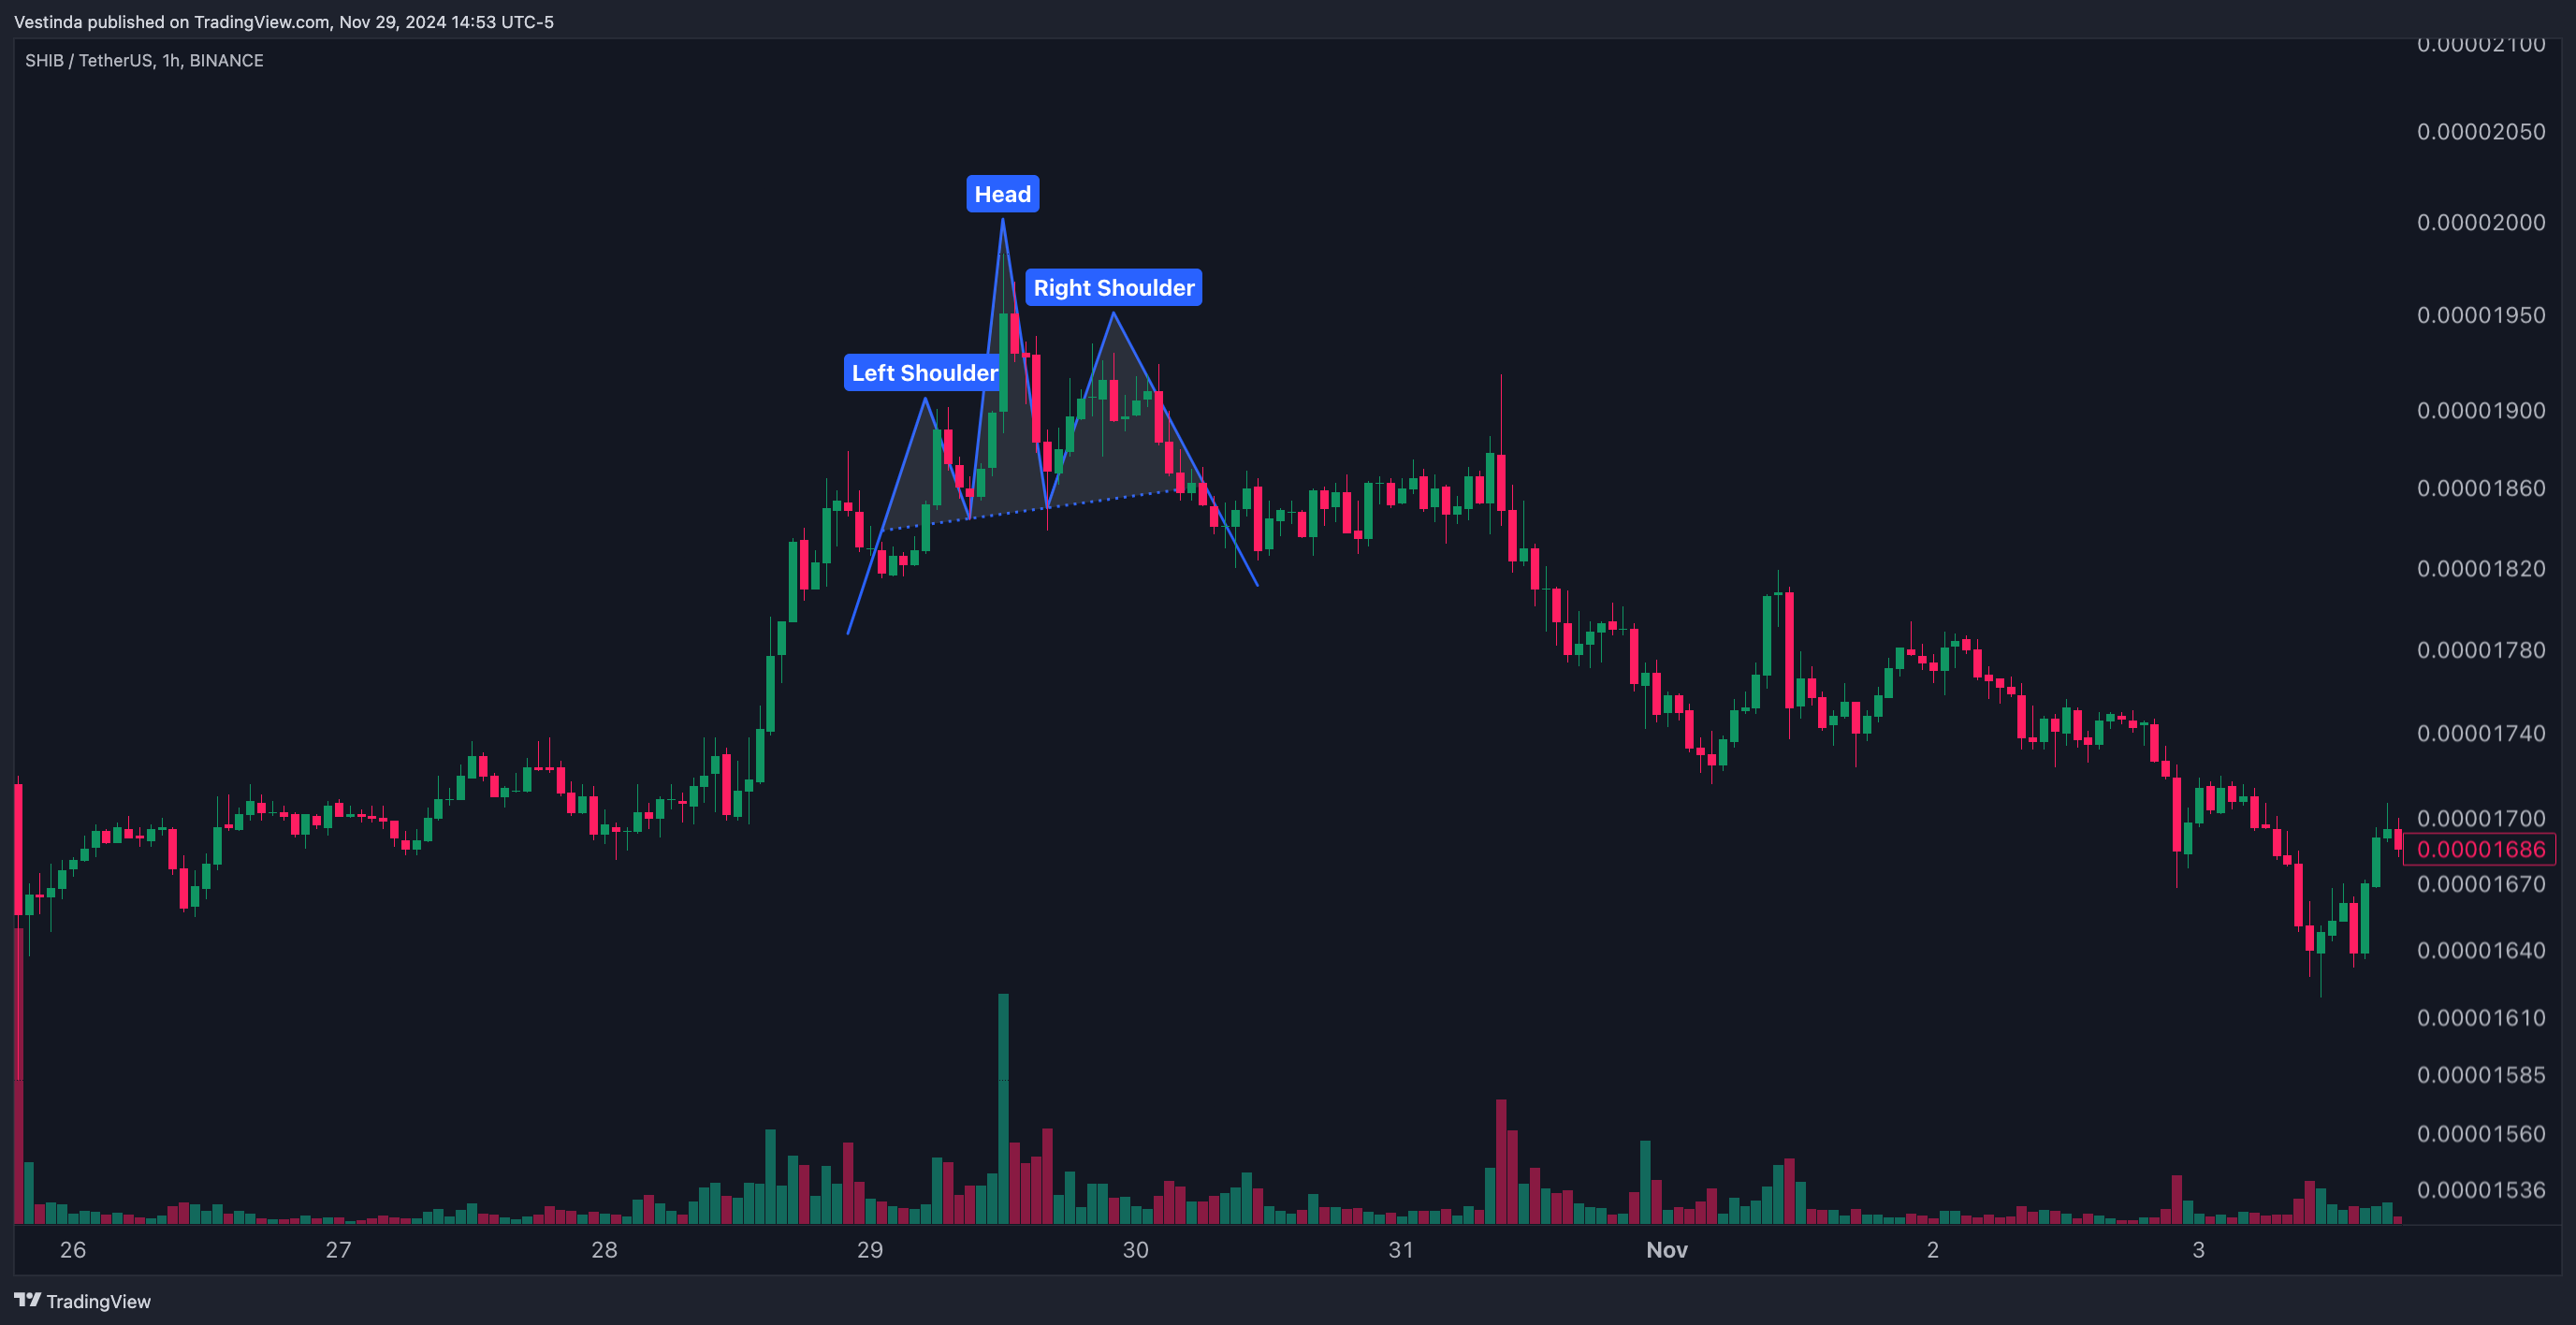
2. Head and Shoulders:
- Description: A three-peak pattern with the middle peak (head) higher than the two side peaks (shoulders).
- Significance: Reflects a gradual weakening of upward momentum.
- Trading Strategy:
- Sell Signal: Enter short after a breakout below the neckline.
- Stop-Loss: Place above the right shoulder.
- Take-Profit: Project the height of the head below the neckline.
3. Continuation Patterns:
These patterns suggest that the existing trend is likely to persist.
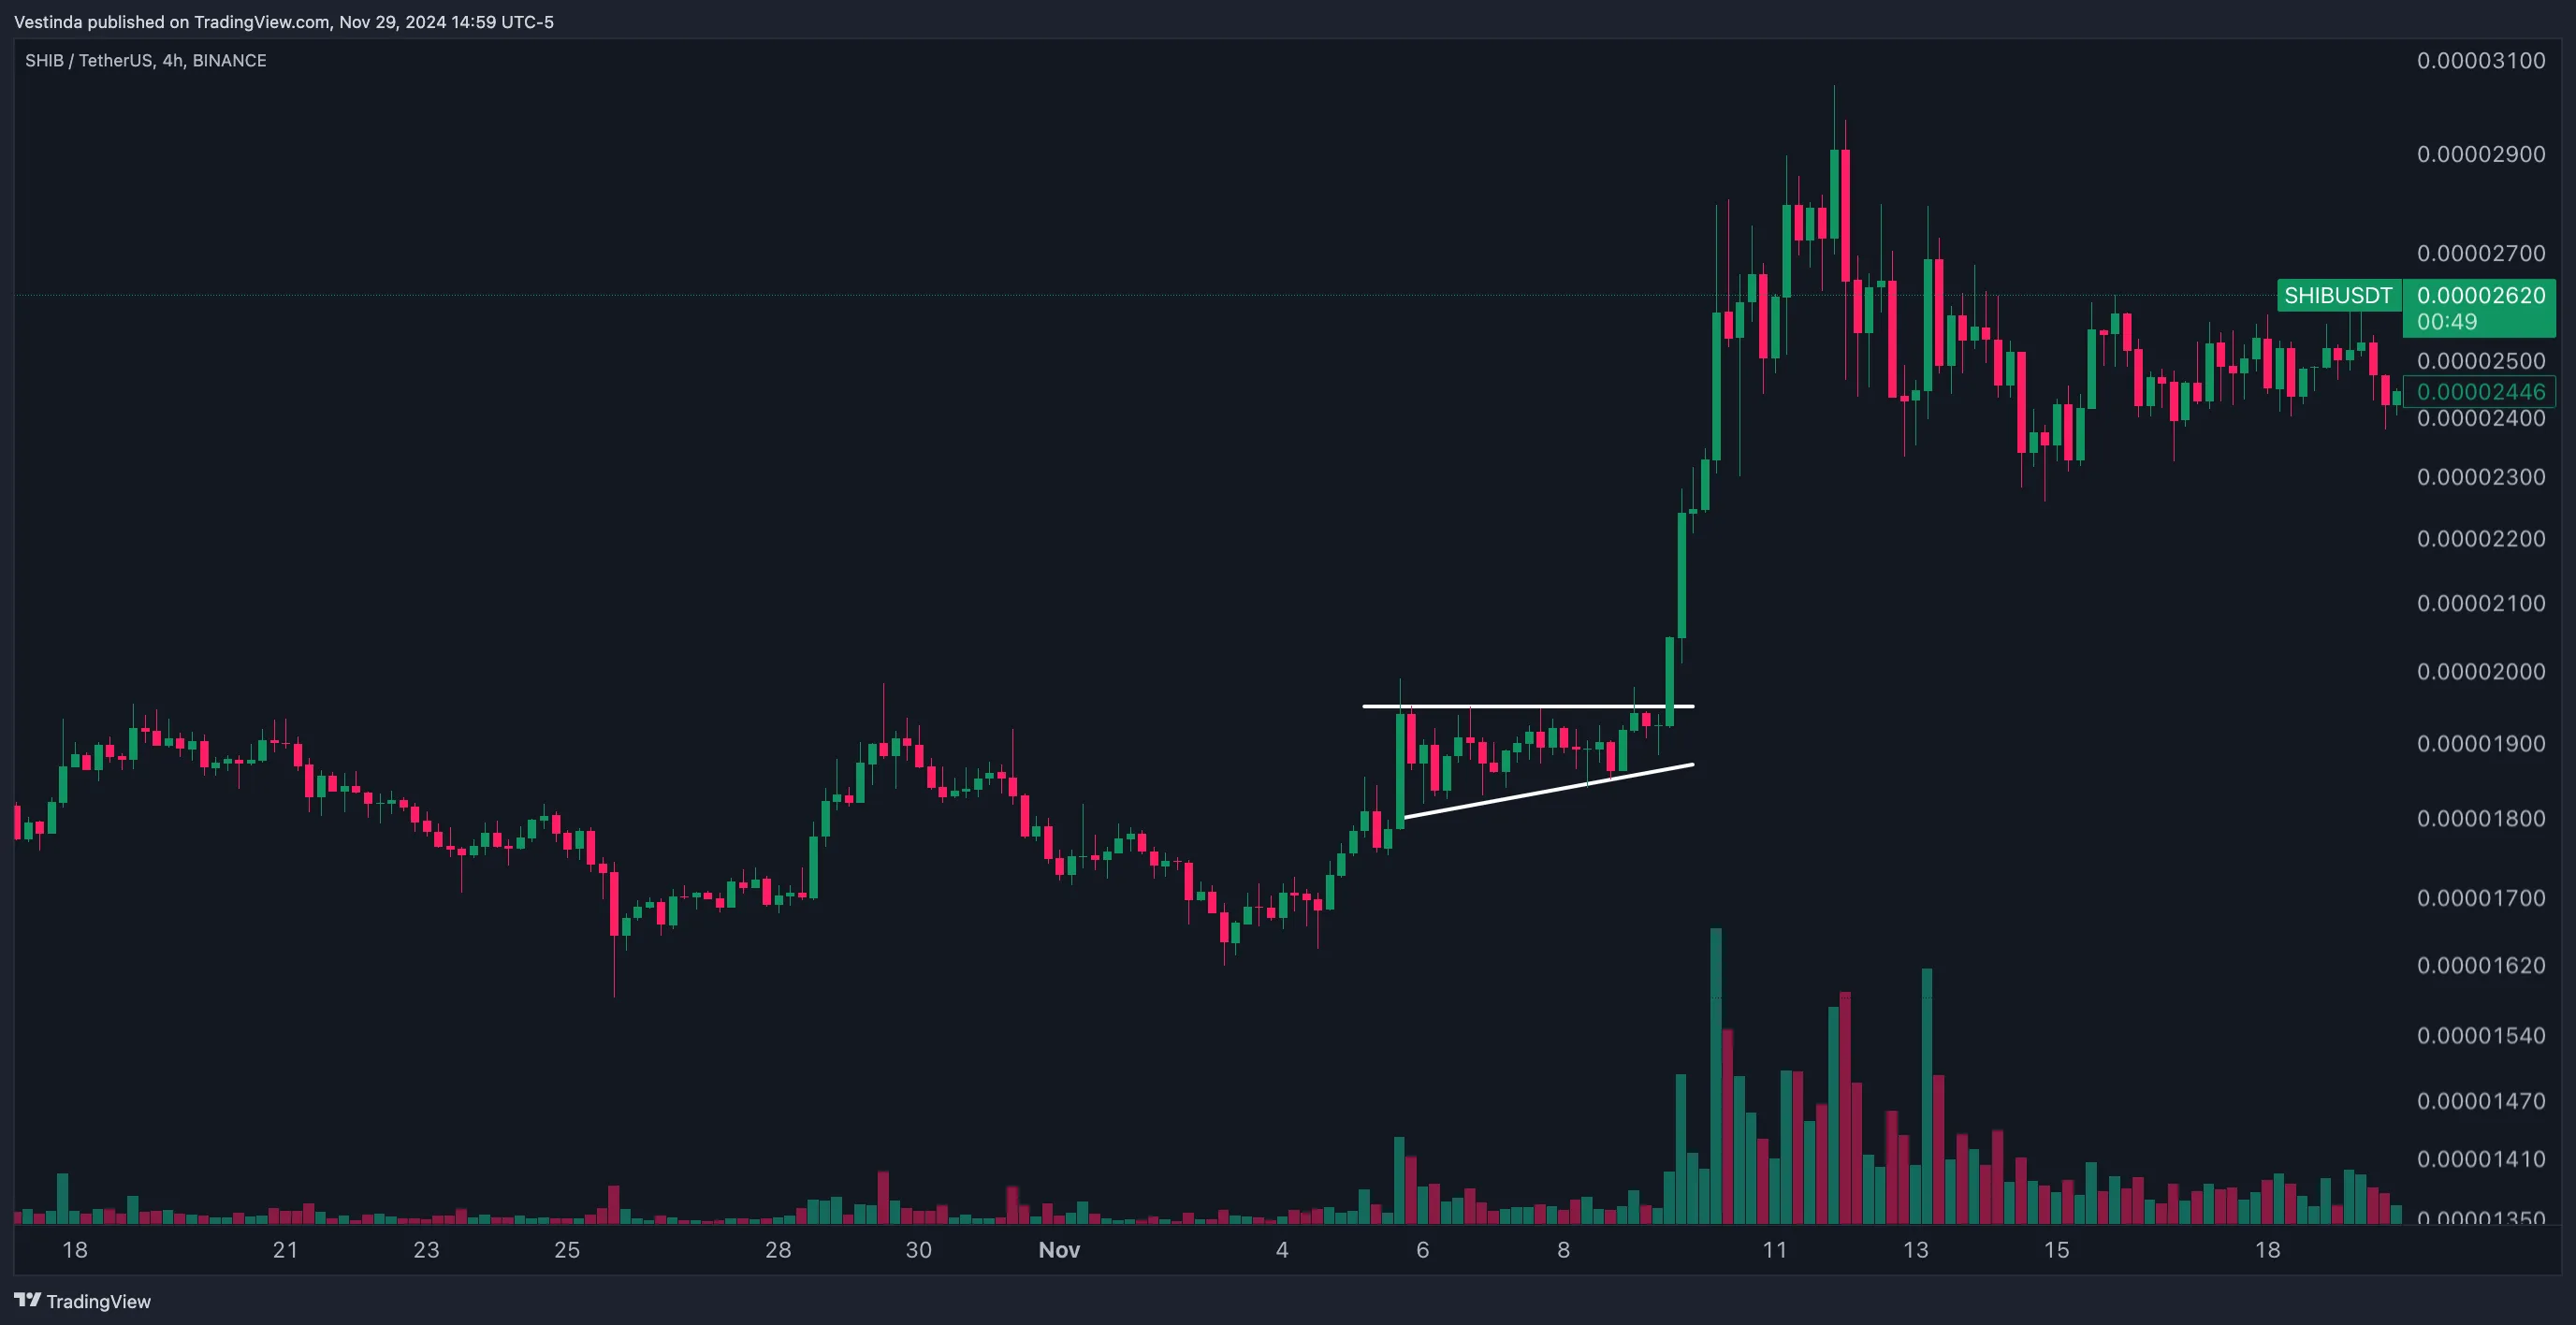
1. Ascending Triangle:
- Description: A pattern with a horizontal resistance line and rising support levels.
- Significance: Signals strong buying interest and potential breakout to the upside.
- Trading Strategy:
- Buy Signal: Enter long when SHIB’s price breaks above resistance with strong volume.
- Stop-Loss: Place below the nearest support.
- Take-Profit: Target the height of the triangle added to the breakout point.
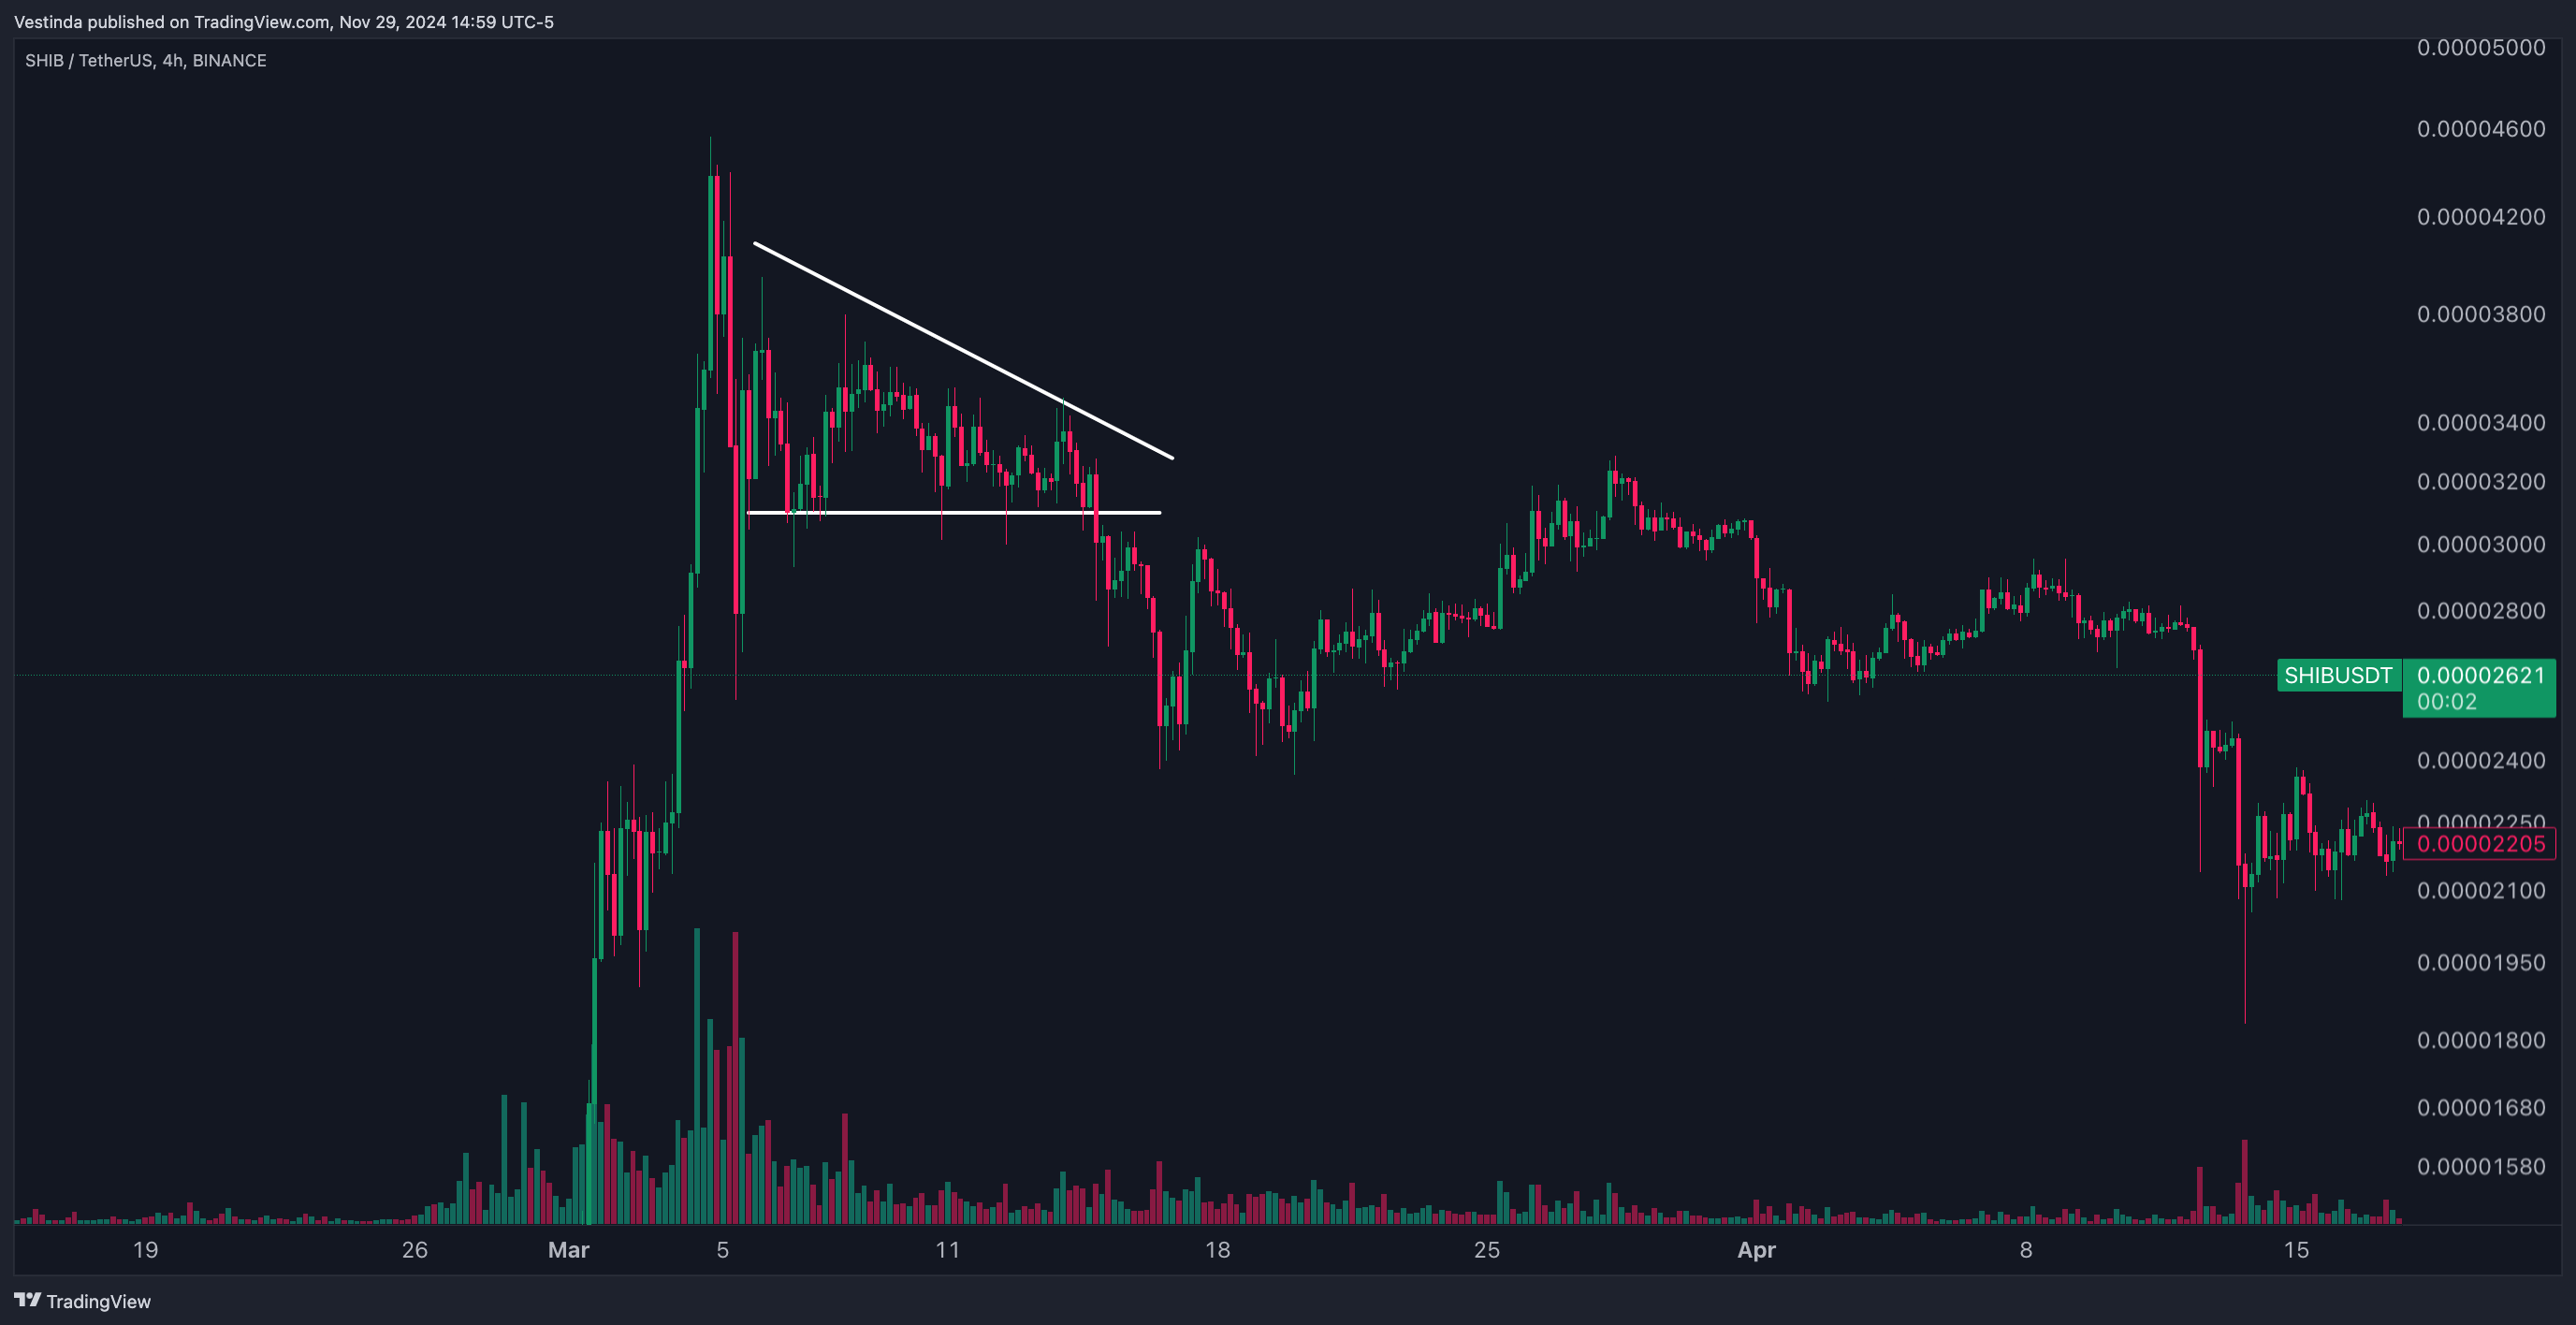
2. Descending Triangle:
- Description: A pattern with a horizontal support line and falling resistance levels.
- Significance: Indicates mounting selling pressure and a potential breakout to the downside.
- Trading Strategy:
- Sell Signal: Enter short when SHIB’s price breaks below support with strong volume.
- Stop-Loss: Place above the nearest resistance.
- Take-Profit: Target the height of the triangle subtracted from the breakout point.
Tips for Trading Shiba Inu Using Chart Patterns:
- Combine Patterns with Indicators: Example: Confirm breakouts with volume spikes or RSI crossing key thresholds.
- Focus on Key Levels: Identify strong support and resistance levels to enhance pattern reliability.
- Use Multiple Timeframes: Validate patterns on higher timeframes and execute trades on lower timeframes.
- Backtest Patterns: Test your approach on historical SHIB data to evaluate effectiveness.
Common Mistakes to Avoid:
- Ignoring Confirmation: Always wait for a clear breakout before entering a trade.
- Overtrading: Focus on high-probability setups and avoid forcing trades.
- Neglecting Risk Management: Use stop-loss orders to limit potential losses.
Conclusion:
Mastering chart patterns is essential for trading Shiba Inu effectively. By combining these patterns with indicators, key levels, and disciplined risk management, traders can navigate SHIB’s volatile market with confidence. Practice identifying these patterns and refining your strategies to unlock consistent trading opportunities.
Strategic SHIB Chart Patterns for Trading
- Identify chart patterns on the SHIB trading chart.
- Look for common patterns such as triangles, head and shoulders, or double tops/bottoms.
- Analyze the pattern to determine if it indicates a potential price reversal or continuation.
- Confirm the pattern by waiting for a breakout or breakdown of key levels.
- Set entry and exit points based on the pattern's target and stop loss levels.
- Place the trade, keeping in mind the risk-to-reward ratio and position sizing.
- Monitor the trade and adjust the stop loss or take profit levels as needed.
- Close the trade when the price reaches your predetermined target or if the pattern invalidates.
Bullish Commodity Breakout Formation: SHIB's Cup and Handle
The Cup and Handle pattern is a technical analysis pattern commonly seen in stock charts. It usually forms after an extended upward trend, creating a U-shaped cup followed by a smaller consolidation period, forming the handle. The pattern indicates bullishness and suggests a potential continuation of the previous uptrend when the price breaks out of the handle. Traders often look for high trading volume during the cup formation and a gradual decrease in volume during the handle. While primarily observed in stock analysis, the Cup and Handle pattern can also be seen in cryptocurrency charts. For example, the SHIB token experienced a Cup and Handle pattern in late 2021, with the handle acting as a support level for subsequent price increases. Investors often consider the Cup and Handle pattern as a signal for potential buying opportunities.
SHIB's Rectangular Tendencies: Chart Pattern Exploration
The Rectangle chart pattern is a popular technical analysis pattern used by traders to predict price movements. It is formed when the price of an asset trades within a specific range, creating a rectangle-like shape on a price chart. Traders usually identify this pattern by drawing horizontal lines to represent support and resistance levels. The pattern suggests that the price will continue to trade within the range until a breakout occurs. A breakout can be either bullish or bearish, indicating a potential trend reversal. Traders often look for volume expansion during the breakout to confirm the validity of the pattern. Understanding this pattern can help traders make informed decisions about when to buy or sell an asset, including popular cryptocurrencies such as SHIB.
News Impact on Chart Patterns: SHIB Insights
The influence of news and events on chart patterns is significant.
News releases and major events can cause sudden shifts in market sentiment.
These shifts can lead to the formation of specific chart patterns, such as breakouts or reversals.
For example, if there is positive news about a certain industry, it can result in an uptrend in related stocks.
Similarly, negative news or events can trigger a downtrend or a bearish pattern.
Short-term price movements can be influenced by key announcements, earnings reports, economic data, or even social media trends.
When investing in cryptocurrencies like SHIB, it is important to stay informed and aware of news that can impact its value.
By paying attention to news and events, traders can better understand and anticipate potential chart patterns in the market.
Decoding Wedge: SHIB Trading Strategies.
Wedge patterns can be helpful indicators for making trading decisions. SHIB has shown a descending wedge pattern recently, signaling a potential bearish reversal. This pattern is characterized by converging trend lines, with the upper line sloping downwards and the lower line sloping upwards. Traders often look for a breakout in either direction as a signal to enter a trade. A breakout below the lower trend line suggests a bearish move, while a breakout above the upper trend line indicates a bullish move. However, it is important to confirm the breakout with other technical indicators and consider other factors, such as market sentiment and news events, before making a trading decision. Utilizing wedge patterns can provide valuable insights, but it is crucial to do thorough analysis and exercise caution when making trading decisions.






Frequently Asked Questions
Chart patterns can fail due to a variety of factors. Over-reliance on historical patterns without considering current market conditions is a common reason. External events or unexpected news can disrupt the pattern, causing it to fail. In addition, market manipulation or false signals can mislead traders. Human psychology also plays a role, as patterns can become self-fulfilling prophecies if enough traders act on them, but overly crowded trades can result in the pattern failing. Ultimately, chart patterns are a tool, not a guarantee, and traders must exercise caution and consider multiple factors before relying solely on them.
No, not everybody can win in trading. Trading involves risk and is a zero-sum game, meaning for someone to win, someone else must lose. It requires knowledge, experience, and skill to be consistently successful. While some individuals may make profits, many others may experience losses. Markets are driven by supply and demand forces, making it impossible for everyone to win simultaneously. However, individuals can aim to minimize their losses and maximize their gains through proper risk management, research, and analysis.
Traders can possess a high level of intelligence and analytical skills due to the demanding nature of their profession. They need to constantly monitor and interpret market trends, analyze data, and make quick decisions under pressure. However, it would be inaccurate to generalize that all traders are "very smart" as intelligence levels can vary greatly within the field. Successful trading also requires a combination of knowledge, experience, discipline, and adaptability, alongside intelligence. Ultimately, being a smart trader involves a holistic skill set rather than solely intellectual prowess.
A bullish engulfing pattern in SHIB trading occurs when the current candlestick completely engulfs the previous one, indicating a potential trend reversal from bearish to bullish. Traders interpret this pattern as a sign of strength and possible buying pressure. Its significance lies in the potential for a bullish breakout or trend continuation. To confirm its validity, it's important to consider other factors like volume, support/resistance levels, and market sentiment. This pattern can be used to identify potential entry or exit points, but risk management and further analysis are crucial for successful trading decisions.
Conclusion
In conclusion, understanding chart patterns is crucial for analyzing the market trends of SHIB (Shiba Inu) and making informed trading decisions. Whether you're a seasoned investor or a curious beginner, diving into the world of SHIB chart patterns can provide you with a deeper understanding of this cryptocurrency and its market dynamics. By identifying and analyzing chart patterns, such as the Cup and Handle pattern, the Rectangle pattern, and the Wedge pattern, traders can anticipate potential price movements and take advantage of buying or selling opportunities. Additionally, staying informed about news and events can help traders better understand and anticipate chart patterns in the market. However, it is important to confirm patterns with other technical indicators and consider other factors before making trading decisions.

Successful traders rely on backtesting to be profitable.
Be like them with our
Free Backtesting Guide