
-
 Create
account -
 Discover profitable
strategies -
 Connect exchange
& start earning
Quant Strategies & Backtesting results for BTC
Here are some BTC trading strategies along with their past performance. You can validate these strategies (and many more) for free on Vestinda across thousands of assets and many years of historical data.
Quant Trading Strategy: MVWAP and VWAP Crossover on BTC
During the five-year period from December 16, 2018, to December 16, 2023, this backtesting analysis of a trading strategy yielded promising results. The strategy demonstrated a profit factor of 1.42, indicating that for every dollar invested, $1.42 was returned. The annualized return on investment (ROI) stood at an impressive 95.38%, illustrating the strategy's ability to generate substantial returns over a one-year period. On average, positions were held for approximately 2 weeks and 5 days, suggesting that the strategy relied on short to medium-term trades. With an average of 0.19 trades per week, the frequency of trades was relatively low. Out of a total of 51 closed trades, 41.18% were successful, leading to an overall return on investment of 476.89%. These statistics suggest that this trading strategy has the potential to be a profitable and reliable investment approach.

 BTCUSDT

Choose another period and try again.
Quant Trading Strategy: ZLEMA Crossover with Increased Price Variance on BTC
The backtesting results for the trading strategy conducted from December 14, 2018, to December 14, 2023, reveal some interesting statistics. The profit factor stands at 1.04, indicating a relatively marginal profitability. The annualized return on investment (ROI) amounts to 0.56%, suggesting a modest but positive performance over the five-year period. On average, the holding time for trades spans approximately 1 week and 3 days, reflecting a relatively short-term trading approach. The strategy generates an average of 0.08 trades per week, which indicates a low trading frequency. Over the test period, there were 23 closed trades, with a winning trades percentage of 34.78%, implying that a significant majority of trades were not successful.
BTCUSDT
Choose another period and try again.
Bitcoin Trading Chart Patterns Explained
BTC (Bitcoin) Chart Patterns: A Comprehensive Guide
Introduction
Chart patterns are essential tools for traders to anticipate Bitcoin's price movements based on historical trends. These patterns provide a visual representation of market psychology and can guide traders in making informed decisions. This comprehensive guide covers the most effective chart patterns for Bitcoin trading and how to use them effectively.
Why Use Chart Patterns in Bitcoin Trading?
- Predictive Power: Patterns indicate potential reversals, continuations, or breakouts.
- Simplicity: Visual cues make patterns easy to recognize and apply.
- Adaptability: Suitable for multiple timeframes, from day trading to long-term investing.
Key Chart Patterns for Bitcoin Trading
1. Reversal Patterns
These patterns indicate a potential change in trend direction.
1.1 Head and Shoulders
Description: A peak (head) with two smaller peaks (shoulders) on either side.
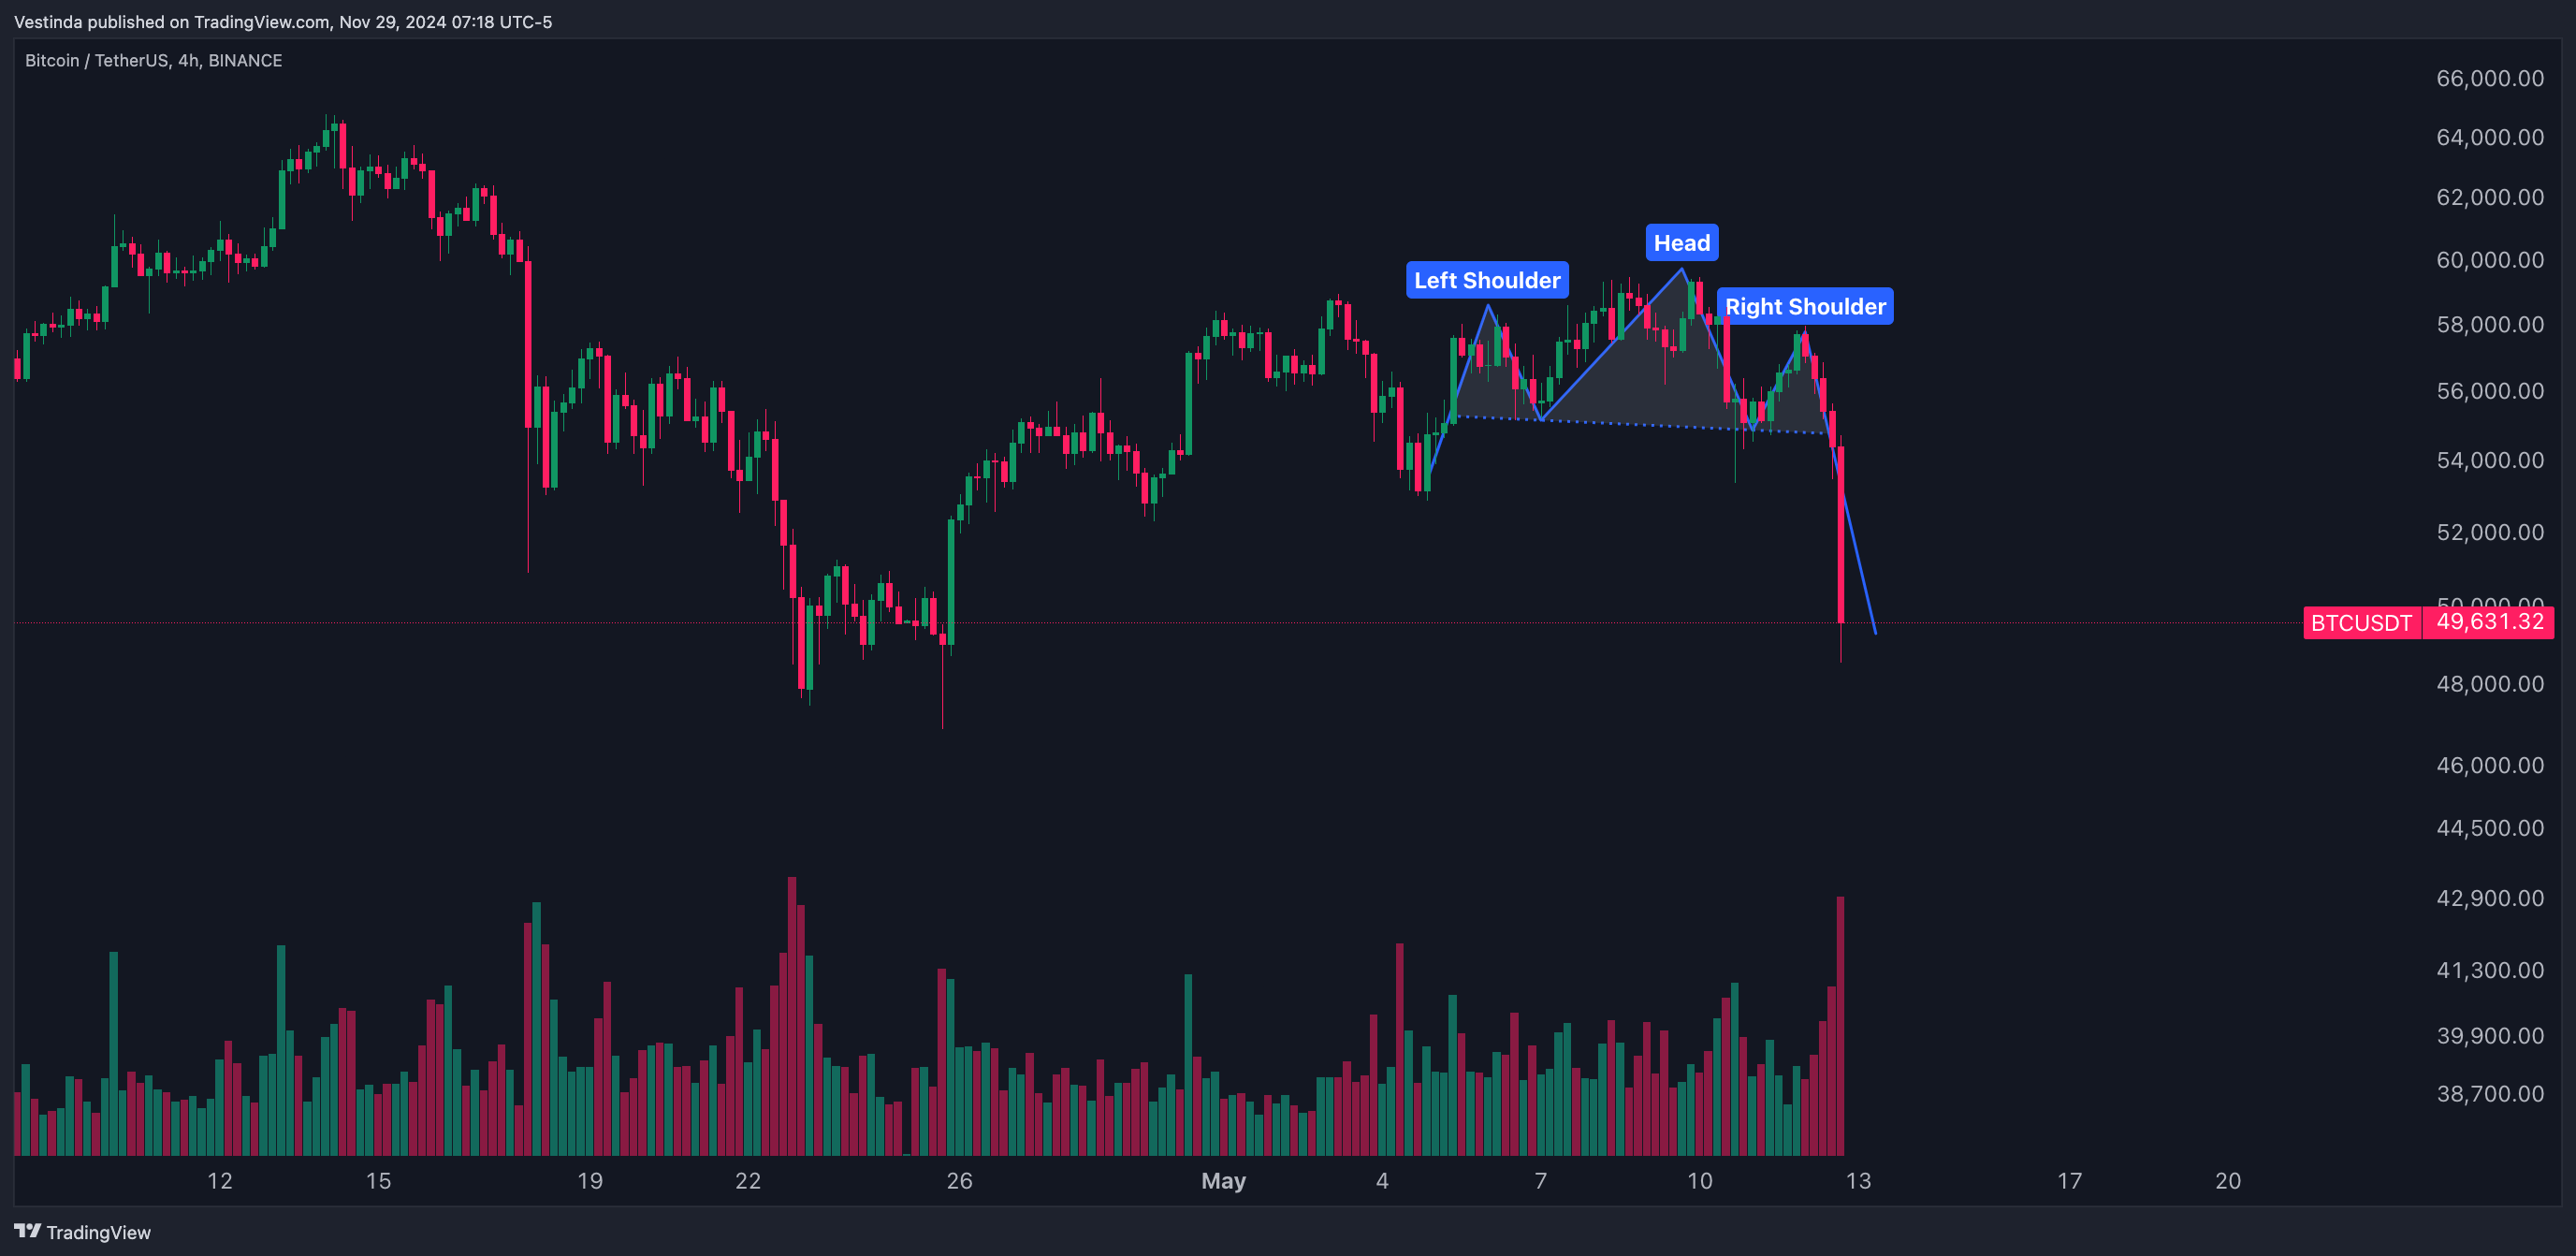
Indicates: A bearish reversal when forming after an uptrend.
Trading Strategy:
- Enter short when the price breaks below the neckline (support).
- Place stop-loss above the right shoulder for protection.
1.2 Double Bottom
Description: Two consecutive lows at approximately the same level.
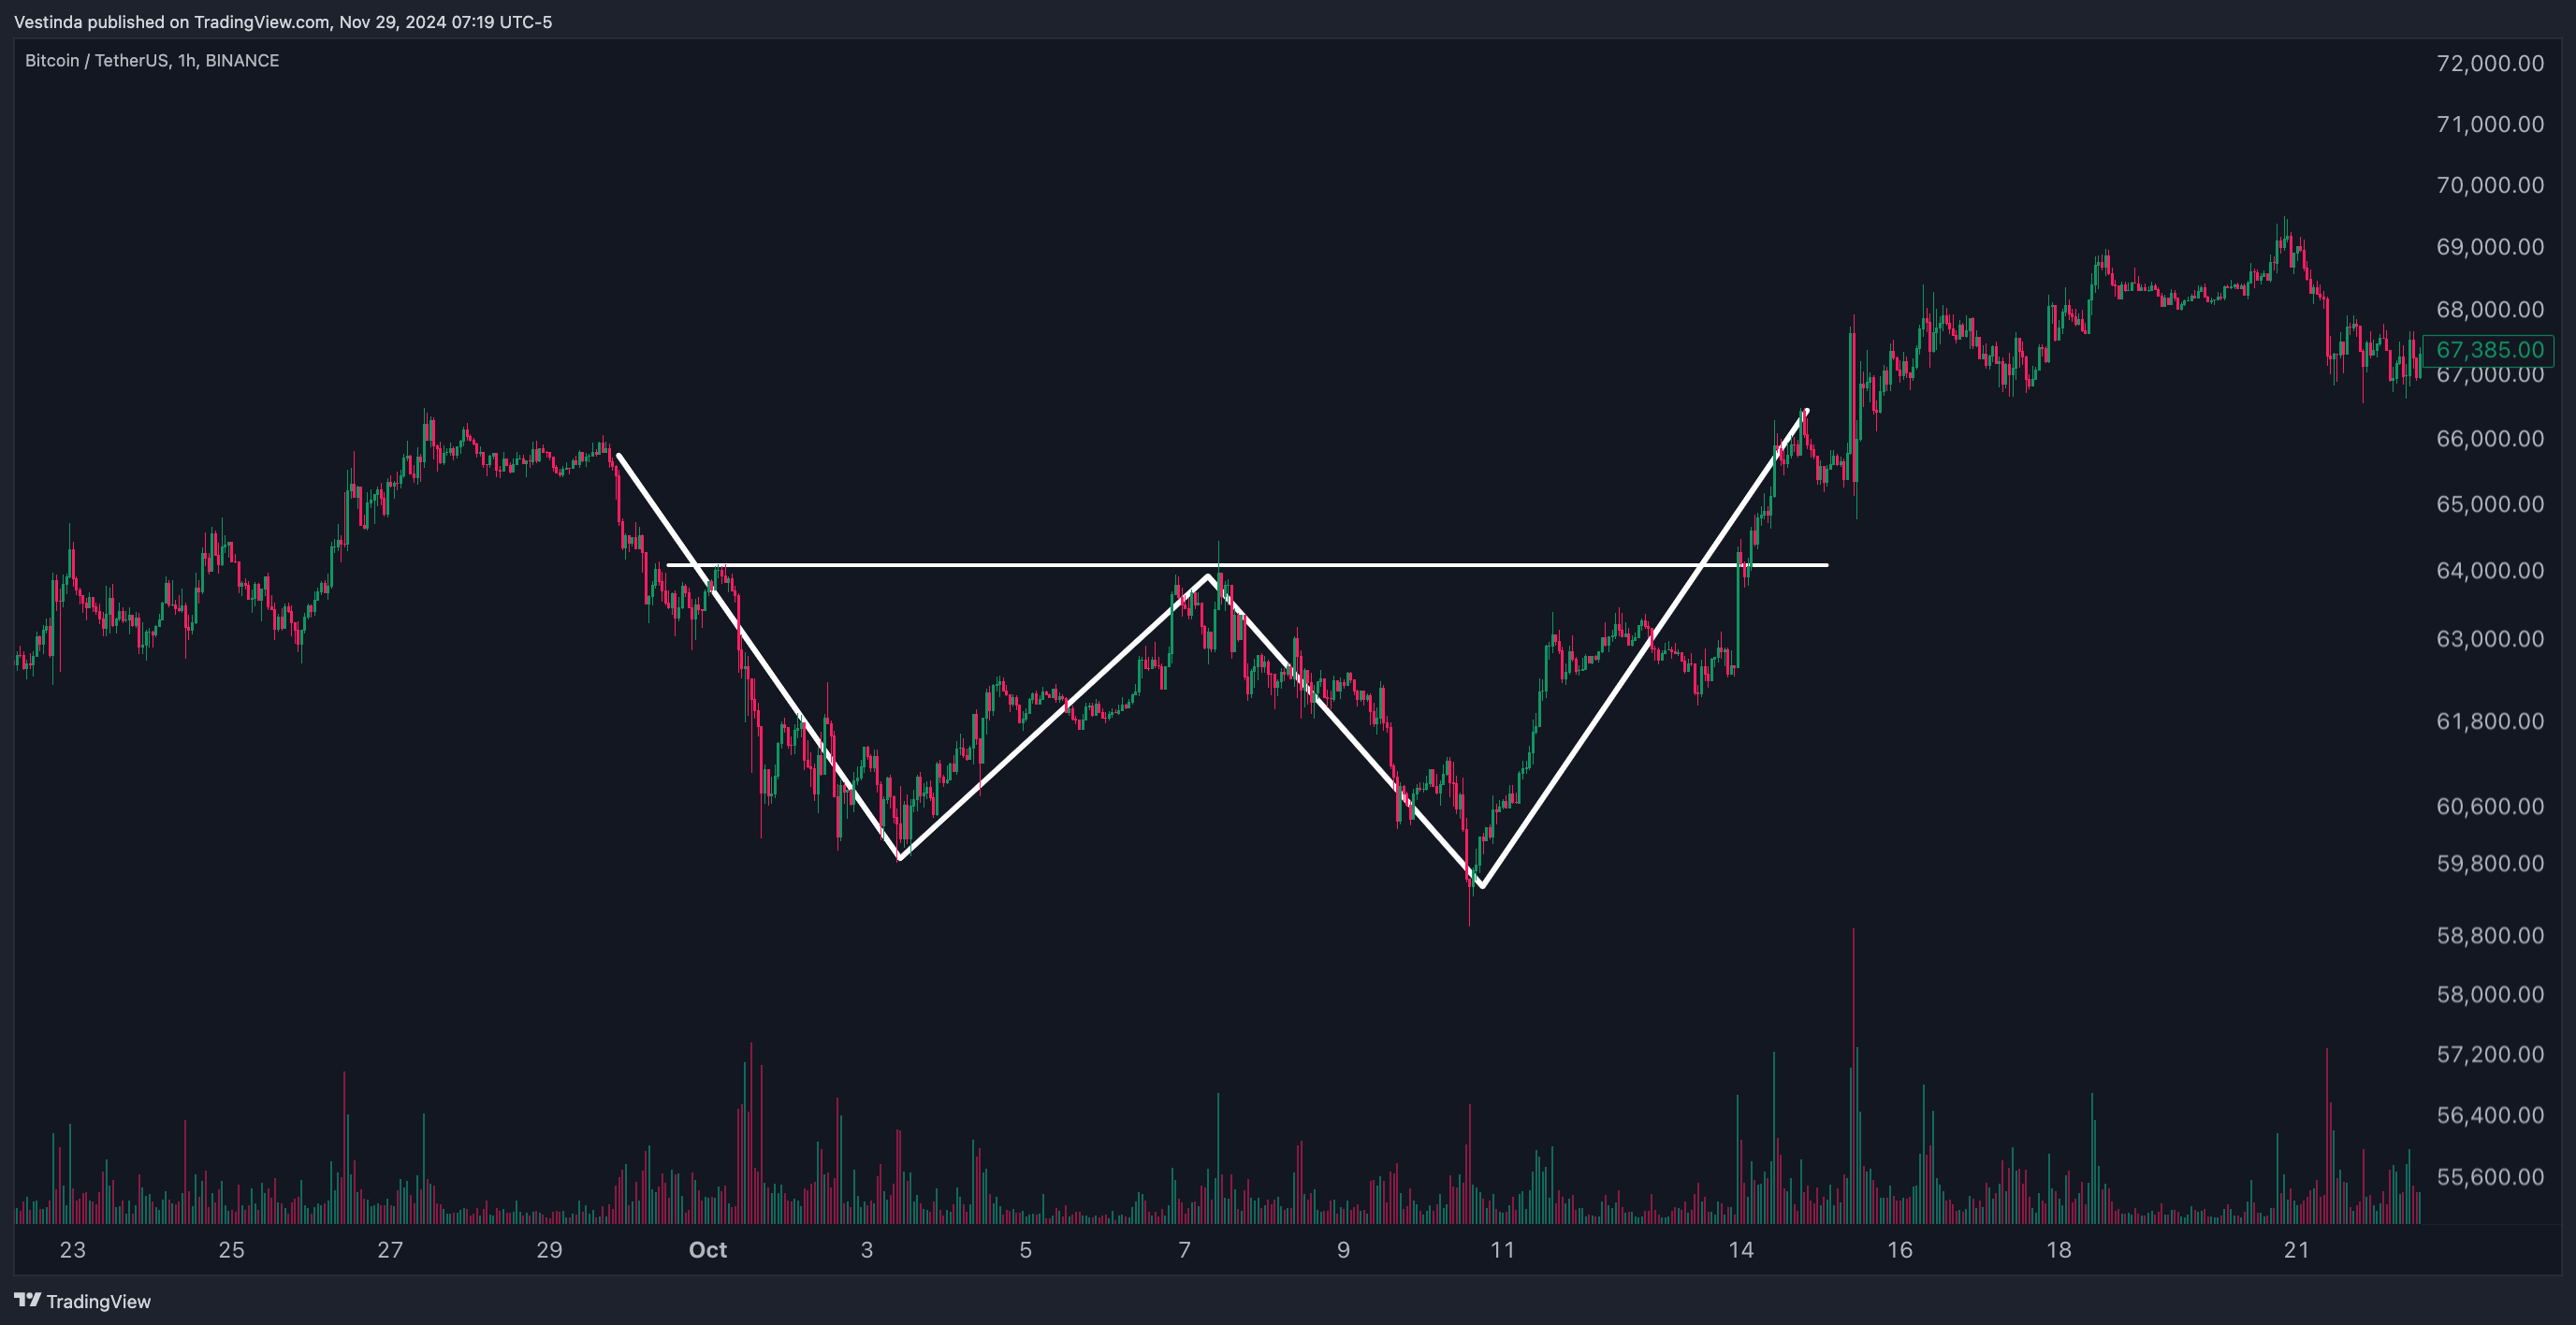
Indicates: A bullish reversal when forming after a downtrend.
Trading Strategy:
- Enter long when the price breaks above the neckline (resistance).
- Place stop-loss below the second low.
2. Continuation Patterns
These patterns suggest the current trend is likely to continue.
2.1 Triangles (Symmetrical, Ascending, Descending)
Description: Consolidation patterns where price converges into a triangle shape.

Indicates: A breakout is imminent, with direction often aligned with the preceding trend.
Trading Strategy:
- Enter long or short depending on the breakout direction.
- Place stop-loss inside the triangle to limit risk.
2.2 Flags and Pennants
Description:
- Flags: Rectangular consolidation following a strong move.
- Pennants: Small symmetrical triangles forming after a sharp movement.
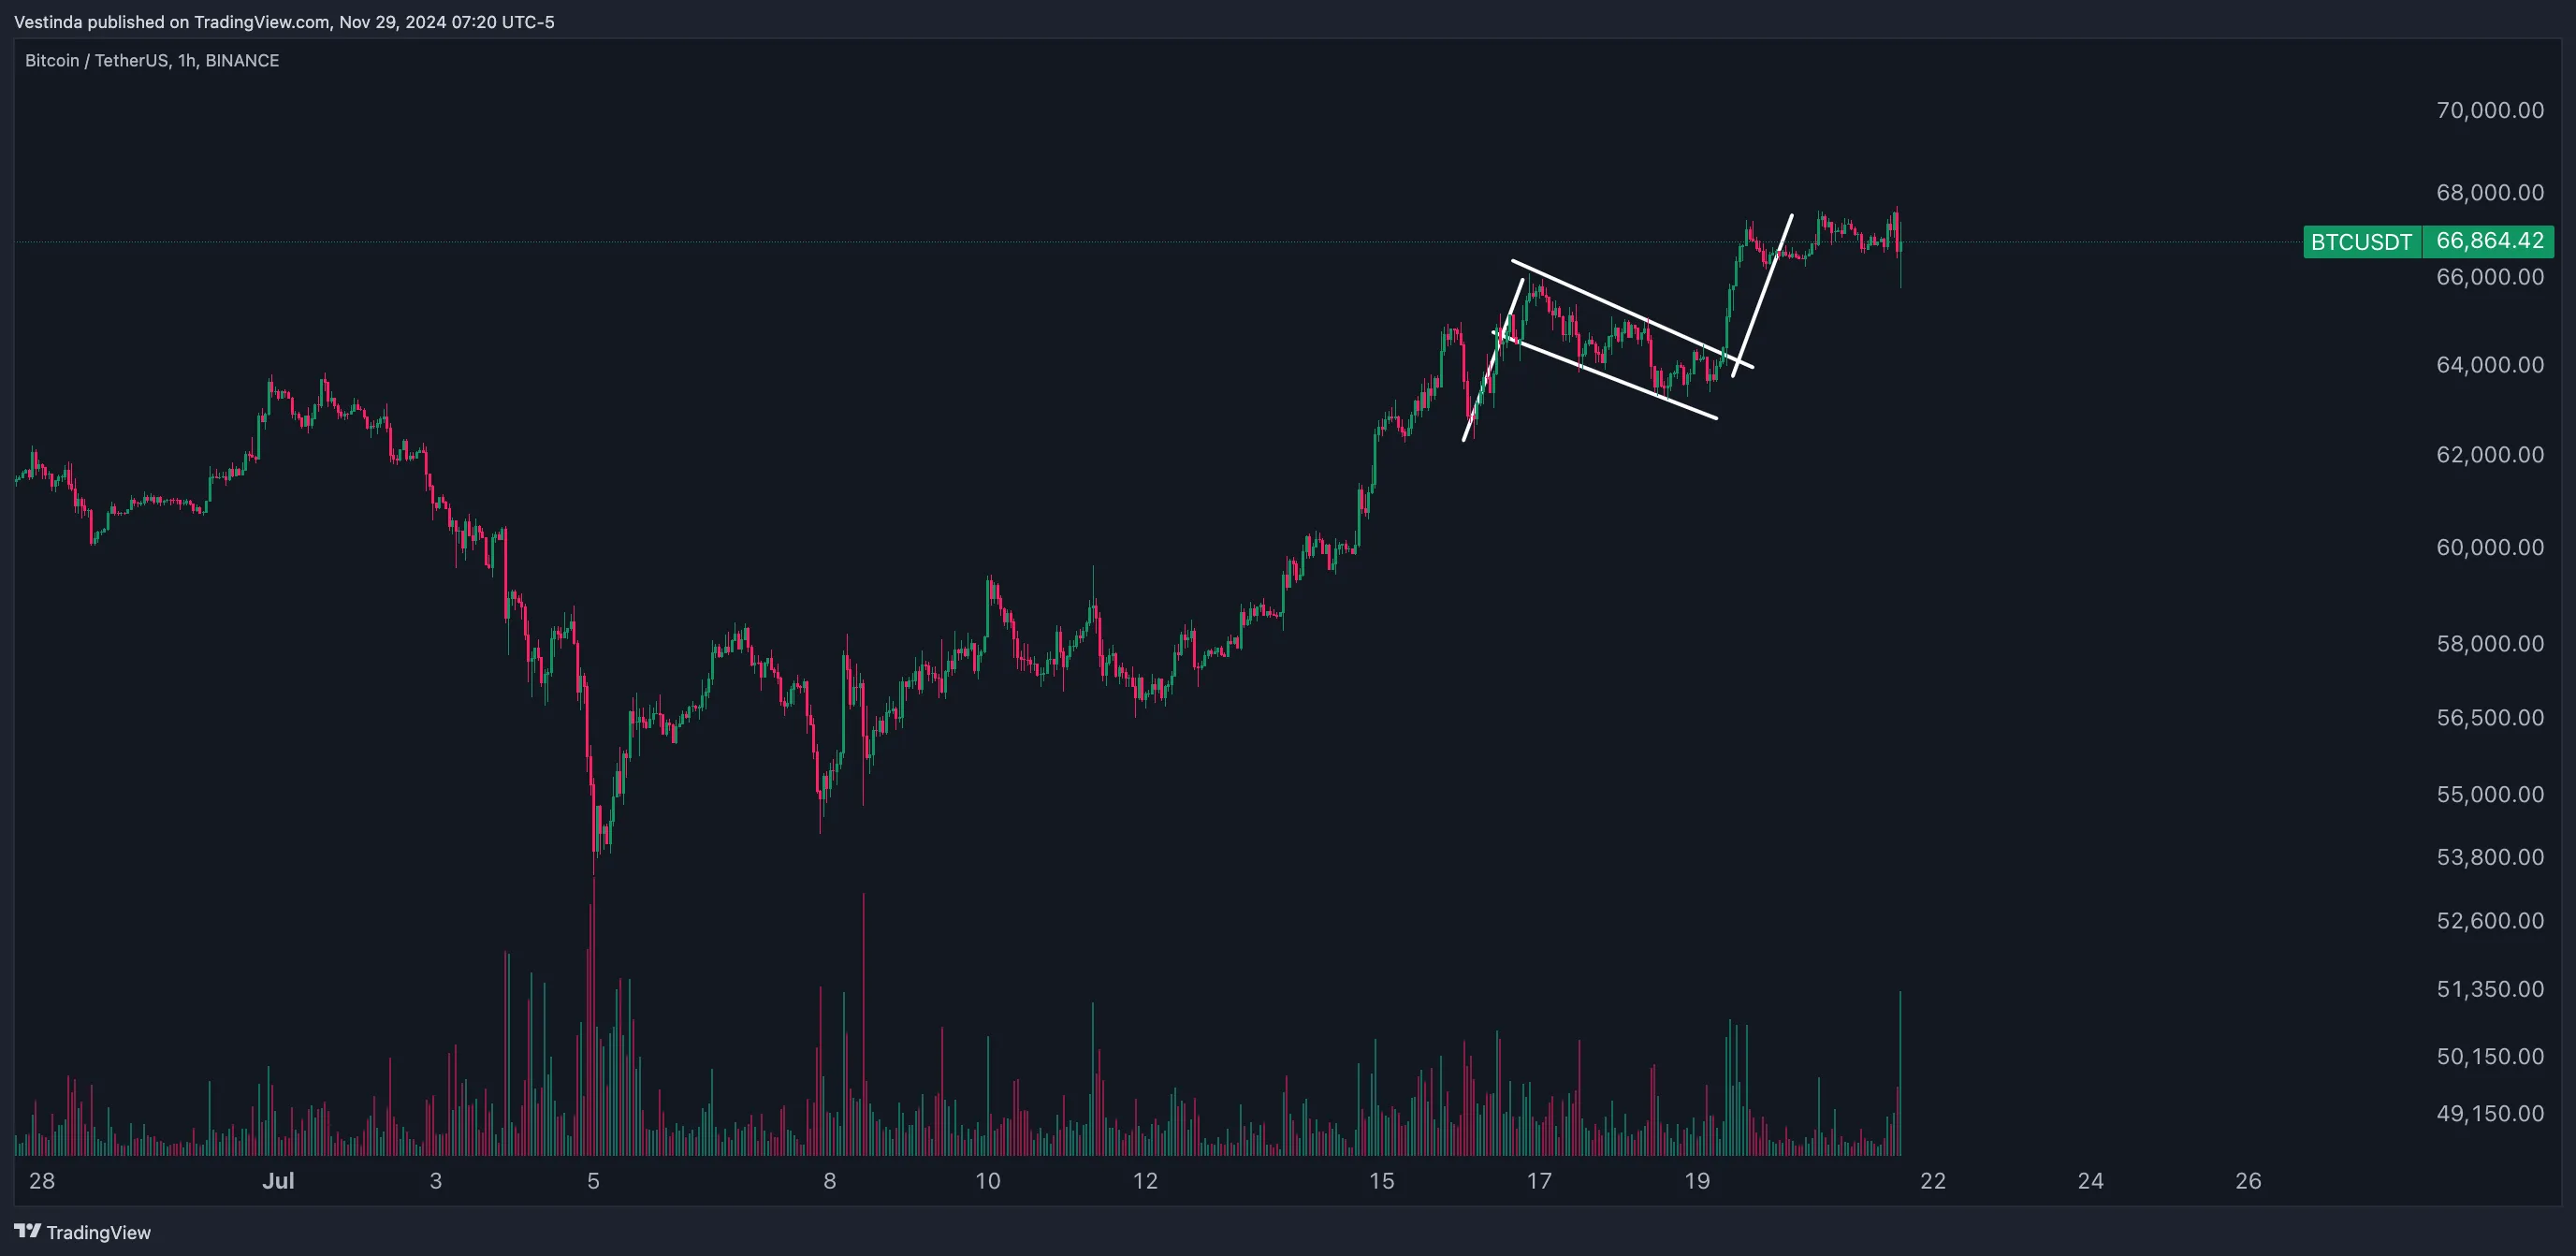
Indicates: A continuation of the preceding trend after a breakout.
Trading Strategy:
- Enter on breakout above the flag/pennant.
- Use the flagpole length to estimate the potential price move.
3. Neutral Patterns
These patterns indicate possible movement in either direction, depending on the breakout.
3.1 Rectangle
Description: Horizontal consolidation between parallel support and resistance levels.
Indicates: A breakout in either direction.
Trading Strategy:
- Buy above resistance or sell below support based on the breakout direction.
3.2 Diamond Pattern
Description: A larger shape that contracts into a smaller one, resembling a diamond.
Indicates: Potential for significant breakout in either direction.
Trading Strategy:
- Wait for a clear breakout to confirm direction before entering the trade.
Practical Tips for Using Chart Patterns
- Combine with Indicators: Use RSI or MACD to confirm pattern-based signals. Example: Confirm a double bottom breakout with RSI exiting oversold territory.
- Monitor Volume: High volume on breakouts strengthens the reliability of the pattern. Example: A head and shoulders breakdown is more reliable with increased selling volume.
- Use Multiple Timeframes: Analyze patterns on higher timeframes for the broader trend. Use lower timeframes for precise entry and exit points.
- Set Targets and Stops: Measure the height of the pattern to estimate potential price targets. Always set a stop-loss to minimize risk.
Common Mistakes to Avoid
- Misinterpreting Patterns: Ensure the pattern is fully formed before trading based on it.
- Ignoring Risk Management: Avoid over-leveraging or neglecting stop-loss placement.
- Trading Patterns in Isolation: Combine patterns with other technical tools for confirmation.
Conclusion
Mastering Bitcoin chart patterns equips traders with the ability to predict price movements and execute well-informed trades. By recognizing key patterns like head and shoulders, triangles, and flags, and combining them with volume and indicators, traders can gain a strategic edge in the market. Consistent practice and disciplined execution are the keys to success.
1. Understand the basics of chart patterns by studying common patterns like triangles, head and shoulders, and double tops.
2. Identify potential chart patterns on BTC's price chart by analyzing historical data and trends.
3. Confirm the pattern by looking for specific criteria such as support and resistance levels, volume, and price action.
4. Determine entry and exit points based on the pattern's completion and projected price movement.
5. Set stop-loss orders to limit potential losses if the pattern fails to play out as expected.
6. Monitor the trade closely and adjust stop-loss levels or take profits accordingly.
7. Continuously update your knowledge of chart patterns and market conditions to improve decision-making.
8. For more accurate analysis, combine chart patterns with other technical indicators and fundamental analysis.
BTC Rounded Patterns Implications
The rounded top and bottom patterns in BTC charts indicate a potential trend reversal. These patterns suggest that buyers or sellers are losing momentum, leading to a shift in market sentiment. When a rounded top pattern forms, it indicates that buyers are struggling to push the price higher, and a potential downtrend may follow. On the other hand, a rounded bottom pattern suggests that sellers are losing control, and a potential uptrend may occur. Traders and investors use these patterns to make informed decisions about their BTC positions. However, it is essential to consider other technical indicators and market factors before making any trading decisions based solely on these patterns.
Confirming BTC chart patterns with trendlines.
Using trendlines can be a powerful tool to confirm chart patterns in BTC trading. Trendlines are drawn by connecting the highs (in a downtrend) or lows (in an uptrend) on a price chart. They provide a visual representation of the market's direction and can help traders identify potential trend reversals. By drawing trendlines on a chart pattern, such as a triangle or head and shoulders pattern, traders can gain additional confidence in the validity of the pattern. If the price breaks above or below a trendline, it can signal a breakout or breakdown, indicating that the chart pattern is more likely to follow through. This information can assist traders in making better-informed decisions when entering or exiting a trade.
Synergistic Analysis: Unifying Multiple BTC Indicators
When analyzing the market, it's important to consider multiple indicators. Combining different indicators can provide a more comprehensive view of the Bitcoin market. These indicators can include moving averages, MACD, RSI, and volume analysis. Moving averages help identify trends by smoothing out price fluctuations over a specific time period. MACD (Moving Average Convergence Divergence) measures momentum and trend strength. RSI (Relative Strength Index) indicates overbought or oversold conditions. Volume analysis looks at the number of shares or contracts traded in a security or market. By combining these indicators, traders can gain a more robust understanding of the market's movements and make better-informed decisions. It's important to note that no single indicator can provide all the necessary information, and using multiple indicators offers a more complete picture.






Frequently Asked Questions
Yes, chart patterns can be applied to identify trend continuation in BTC. Patterns like ascending triangles, flag patterns, and bull flags can suggest that the ongoing trend is likely to continue. These patterns indicate temporary pauses or consolidations within an uptrend, implying that buying pressure is still strong. Traders often look for breakout confirmations from these patterns to enter or stay in trend trades. However, it is important to consider other factors, like volume and fundamental analysis, to increase the reliability of trend continuation predictions.
Chart patterns can be valuable tools for decision-making in BTC swing trading. Traders can identify patterns such as triangles, flags, and head and shoulders formations to anticipate potential price movements. By analyzing these patterns, traders can establish entry and exit points, set stop-loss levels, and determine profit targets. Additionally, they can use technical indicators and volume analysis to confirm or validate the patterns. It is crucial to combine chart patterns with other forms of analysis and risk management strategies for effective decision-making in BTC swing trading.
Chart patterns can still provide valuable insights in low-volume BTC CRYPTO markets, though their accuracy may be affected. In low-volume scenarios, it is ideal to use higher timeframes to reduce noise and enhance pattern reliability. While patterns like triangles, head and shoulders, or double tops may occur in low-volume markets, they might not generate significant price movements. Traders should exercise caution and consider using additional indicators or factors to reinforce their analysis in such conditions.
The top reversal pattern in technical analysis is the head and shoulders pattern. It is formed by three peaks, with the middle peak being the highest (the head) and the other two peaks (the shoulders) being slightly lower. This pattern indicates a potential trend reversal from an uptrend to a downtrend. Traders often look for a break below the neckline, which connects the lows of the two shoulders, as a confirmation of the reversal. The head and shoulders pattern is considered one of the most reliable and commonly used patterns for predicting reversals in price trends.
Conclusion
In conclusion, BTC (Bitcoin) Chart Patterns serve as valuable tools for traders in the cryptocurrency market. By understanding and recognizing these patterns, traders can make informed decisions and capitalize on potential price movements. However, it's important to consider other technical indicators and market factors when using chart patterns for trading. Trendlines can be a powerful tool to confirm chart patterns and provide additional confidence in their validity. Additionally, combining different indicators such as moving averages, MACD, RSI, and volume analysis can offer a more comprehensive view of the market. Continuous learning and updating knowledge of chart patterns and market conditions is crucial for effective decision-making in BTC trading.

Successful traders rely on backtesting to be profitable.
Be like them with our
Free Backtesting Guide