
-
100,000 available assets New
-
years of historical data
-
practice without risking money

Quant Strategies & Backtesting results for BTC
Here are some BTC trading strategies along with their past performance. You can validate these strategies (and many more) for free on Vestinda across thousands of assets and many years of historical data.
Quant Trading Strategy: MVWAP and VWAP Crossover on BTC
Based on the backtesting results for the trading strategy from December 16, 2018, to December 16, 2023, the strategy demonstrated promising performance. The profit factor stands at 1.42, indicating a relatively stable and favorable return to risk ratio. The annualized ROI recorded an impressive 95.38%, exhibiting the strategy's ability to generate significant returns over time. The average holding time for trades was approximately 2 weeks and 5 days, suggesting a medium-term approach. With an average of 0.19 trades per week, the strategy displayed a conservative trading frequency. Over the course of the backtesting period, there were 51 closed trades, with a return on investment of 476.89%. Although the winning trades percentage was 41.18%, the strategy's overall performance suggests its potential for profitable trading opportunities.

 BTCUSDT

Choose another period and try again.
Quant Trading Strategy: ZLEMA Crossover with Increased Price Variance on BTC
Based on the backtesting results from December 14, 2018, to December 14, 2023, the trading strategy exhibited a profit factor of 1.04, indicating slight profitability. The annualized return on investment (ROI) was 0.56%, which suggests a relatively low but positive growth rate over the tested period. The average holding time for trades was approximately 1 week and 3 days, highlighting a moderately short-term approach. With an average of 0.08 trades per week, the strategy seemed to be relatively infrequent. Out of the 23 closed trades, around 34.78% were winning trades, indicating the need for further refinement to improve the strategy's success rate. Nonetheless, the overall return on investment was 2.8%, indicating some potential for profitability.
BTCUSDT
Choose another period and try again.
BTC (Bitcoin) Candlestick Patterns: Unlocking Profitable Trading Strategies
Introduction
Candlestick patterns are invaluable tools for Bitcoin traders, providing a visual representation of market psychology. By understanding these patterns, traders can anticipate price movements and improve their decision-making. This guide highlights key candlestick patterns and how to leverage them for profitable Bitcoin trading.
Why Use Candlestick Patterns for Bitcoin?
- Immediate Insights: Candlestick formations offer quick insights into market sentiment.
- Versatility: Effective across various timeframes, from scalping to swing trading.
- Actionable Signals: Help identify entry and exit points with precision.
Essential Bitcoin Candlestick Patterns
1. Bullish Reversal Patterns
These patterns indicate a potential upward trend reversal.
1.1 Hammer
Description: A small body with a long lower shadow, usually forming after a downtrend.
What It Suggests: Strong buying pressure at lower prices, signaling a potential reversal.
Trading Strategy:
- Enter long when the next candle closes above the hammer’s high.
- Place stop-loss below the hammer’s low.
1.2 Bullish Engulfing
Description: A green candle fully engulfs the previous red candle.
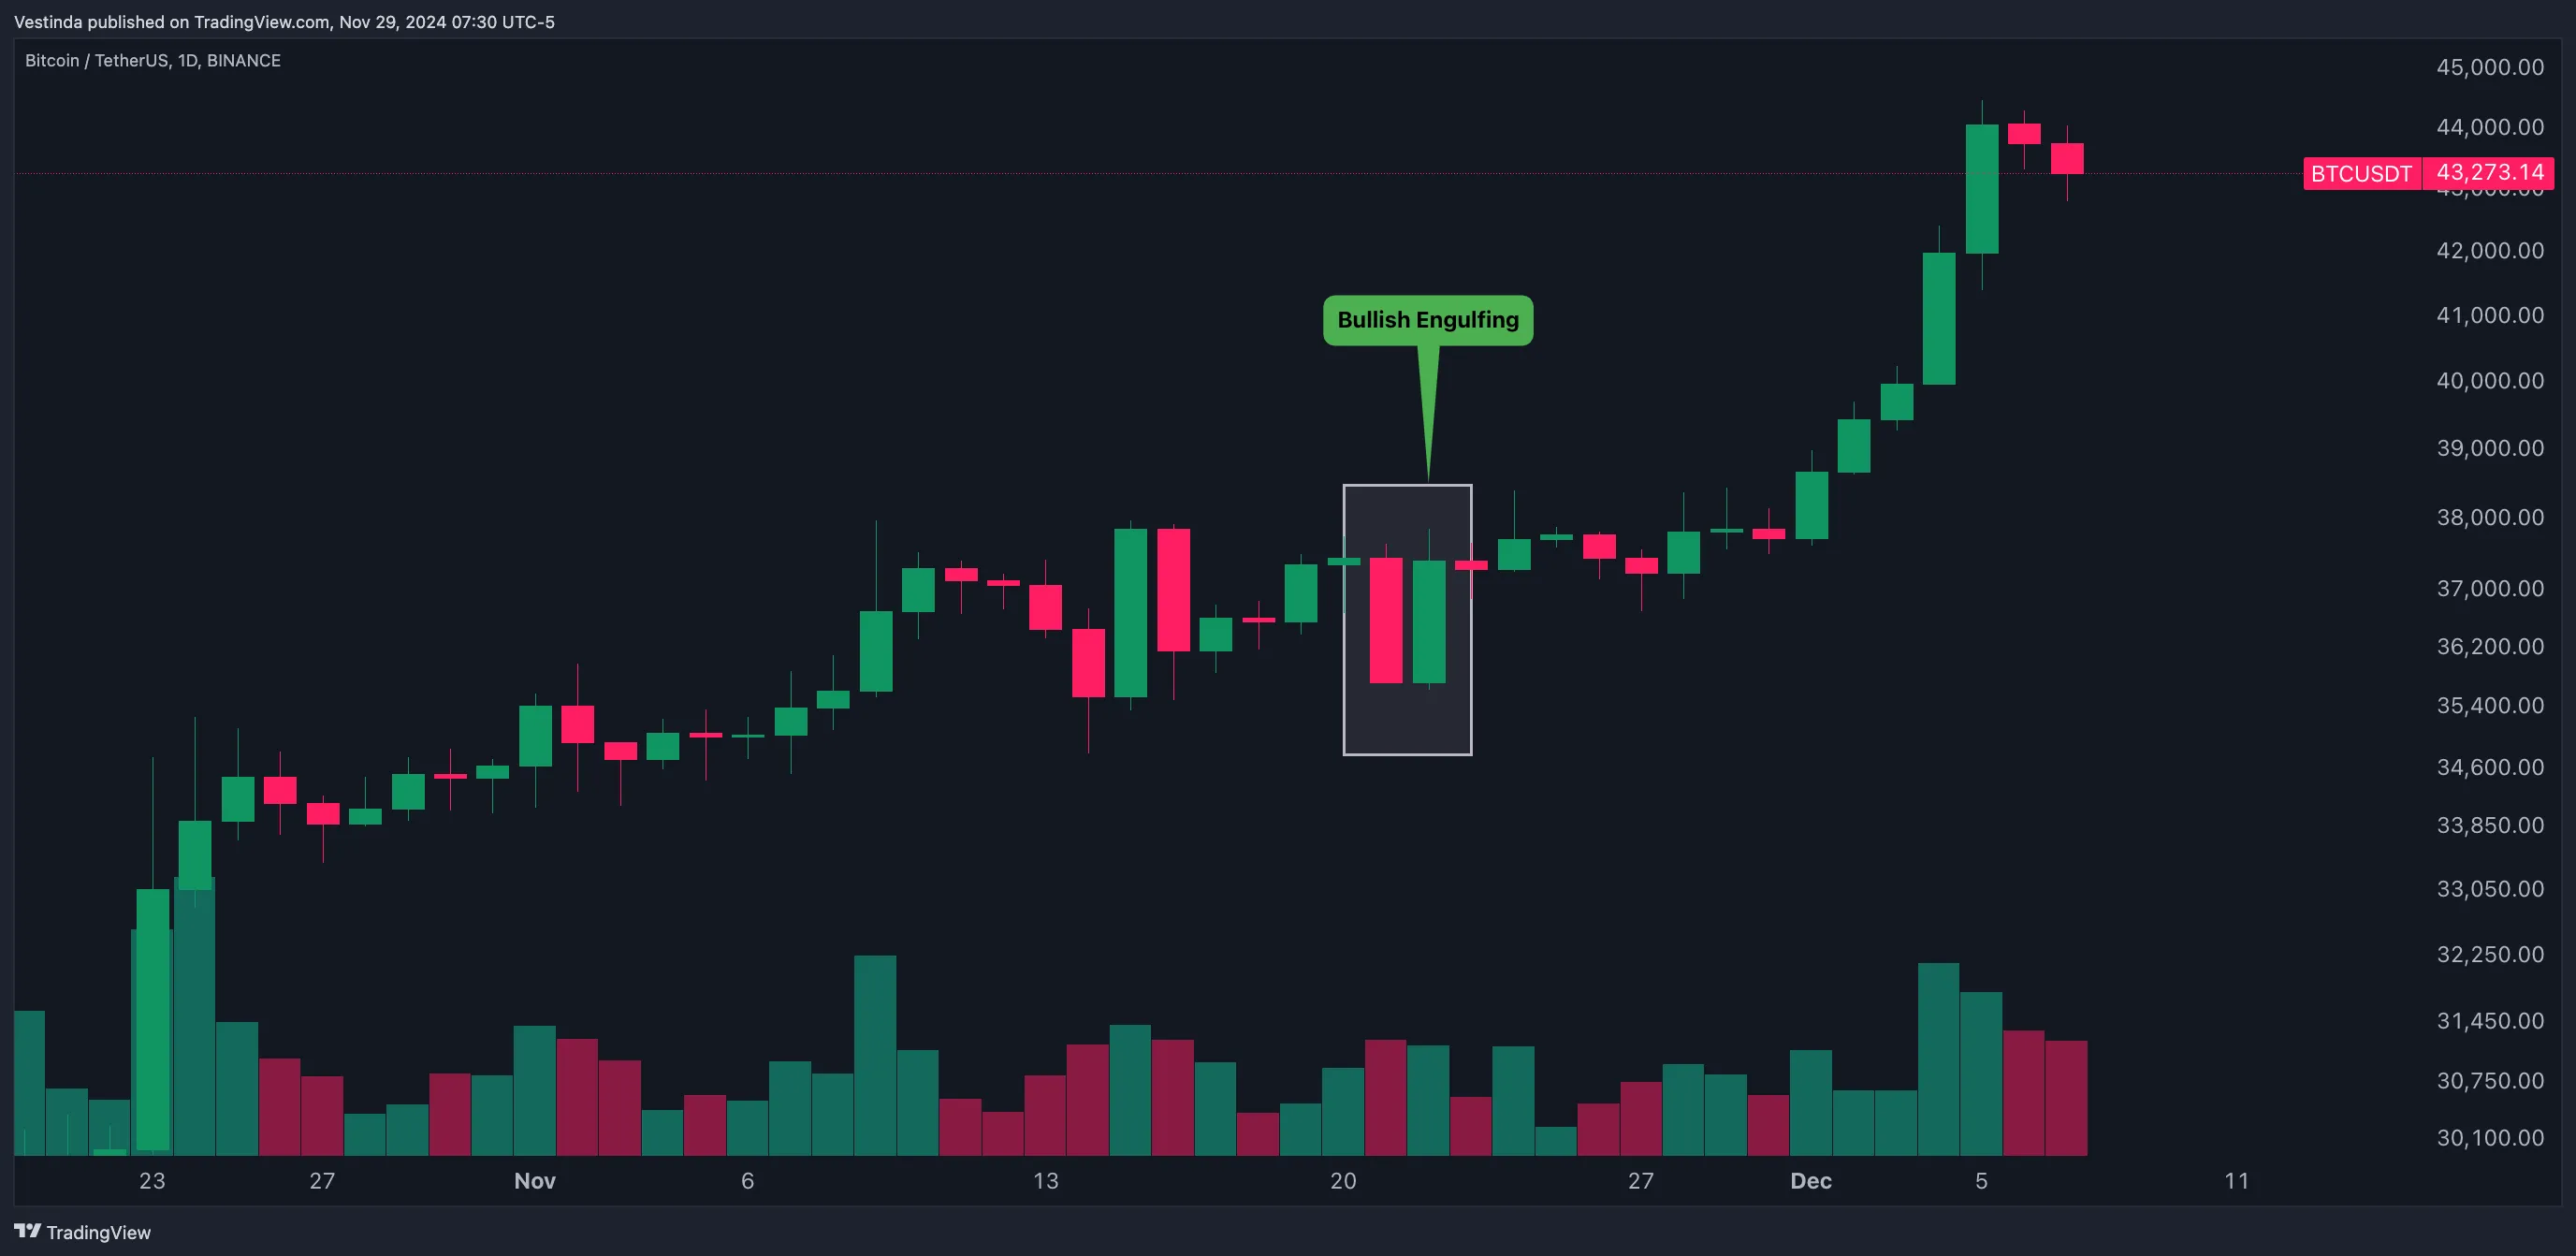
What It Suggests: Renewed buying momentum, reversing the downtrend.
Trading Strategy:
- Enter long after the engulfing candle closes above its high.
- Set stop-loss below the engulfing candle’s low.
2. Bearish Reversal Patterns
These patterns signal a potential downward trend reversal.
2.1 Shooting Star
Description: A small body with a long upper shadow, typically appearing after an uptrend.
What It Suggests: Rejection of higher prices, indicating potential bearish reversal.
Trading Strategy:
- Enter short when the next candle closes below the shooting star’s low.
- Place stop-loss above the shooting star’s high.
2.2 Bearish Engulfing
Description: A red candle fully engulfs the previous green candle.
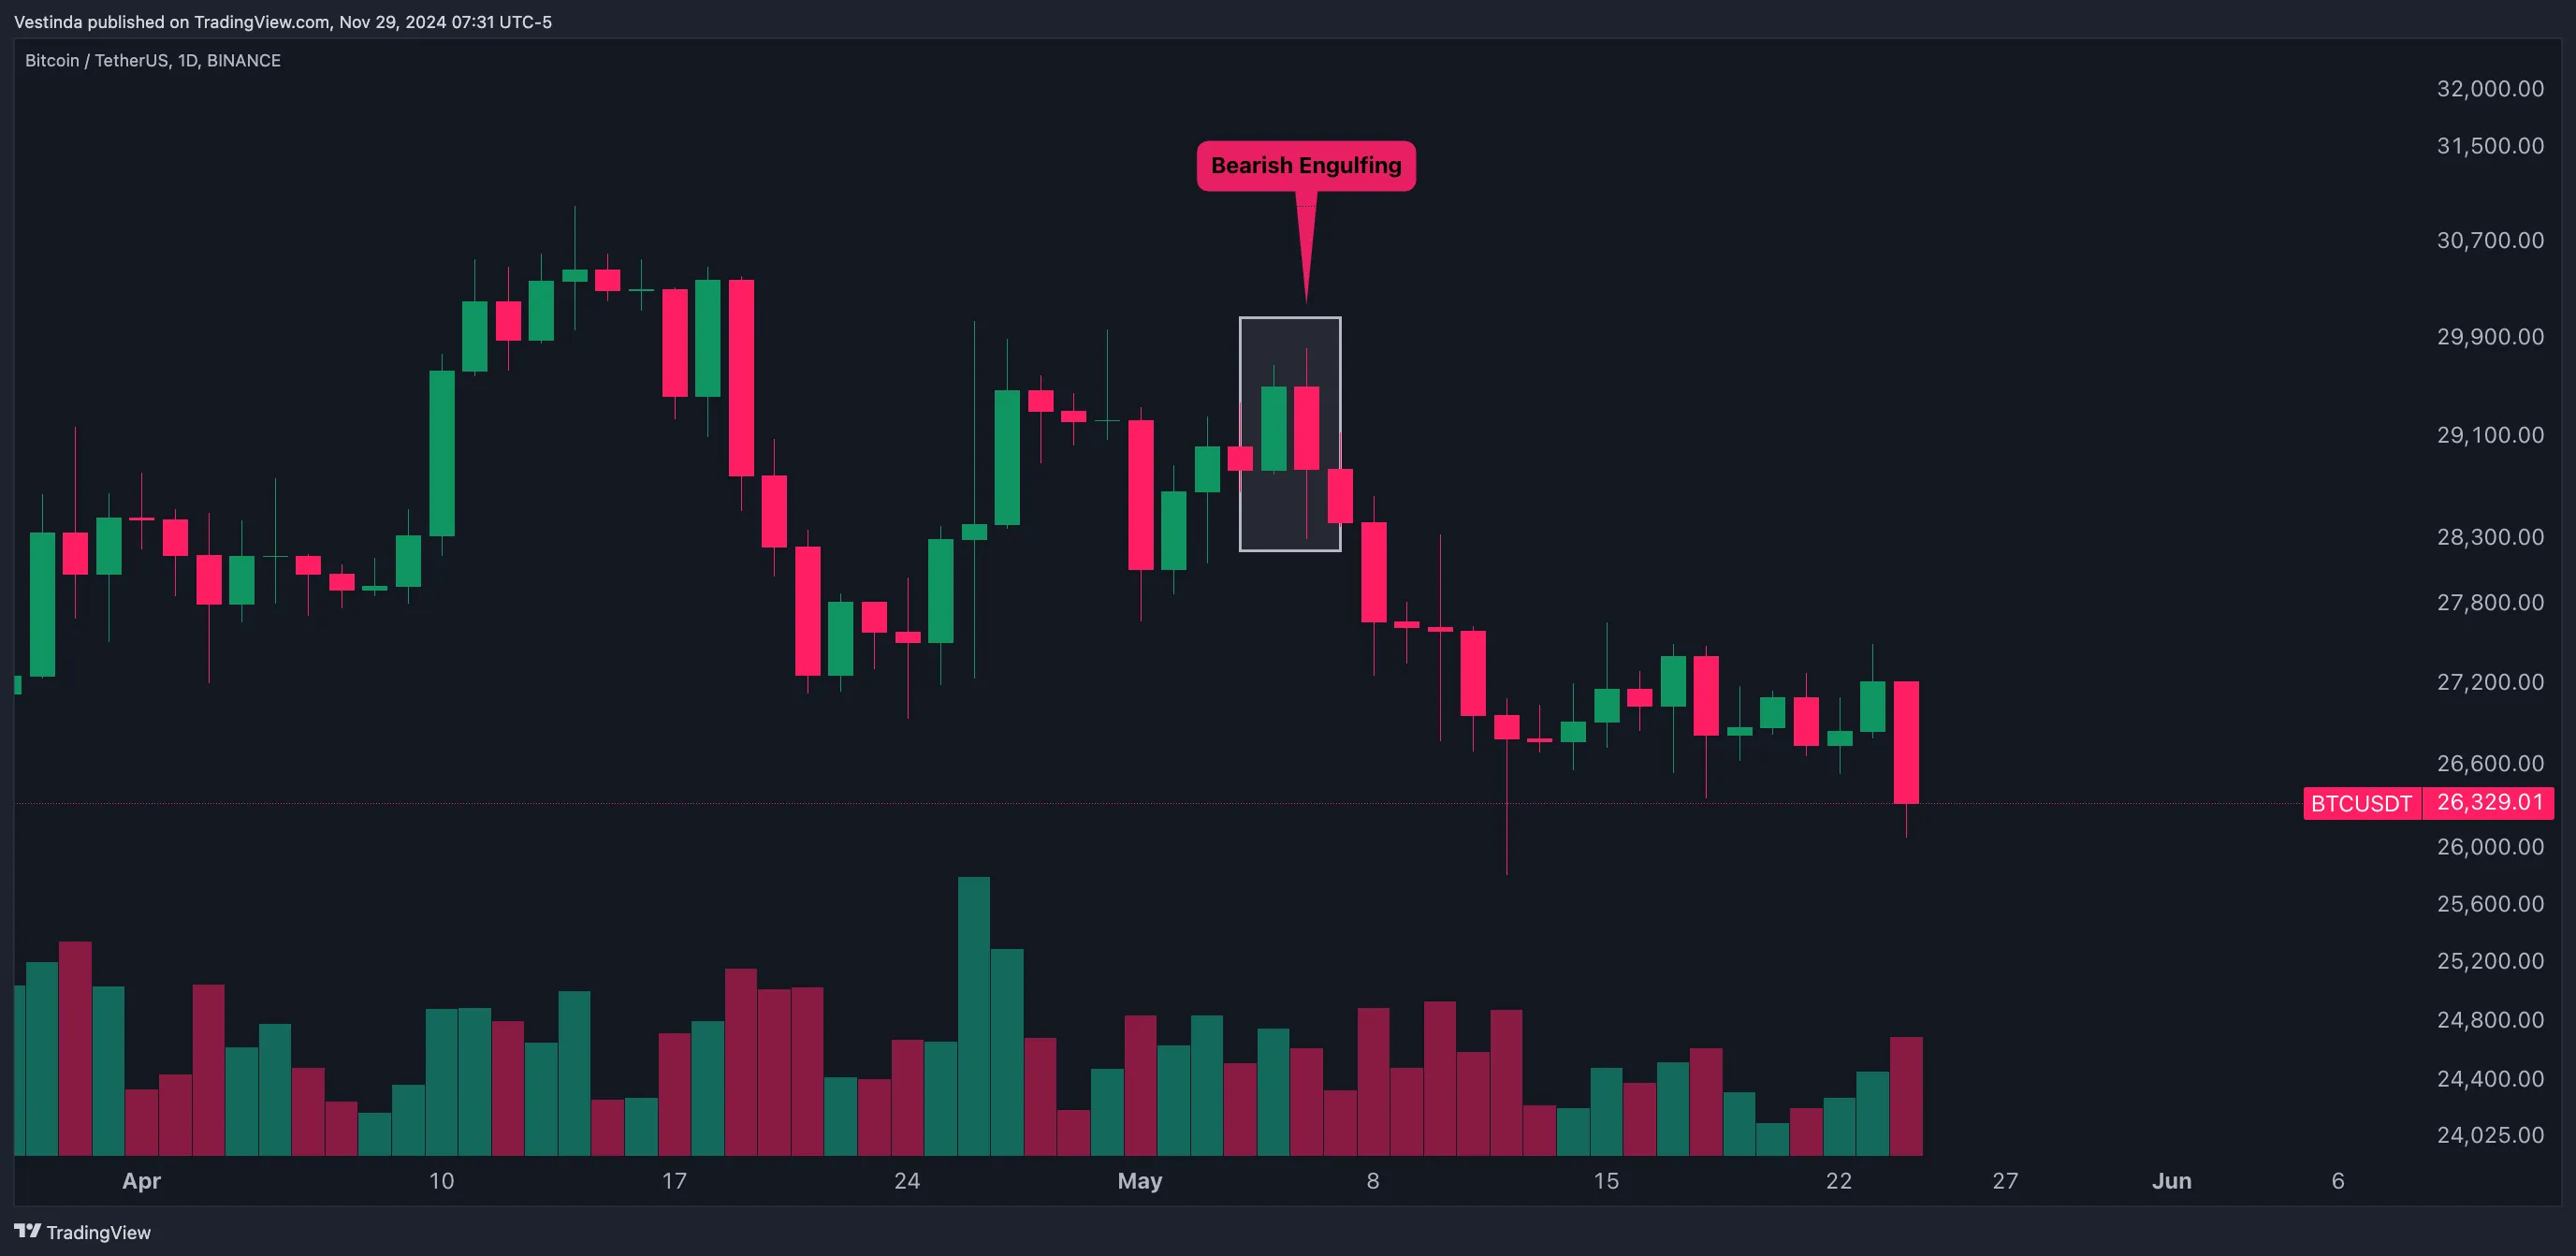
What It Suggests: Increased selling pressure, reversing the uptrend.
Trading Strategy:
- Enter short after the engulfing candle closes below its low.
- Set stop-loss above the engulfing candle’s high.
3. Continuation Patterns
These patterns suggest the trend will likely continue in the same direction.
3.1 Doji
Description: A candle with a very small or no body, reflecting market indecision.
What It Suggests: A pause before the trend continues, depending on the following candle.
Trading Strategy:
- Wait for the next candle’s direction to confirm the trend continuation.
3.2 Marubozu
Description: A full-bodied candle with no wicks, indicating strong momentum.
What It Suggests: A continuation of the prevailing trend.
Trading Strategy:
- Trade in the direction of the Marubozu with a stop-loss at the candle’s midpoint.
How to Trade Bitcoin Using Candlestick Patterns
- Combine Patterns with Indicators: Use RSI or MACD to validate candlestick-based signals. Example: Confirm a bullish hammer with RSI exiting the oversold zone.
- Align Patterns with Key Levels: Look for candlestick patterns near support or resistance levels for stronger setups. Example: A bullish engulfing pattern at support often indicates a reliable reversal.
- Set Clear Entry and Exit Rules: Define criteria for entering and exiting trades based on pattern confirmation and market context.
Common Mistakes to Avoid
- Ignoring Confirmation: Always wait for the next candle to validate the pattern.
- Overtrading: Focus on high-probability setups instead of chasing every pattern.
- Neglecting Risk Management: Use stop-loss orders to protect against unexpected market moves.
Advanced Tips for Bitcoin Candlestick Trading
- Timeframe Matters: Use shorter timeframes for intraday trades and longer timeframes for swing or position trading.
- Monitor Volume: High volume strengthens the reliability of candlestick signals.
- Backtest Strategies: Analyze past performance of candlestick patterns in Bitcoin’s market to refine your approach.
Conclusion
Mastering candlestick patterns equips traders with a powerful tool to navigate Bitcoin’s volatile market. By combining these patterns with technical indicators and disciplined risk management, traders can unlock consistent profitability. Whether you’re a beginner or an experienced trader, understanding candlestick dynamics is a fundamental skill for success.
Bitcoin Trading: Mastering Candlestick Patterns
- Learn the basic candlestick patterns: doji, hammer, shooting star, etc.
- Identify these patterns on BTC price charts to spot possible market trend reversals.
- If a bullish pattern appears, consider buying BTC as the price may increase.
- If a bearish pattern emerges, consider selling BTC as the price may decrease.
- Confirm the pattern with other technical indicators, such as volume or trendlines.
- Set appropriate stop-loss orders to limit potential losses in case the pattern fails.
Candlestick Patterns: Enhancing BTC Risk Management
Candlestick patterns are widely used in Bitcoin risk management due to their predictive power. These patterns can help traders identify potential reversal points and make informed decisions. By analyzing the different candlestick formations, such as doji, hammer, and engulfing, traders can gauge the market sentiment and determine the best time to buy or sell BTC. For example, a doji pattern may indicate indecision in the market, while a hammer pattern could suggest a potential reversal from a downtrend. By incorporating candlestick patterns into their risk management strategy, traders can increase their chances of making profitable trades while minimizing potential losses. It is important to keep in mind that candlestick patterns should not be the sole basis for decision-making but used in conjunction with other technical indicators and analysis.
Doji Star Patterns in BTC's Morning and Evening
Morning Doji Star and Evening Doji Star are two candlestick patterns commonly used in technical analysis to identify potential reversals in the price of an asset, such as BTC.
The Morning Doji Star appears in a downtrend, consisting of three candles. The first candle is a long bearish candle, followed by a second candle with a small body ("doji") that gaps below the first candle. The third candle is a bullish candle that confirms the reversal.
In contrast, the Evening Doji Star appears in an uptrend. It also consists of three candles, starting with a long bullish candle followed by a doji that gaps above the previous candle. The third candle is a bearish candle signaling the potential reversal.
These patterns suggest the sentiment of the market is changing, indicating a possible trend reversal. However, traders should use these patterns in conjunction with other technical indicators and confirmations before making any trading decisions.
Candlestick Patterns: Analyzing BTC Trend Strength
Candlestick patterns are effective tools for analyzing the trend strength of BTC. These patterns visually represent price movements over a specific time period, providing insights into market sentiment. The length and shape of the candlesticks can indicate whether buyers or sellers have more control. For example, long green candlesticks suggest strong buying pressure, while long red ones indicate significant selling pressure. Additionally, the presence of wicks or shadows can reveal market indecision. Combining multiple candlesticks can form more complex patterns, such as doji, hammers, or engulfing patterns, each with different implications for trend strength. Traders can use these patterns to make informed decisions about entering or exiting BTC positions, as well as identifying potential trend reversals.
Candlestick insights for Bitcoin price projections
Candlestick patterns can be used as a powerful tool for predicting BTC price movements. These patterns provide valuable insights into market psychology and can help traders make informed decisions. By analyzing the various candlestick formations, such as doji, engulfing, and hammer patterns, traders can identify potential trend reversals or continuations. For example, a bullish engulfing pattern may signal an upcoming price increase, while a bearish shooting star pattern could indicate a potential decline. However, it is important to note that candlestick patterns should not be used in isolation but should be combined with other technical indicators and fundamental analysis for more accurate predictions. Traders who understand and apply these patterns can enhance their ability to forecast BTC price movements and potentially improve their trading strategies.
-
Track your
Crypto Portfolio -
Copy Crypto trading
strategies -
Build trading strategies
with no code
-
Backtest trading strategies
on Crypto, Forex, Stocks, etc. -
Demo Trading
Risk-free Paper Trading -
Automate trading strategies
with Live Trading
Frequently Asked Questions
A bearish engulfing pattern is a crucial signal in candlestick analysis that indicates a potential reversal of an upward trend. It occurs when a small bullish candle is engulfed by a larger bearish candle in the subsequent period. This pattern suggests a shift in market sentiment from bullish to bearish, as selling pressure becomes dominant. Traders pay attention to this pattern because it signifies a possible trend reversal and may prompt them to take short positions or liquidate existing long positions. It is a significant signal that can assist traders in making informed decisions when analyzing price action.
A Japanese candlestick is a tool used in technical analysis of financial markets. It is a graphical representation of price movements over a given period. Each candlestick consists of a rectangular body with lines called wicks or shadows. The body represents the opening and closing prices, while the wicks denote the highest and lowest prices during that time frame. Candlesticks provide visual cues about market sentiment and can indicate trends, reversals, and potential trading opportunities. They originated in Japan in the 17th century and have become widely used by traders and investors worldwide to analyze price patterns.
Yes, candlestick patterns can be used for swing trading. Candlestick patterns provide valuable information about the price action and market sentiment, making them effective tools for swing traders. Patterns such as doji, hammer, engulfing, and shooting star can indicate potential reversals or continuations in the price trend. Swing traders can use these patterns to identify entry and exit points, manage risk, and make informed trading decisions. However, it is important to consider other technical indicators and fundamental analysis to confirm the signal given by candlestick patterns and increase the chances of successful swing trading.
To use candlestick patterns with moving averages, start by identifying a trend using the moving average line. Next, confirm the trend direction using candlestick patterns like bullish engulfing, hammer, or doji. When the moving average confirms an uptrend and a bullish candlestick pattern forms, it may indicate a potential buying opportunity. Conversely, in a downtrend, a bearish candlestick pattern could be a signal to consider selling. However, it's crucial to use additional technical analysis tools and indicators to validate the signals and avoid false or misleading patterns.
Yes, candlestick patterns can be useful in determining stop-loss levels. Certain candlestick patterns, such as the bearish engulfing pattern or the shooting star pattern, can indicate potential reversals or trend changes. Traders can use these patterns as signals to set their stop-loss levels. For example, placing a stop-loss just above the high of a bearish engulfing pattern can help limit losses if the reversal occurs. However, it is important to combine candlestick patterns with other technical analysis tools to confirm stop-loss levels and consider risk-management strategies.
Conclusion
In conclusion, BTC (Bitcoin) Candlestick Patterns play a crucial role in cryptocurrency trading. By analyzing these patterns, traders can assess market sentiment and make informed decisions. Understanding the meaning and significance of these patterns is vital for successful BTC trading. It is important to learn and identify basic candlestick patterns like doji, hammer, and shooting star on BTC price charts. Traders can then use these patterns to spot potential market trend reversals and determine whether to buy or sell BTC. These patterns should be confirmed with other technical indicators and used in conjunction with proper risk management strategies. Incorporating candlestick patterns into trading strategies can increase the chances of making profitable trades and minimizing losses.

Successful traders rely on backtesting to be profitable.
Be like them with our
Free Backtesting Guide