
-
 Create
account -
 Build trading strategies
with no code -
 Validate
& Backtest -
 Connect exchange
& start earning
Quant Strategies & Backtesting results for ETH
Here are some ETH trading strategies along with their past performance. You can validate these strategies (and many more) for free on Vestinda across thousands of assets and many years of historical data.
Quant Trading Strategy: MVWAP and VWAP Crossover on ETH
The backtesting results for the trading strategy from December 12, 2018, to December 12, 2023, reveal some promising statistics. The profit factor stands at 1.85, indicating a positive return on investment. The annualized return on investment is an impressive 314.9%, showcasing the strategy's potential for high profits. The average holding time for trades is around 2 weeks and 6 days, implying a moderate-term approach to capturing profits. With an average of 0.19 trades per week, the strategy adopts a relatively cautious and selective trading approach. Over the given period, there were 50 closed trades, contributing to a remarkable return on investment of 1574.51%. Furthermore, the strategy achieved a decent winning trades percentage at 50%, suggesting a balanced mix of profitable and losing trades.

 ETHUSDT

Choose another period and try again.
Quant Trading Strategy: Awesome Oscillator Momentum Strategy on ETH
The backtesting results for this trading strategy, covering the period from December 14, 2018, to December 14, 2023, reveal promising statistics. The profit factor stood at 1.91, indicating a decent return on investment. The annualized ROI displayed an impressive 285.81%, reflecting substantial growth over the evaluated timeframe. On average, trades were held for approximately 4 weeks and 5 days, indicating a longer-term strategy. The average number of trades executed per week was relatively low at 0.08, suggesting a more selective approach. With 23 closed trades, the strategy demonstrated some level of activity. Winning trades accounted for 52.17% of the total, signaling a slightly favorable success rate. Overall, these backtesting results showcase a notable return on investment, emphasizing the potential viability of this trading strategy.
ETHUSDT
Choose another period and try again.
ETH Trading Chart Patterns: A Comprehensive Guide
- Identify the chart pattern: Look for common patterns like triangles, flags, and double tops.
- Confirm the pattern: Ensure that the pattern is valid by checking for specific criteria.
- Set up the trade: Determine your entry and exit points based on the pattern.
- Set stop-loss and take-profit levels: Decide on the levels to limit potential losses or secure profits.
- Monitor the trade: Keep an eye on price movements and indicators to confirm the pattern's validity.
- Manage risk: Adjust stop-loss levels if necessary and consider position sizing to control risk.
- Make the trade: Execute the buy or sell order based on your analysis.
ETH (Ethereum) Chart Patterns: Unlocking Trading Opportunities for Maximum Gains
Introduction
Ethereum (ETH) is one of the most actively traded cryptocurrencies in the world, making it a prime candidate for technical analysis using chart patterns. Identifying and understanding these patterns can unlock significant trading opportunities, whether you are a day trader, swing trader, or long-term investor. This article will delve into the most effective chart patterns for trading ETH and how you can leverage them to enhance your trading strategy.
Why Chart Patterns Matter in ETH Trading
- Visual Representation of Market Psychology: Chart patterns reflect the collective psychology of market participants, revealing trends, potential reversals, and continuation signals.
- Predictive Power: Recognizing specific patterns can help traders anticipate future price movements, providing an edge in the highly volatile cryptocurrency market.
- Versatility: Chart patterns can be applied across different timeframes, making them useful for various trading styles, from day trading to long-term investing.

Key ETH Chart Patterns to Watch
Ascending and Descending Triangles
Pattern Description: Triangles are continuation patterns that typically form during consolidation periods. An Ascending Triangle has a flat top resistance with rising lows, while a Descending Triangle has a flat bottom support with falling highs.
How to Trade It:
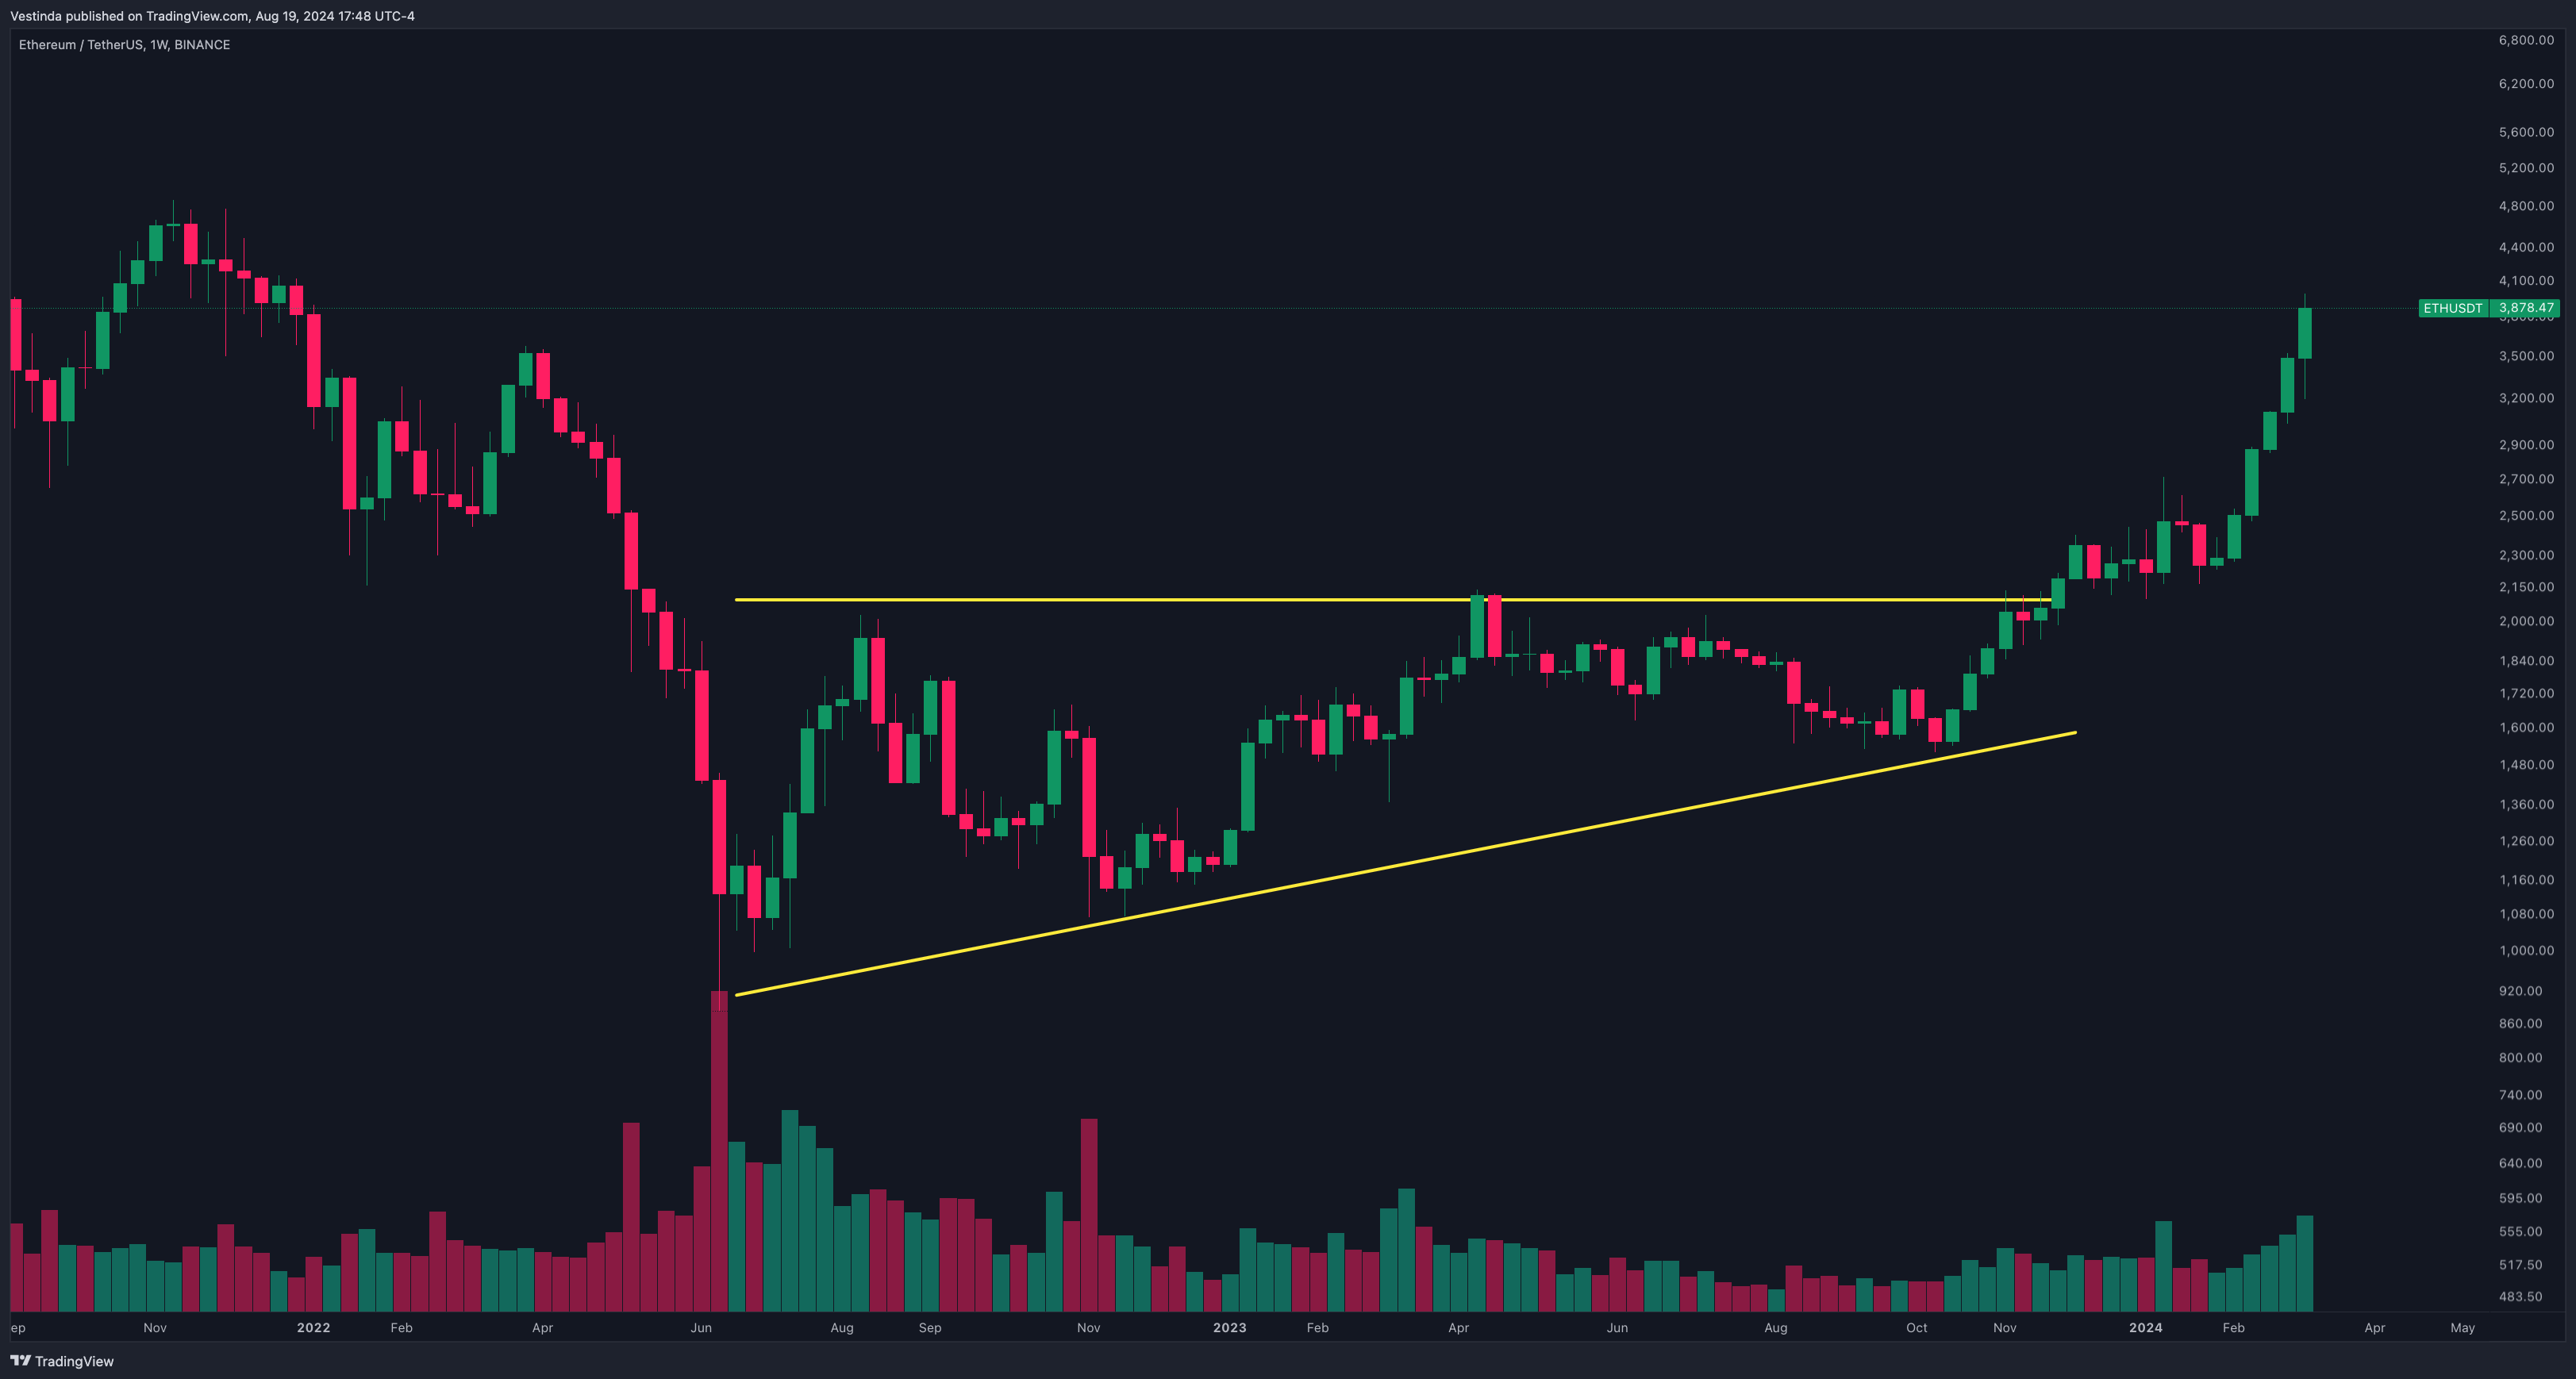
- Ascending Triangle: Buy when the price breaks above the flat resistance line, indicating a potential continuation of the uptrend.

- Descending Triangle: Sell when the price breaks below the flat support line, indicating a potential continuation of the downtrend.
Double Top and Double Bottom
Pattern Description: The Double Top is a bearish reversal pattern that forms after an uptrend, characterized by two peaks at roughly the same level. The Double Bottom is a bullish reversal pattern that forms after a downtrend, characterized by two troughs at roughly the same level.
How to Trade It:

- Double Top: Look for a sell signal when the price breaks below the support level between the two peaks.
- Double Bottom: Look for a buy signal when the price breaks above the resistance level between the two troughs.

Implementing Chart Patterns in Your ETH Trading Strategy
- Multiple Timeframe Analysis: Use chart patterns across different timeframes (e.g., 4-hour, daily, weekly) to confirm signals and improve accuracy.
- Combining with Indicators: Enhance the reliability of chart patterns by combining them with technical indicators like RSI, MACD, or Moving Averages.
Merging Indicators for ETH Analysis
When it comes to analyzing the cryptocurrency market, using multiple indicators can provide a more comprehensive perspective. Combining technical indicators such as moving averages, relative strength index (RSI), and volume can offer valuable insights. These indicators help identify trends, momentum, and potential reversal points. Additionally, incorporating fundamental analysis, such as news events and project developments, can provide a broader context for interpreting price movements. When using multiple indicators, it is crucial to consider their individual strengths and weaknesses. Some indicators may be more suitable for short-term trading, while others may be better indicators of long-term market trends. It is also important to recognize that no single indicator can provide a complete picture of market conditions. Therefore, combining different indicators in a carefully balanced manner can enhance the accuracy of analysis and potentially improve trading decisions. For example, when analyzing the ETH market, a trader could consider incorporating indicators like the 50-day moving average, RSI, and recent news about upgrades or partnerships.
Confirm ETH's Head and Shoulders potential
Confirmation plays a crucial role in the interpretation of head and shoulders patterns. These patterns form after a bullish trend and indicate a potential reversal in the market. Reliable confirmation helps traders distinguish between a false breakout and a valid pattern. The presence of higher trading volume during the formation of the final shoulder is an essential confirmation factor. It indicates increased selling pressure, suggesting that a bearish trend is likely to follow. Furthermore, price confirmation is another crucial aspect. A break below the neckline after the completion of the pattern confirms the reversal and provides a target for measuring the potential downside move. Traders should remember that confirmation is essential for reducing false signals and increasing the accuracy of their trading decisions. For example, in the case of ETH, a confirmed head and shoulders pattern could signal a potential downward trend, prompting traders to adjust their strategies accordingly.
Trendline Confirmation for Chart Patterns and ETH
Using trendlines can be a valuable tool for confirming chart patterns in the cryptocurrency market. Trendlines are drawn by connecting the highs or lows of a price movement and can help identify the direction of a trend. When a chart pattern, such as a triangle or a head and shoulders pattern, forms, trendlines can be used to validate the pattern. By drawing a trendline that connects the highs or lows of the pattern, traders can confirm the validity of the pattern and anticipate potential price movements. For example, if a descending triangle pattern is identified, a trendline can be drawn connecting the lower highs of the pattern to validate its presence. This confirmation can provide traders with added confidence in their analysis and help them make more informed trading decisions in the volatile world of cryptocurrency, like ETH.
Sophisticated backtesting is not only possession of high-esteemed hedge funds anymore.
Impressive Team and support, Backtesting engine with detailed reports, The Strategy builder.

Great purchase!
I have always manually invested in stocks and cryptocurrencies, but after studying Vestinda, I must say it has enormous potential.

Mature platform for trading
Pro: Easy to use, Nice UX, A lot of customization for strategies, Back testing is an awesome tool, can check any strategy in history.

Frequently Asked Questions
To avoid false breakouts, it is essential to use multiple confirmation signals. Simply relying on a single indicator may lead to inaccurate results. Applying filters such as trendlines, moving averages, or support and resistance levels can help identify genuine breakouts. Additionally, waiting for a candlestick or price bar close above or below the breakout level can ensure confirmation. Traders should also consider the overall market conditions and volume patterns to validate the breakout. By incorporating these strategies, one can reduce the risk of falling for false breakouts and make more informed trading decisions.
The W symbol in trading typically represents a stock or security that has formed a chart pattern known as a "double bottom." This pattern resembles the letter W, with two downward price movements followed by a reversal and two upward price movements. The W pattern is generally considered a bullish signal, suggesting a potential trend reversal from bearish to bullish. Traders often use this pattern to identify buying opportunities and anticipate a potential upward movement in the stock's price. It is important to analyze other technical indicators and market conditions before making any trading decisions based solely on a W pattern.
Yes, there are specific chart patterns that can help identify bullish trends in financial markets. Some common patterns include the "cup and handle," where the price initially forms a rounding bottom, followed by a small retracement before a breakout; the "ascending triangle," characterized by a flat top and rising support line; and the "inverse head and shoulders," which consists of three successive bottoms with the middle one being the lowest. These patterns suggest potential bullish trends as they indicate a shift from selling pressure to buying pressure, providing traders with signals to enter long positions.
Yes, it is possible to trade using a 1-minute chart. This short timeframe allows for quick analysis and execution of trades, making it popular among day traders and scalpers. However, trading on such a small timescale can be more challenging and stressful due to increased market noise and false signals. It requires a thorough understanding of technical indicators, risk management, and constant monitoring. Traders must be disciplined and have a well-defined strategy to profit from the rapid price fluctuations within this minute timeframe.
Conclusion
In conclusion, ETH chart patterns are valuable tools for traders looking to navigate the volatile world of cryptocurrency trading. These patterns allow traders to analyze historical data and predict future market trends. By identifying specific formations on trading charts, traders can make informed decisions about when to buy or sell ETH. Additionally, incorporating other indicators, such as harmonic patterns, technical indicators, and trendlines, can provide a more comprehensive perspective and enhance the accuracy of analysis. Confirmation is crucial in validating chart patterns and reducing false signals. By following these strategies, traders can enhance their ETH trading strategy and take advantage of profitable opportunities in the cryptocurrency market.

Successful traders rely on backtesting to be profitable.
Be like them with our
Free Backtesting Guide