
-
Track your
Crypto Portfolio -
Copy Crypto trading
strategies -
Build trading strategies
with no code
-
Backtest trading strategies
on Crypto, Forex, Stocks, etc. -
Demo Trading
Risk-free Paper Trading -
Automate trading strategies
with Live Trading
Quant Strategies & Backtesting results for ETH
Here are some ETH trading strategies along with their past performance. You can validate these strategies (and many more) for free on Vestinda across thousands of assets and many years of historical data.
Quant Trading Strategy: MVWAP and VWAP Crossover on ETH
The backtesting results for the trading strategy over a period from December 12, 2018, to December 12, 2023, reveal promising statistics. With a profit factor of 1.85 and an annualized ROI of 314.9%, the strategy demonstrates a strong ability to generate profits. On average, trades are held for approximately 2 weeks and 6 days, indicating a moderate holding period. With an average of 0.19 trades per week, the strategy maintains a conservative approach. The strategy recorded 50 closed trades during the period, achieving a remarkable return on investment of 1574.51%. Furthermore, 50% of the trades were successful, reflecting a balanced win-loss ratio. These results highlight the potential effectiveness of the trading strategy.

 ETHUSDT

Choose another period and try again.
Quant Trading Strategy: Awesome Oscillator Momentum Strategy on ETH
Based on the backtesting results statistics for a trading strategy from December 14, 2018, to December 14, 2023, several notable figures emerge. The profit factor stands at 1.91, indicating a healthy return on investment. The annualized ROI stands at an impressive 285.81%, showcasing the strategy's ability to generate substantial returns over the specified period. The average holding time for trades amounts to 4 weeks and 5 days, indicating a relatively moderate investment horizon. With an average of 0.08 trades per week, the strategy proves to be more selective in its approach. Out of 23 closed trades, approximately 52.17% have been winning trades. Overall, the return on investment reaches a staggering 1429.06%.
ETHUSDT
Choose another period and try again.
ETH (Ethereum) Candlestick Patterns: Unveiling Lucrative Trading Strategies
Introduction
Candlestick patterns are a cornerstone of technical analysis, providing traders with critical insights into Ethereum’s price action. Among the most reliable and easy-to-spot patterns are bullish and bearish engulfing patterns, which signal potential trend reversals. This guide explains how to identify and use these patterns effectively in Ethereum trading.
Why Focus on Bullish and Bearish Engulfing Patterns?
- Simplicity: These patterns are straightforward to identify on any chart.
- Reliability: They often provide strong signals for trend reversals.
- Versatility: Suitable for various timeframes, from intraday to long-term trading.
Understanding Bullish and Bearish Engulfing Patterns:
Bullish Engulfing Pattern:
- Definition: A green candlestick fully engulfs the previous red candlestick.
- Significance: Indicates a shift from selling to buying pressure, signaling a potential upward reversal.
- How to Identify:
- Occurs after a downtrend or pullback.
- The green candle’s body completely covers the red candle’s body.
- Trading Strategy:
- Entry: Go long when the next candle closes above the bullish engulfing pattern’s high.
- Stop-Loss: Place a stop-loss below the engulfing candle’s low.
- Take-Profit: Target the next resistance level or use a risk/reward ratio of 1:2.

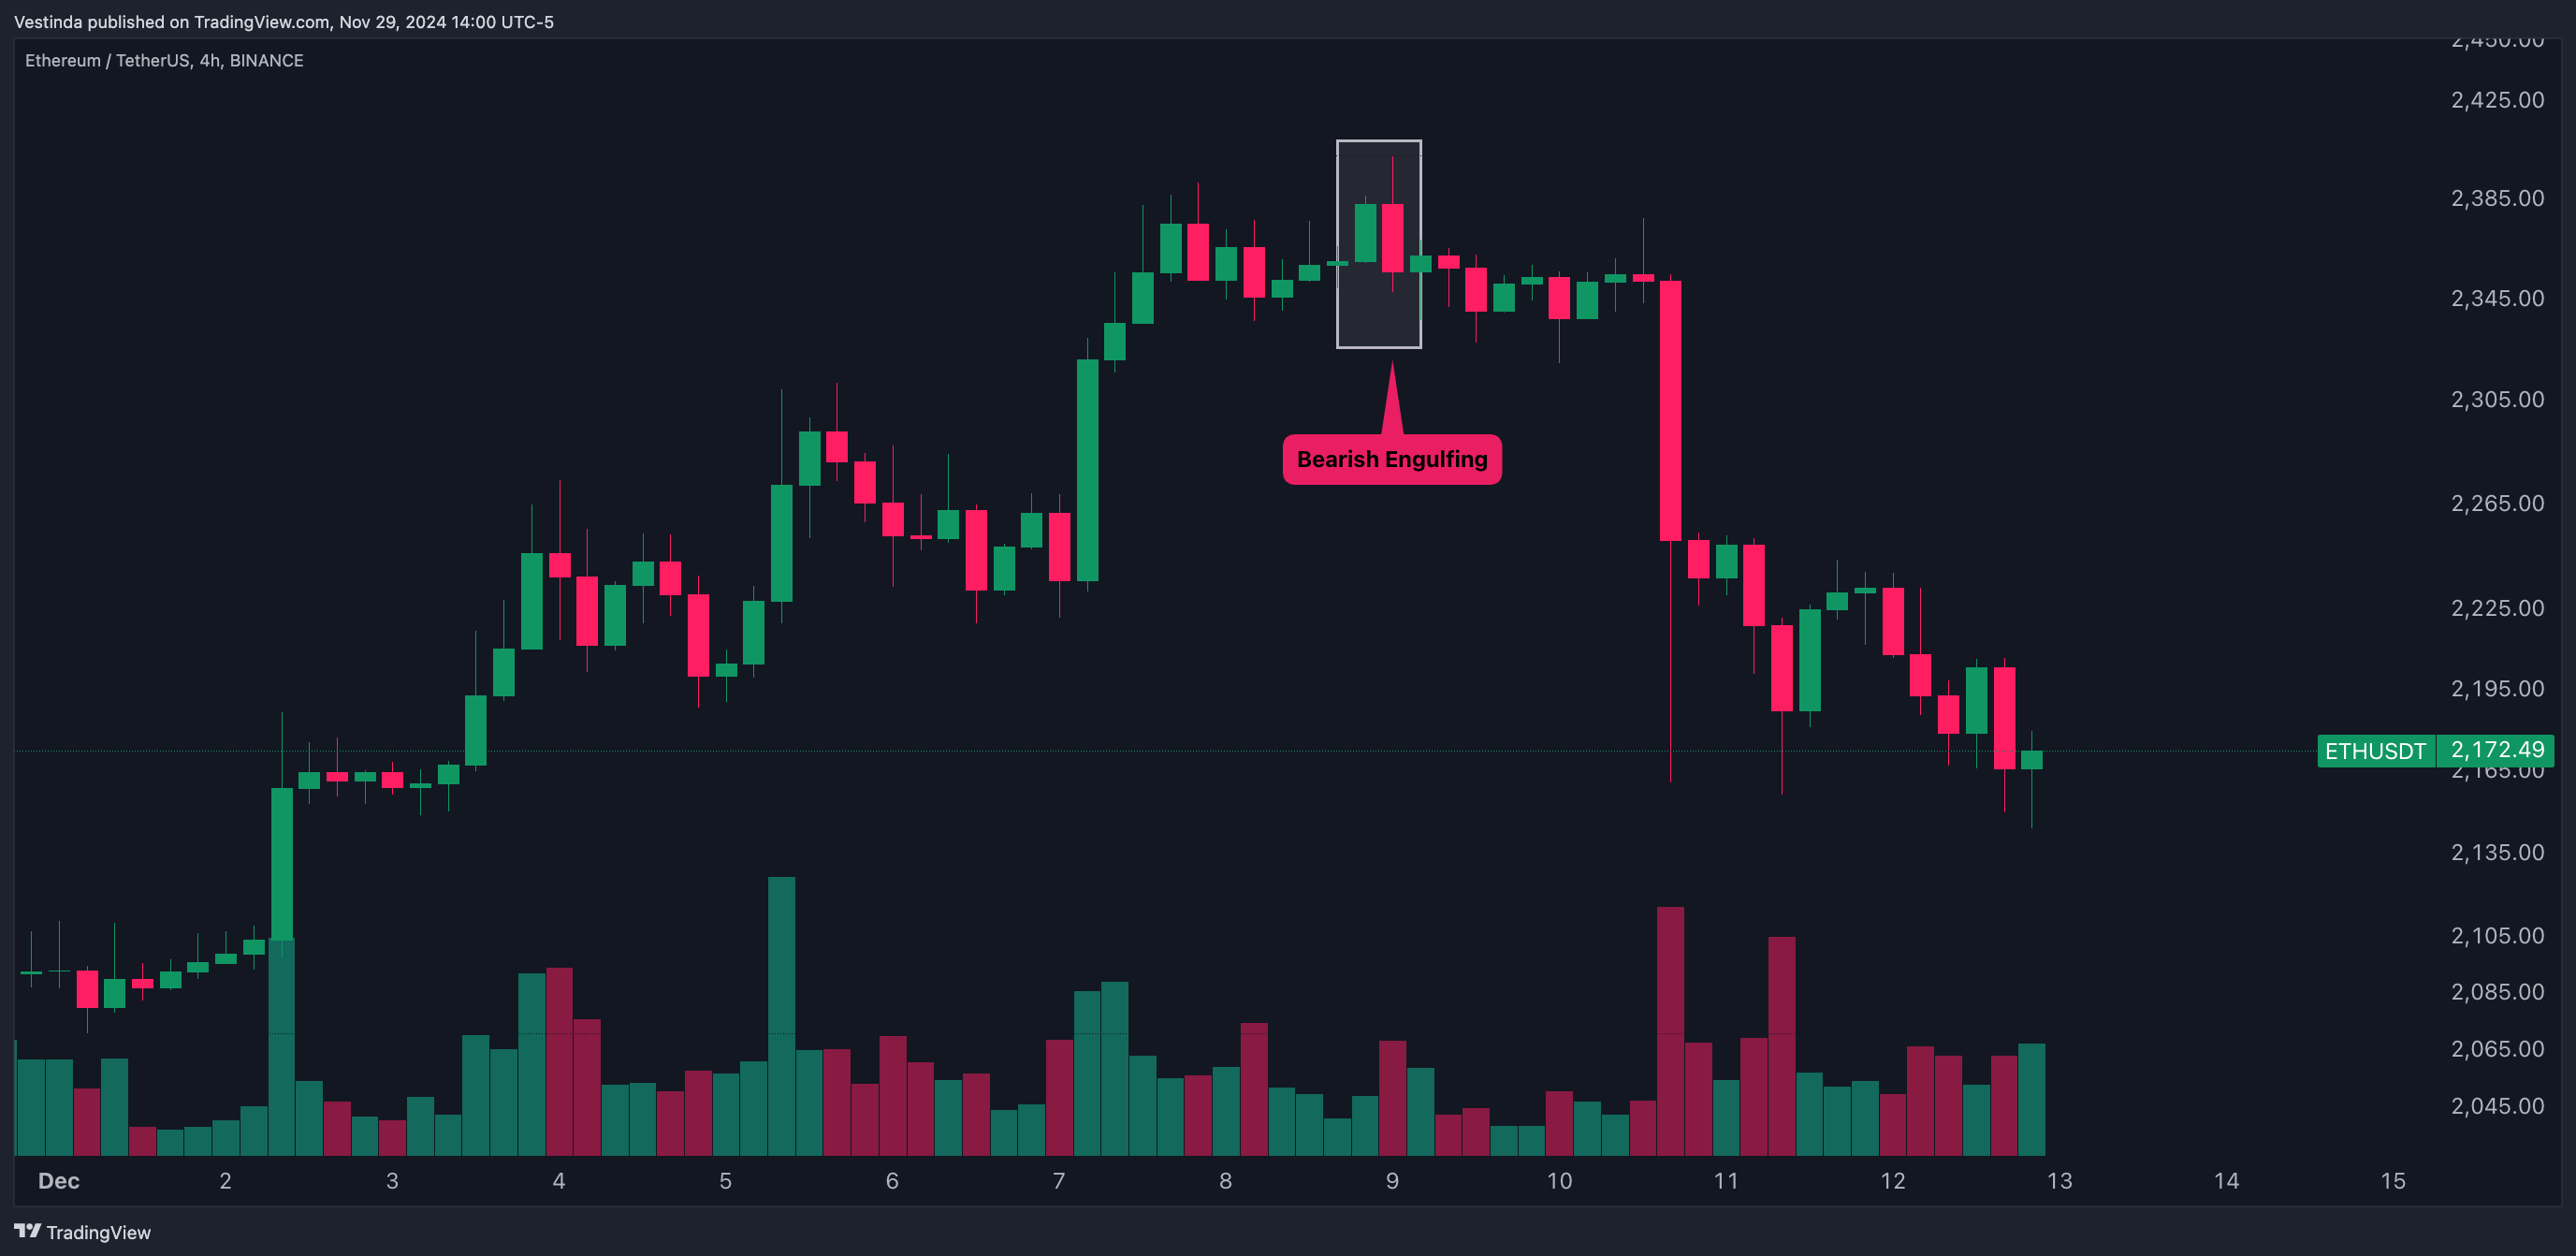
Bearish Engulfing Pattern:
- Definition: A red candlestick fully engulfs the previous green candlestick.
- Significance: Indicates a shift from buying to selling pressure, signaling a potential downward reversal.
- How to Identify:
- Occurs after an uptrend or rally.
- The red candle’s body completely covers the green candle’s body.
- Trading Strategy:
- Entry: Go short when the next candle closes below the bearish engulfing pattern’s low.
- Stop-Loss: Place a stop-loss above the engulfing candle’s high.
- Take-Profit: Target the next support level or use a risk/reward ratio of 1:2.
Enhancing Trading Signals with Indicators:
- Combine with RSI: Use RSI to confirm overbought or oversold conditions.
- Example: A bullish engulfing pattern is stronger when RSI exits oversold territory.
- Use Moving Averages: Identify the broader trend with a 50-period EMA.
- Example: Enter bullish trades only if the price is above the 50 EMA.
- Volume Confirmation: Check for increased trading volume during the engulfing pattern for stronger confirmation.
- Example: Higher volume during a bullish engulfing pattern indicates strong buying pressure.
Applying Engulfing Patterns Across Timeframes:
- Intraday Trading: Use 15-minute or 1-hour charts to capture quick reversals.
- Ideal for scalping or short-term trades.
- Swing Trading: Focus on 4-hour or daily charts for broader trend reversals.
- Combine with Fibonacci retracement levels for precise entries.
- Position Trading: Identify engulfing patterns on weekly charts to align with long-term trends.
Tips for Success:
- Wait for Confirmation: Always wait for the next candle to confirm the reversal before entering a trade.
- Context Matters: Look for patterns near key support or resistance levels for higher reliability.
- Backtest Strategies: Test your approach on historical Ethereum charts to evaluate effectiveness.
Common Mistakes to Avoid:
- Ignoring Market Context: Avoid trading engulfing patterns during choppy or sideways markets.
- Overtrading: Focus on high-quality setups rather than forcing trades.
- Neglecting Risk Management: Always use stop-loss orders to protect your capital.
Conclusion:
Bullish and bearish engulfing patterns are powerful tools for Ethereum traders, offering reliable signals for trend reversals. By combining these patterns with technical indicators, volume analysis, and disciplined risk management, traders can enhance their profitability. Practice spotting these patterns and refining your strategies to unlock Ethereum’s trading potential.
ETH Candlestick Patterns: Optimize Your Trading Strategy
- Learn the basic candlestick patterns: doji, hammer, engulfing, and shooting star.
- Analyze the ETH chart and identify any of these patterns.
- Confirm the pattern by looking at the previous candlestick and volume.
- Wait for the pattern to complete and the next candlestick to form.
- Set your entry, stop-loss, and take-profit levels based on the pattern's signals.
- Place your trade and closely monitor the price movement.
- If the pattern fails, exit the trade according to your risk management strategy.
ETH Piercing Pattern Analysis
The Piercing Pattern is a bullish candlestick pattern that signals a potential reversal in downtrends. It consists of two candles, where the first candle is a large bearish candle and the second candle is a bullish candle that opens below the low of the previous candle but closes above its midpoint. This pattern shows that buyers have stepped in after a period of selling pressure and suggests that the downtrend may be losing momentum. Traders often use the Piercing Pattern as a buy signal, looking for opportunities to enter long positions in the market. However, it is important to consider other technical indicators and market conditions before making any trading decisions. As with any candlestick pattern, it is recommended to wait for confirmation before taking action. The Piercing Pattern can be a powerful tool for traders who understand how to interpret and use it effectively in their trading strategies.
Crypto Price Forecasting: Candlestick Pattern Analysis for ETH
Candlestick patterns can be a valuable tool in predicting the price movement of Ethereum (ETH). These patterns provide crucial insights into market sentiment and can help traders make informed decisions. A hammer candlestick, for example, can indicate a potential trend reversal, while a doji suggests market indecision. By analyzing these patterns, traders can identify key support and resistance levels, as well as potential entry and exit points. However, it's important to use candlestick patterns in conjunction with other technical indicators to validate predictions. Additionally, it is crucial to consider the overall market conditions and news events that may impact ETH's price. By combining multiple strategies and approaches, traders can leverage candlestick patterns to improve their ETH price prediction accuracy.
Candlestick Reversal Patterns: ETH's Morning & Evening Stars
Morning Doji Star and Evening Doji Star are significant candlestick patterns used in technical analysis. The Morning Doji Star comprises of three candles – a bearish candle, a Doji candle, and a bullish candle. It suggests a potential reversal from a downtrend to an uptrend. The Doji candle signifies indecision in the market, highlighting a possible change in sentiment. On the other hand, the Evening Doji Star is the opposite pattern, indicating a potential reversal from an uptrend to a downtrend. It also consists of three candles – a bullish candle, a Doji candle, and a bearish candle. Traders and investors often look for these patterns to identify potential reversals and make informed trading decisions. It is important, however, to incorporate other technical indicators and conduct thorough analysis before making any trading decisions, especially in the volatile cryptocurrency market, such as ETH.
-
100,000 available assets New
-
years of historical data
-
practice without risking money

Frequently Asked Questions
There isn't a definitive answer to which candlestick pattern is the best, as it ultimately depends on the context and the trader's strategy. Different patterns, such as the doji, hammer, engulfing, or shooting star, provide valuable information about market sentiment and potential price reversals. Traders should focus on understanding the patterns, their reliability, and how they align with other technical indicators or support/resistance levels. It's crucial to combine candlestick patterns with other forms of analysis to make informed trading decisions. Ultimately, traders should choose patterns that align with their trading style and have a history of success in their preferred market conditions.
The best time candle for day trading depends on the individual's trading strategy and preferences. Shorter time candles such as 1-minute or 5-minute can provide more frequent trading opportunities due to their high volatility and quick price movements. They allow traders to capitalize on short-term market fluctuations. On the other hand, longer time candles like 15-minute or 1-hour can offer more reliable trends and patterns, offering a better overall understanding of the market. Ultimately, it is important for day traders to experiment and find the time candles that align with their trading style and goals.
Reversal candles, also known as candlestick patterns, are formations in technical analysis that suggest a potential change in the direction of a price trend. These candles typically have distinct shapes, such as a doji, hammer, or shooting star, which indicate a shift in market sentiment. A bullish reversal candle occurs after a downtrend and implies a possible upward reversal, while a bearish reversal candle appears after an uptrend, signaling a potential downward reversal. These patterns are beneficial for traders as they can provide signals to enter or exit trades based on the anticipated trend reversal.
The reverse candle indicator is a technical analysis tool that helps traders identify potential trend reversals in financial markets. It analyzes the shape and structure of candlestick charts to predict future price movements. Unlike traditional candlestick patterns, such as doji or hammer, the reverse candle indicator focuses on spotting candles that are opposite to the prevailing trend. These reversal candles often have long upper or lower wicks and small bodies, suggesting a shift in market sentiment. Traders use this indicator to make educated trading decisions and spot potential opportunities for entering or exiting positions.
Conclusion
In conclusion, ETH candlestick patterns are valuable tools for traders in the cryptocurrency market. These patterns provide insights into price action, helping investors anticipate trends and make informed decisions. By understanding and analyzing these patterns, traders can adjust their strategies and navigate the volatile world of cryptocurrency trading more effectively. Candlestick patterns such as the Piercing Pattern, hammer, doji, Morning Doji Star, and Evening Doji Star, among others, can be used to identify potential reversals and entry/exit points. However, it's important to consider other indicators, market conditions, and conduct thorough analysis before making any trading decisions in the ETH market.

Successful traders rely on backtesting to be profitable.
Be like them with our
Free Backtesting Guide